KADIR HAS UNIVERSITY
GRADUATE SCHOOL OF SCIENCE AND ENGINEERING
STRUCTURAL STUDY OF GABA TYPE A RECEPTOR:THE EFFECT OF INTRASUBUNIT DISULPHIDE BRIDGES ON DYNAMICS
MERAL AYAN
Meral Ayan M.Sc. Thesis 2014
STRUCTURAL STUDY OF GABA TYPE A RECEPTOR:THE EFFECT OF INTRASUBUNIT DISULPHIDE BRIDGES ON DYNAMICS
MERAL AYAN
Submitted to the Graduate School of Science and Engineering in partial fulfillment of the requirements for the degree of
Master of Science in
Computational Biology and Bioinformatics
KADIR HAS UNIVERSITY
June, 2014 APPENDIX B
ii
“I, Meral Ayan, confirm that the work presented in this thesis is my own. Where information has been derived from other sources, I confirm that this has been indicated in the thesis.”
© MERAL AYAN İstanbul, 2014
iii
Abstract
STRUCTURAL STUDY OF GABA TYPE A RECEPTOR: THE EFFECT OF INTRASUBUNIT DISULPHIDE BRIDGES ON DYNAMICS
Master of Science in Computational Biology and Bioinformatics Advisor: Asst Prof. Şebnem Eşsiz GÖKHAN
June, 2014
In the mammalian brain the gamma-aminobutyric acid type A receptor ( ) is the most commonly expressed subtype of receptor family. Although there is a rich pharmacological activity of R, specific molecular features are still not well known. In this study, we developed a new homology model based on a recently available X-Ray structure of the glutamate-gated chloride channel (GluCl). When it is compared with previous homology models of the based on lower sequence identity templates, there are three additional disulphide bridges occurring in between membrane spanning alpha helices namely two in the alpha and one in the gamma subunits. These new disulphide bridges are occurring due to the differences in the sequence alignments of template and target structures.
Additionally, we performed molecular dynamics simulations with two models, one with the disulphide bridges in the transmembrane domanin (TMD), and the other without disulphide bridges. To analyze simulation results, minimum pore radius along the pore, root-mean-square deviation (RMSD) of proteins and root mean square fluctuation of C alpha (RMSF)are analyzed.Finally principal component analysis of the 100 nanosecond long trajectory is calculated to compare the differences in the correlated motions of two models.
iv
Özet
Memeli beyninde yaygın bulunan reseptör ailesinin, hakkında en fazla bilgi sahibi olunan üyesidir. zengin farmakolojik aktivite göstermesine rağmen, spesifik moleküler yapısı hakkındaki bilgimiz sınırlıdır.
Biz bu çalışmada , homoloji metod denilen yöntemle ökaryotik , glutamate –kapılı klor kanalı (GluCl) X-Ray yapısını , taslak olarak kullanılıp oluşturduğumuz reseptörü
üyesinin, transmembran bölgesine, iyon iletim mekanizması ve protein dinamiği üzerinde etkili olacağını düşündüğümüz disülfit köprüler oluşturduk. Oluşturan bu disülfit köprüler iki alpha altbirimde birer adet ve gamma altbirimde de bir adet olmak üzere toplamda üç adettir. Çalışmamızda disülfüt köprüler ilave edilen modeli ‘model 2’ diğerini de ‘model 1’ olarak adlandırdık. 140 nanosecondlık Moleküler Dinamik Simülasyonu ardından iki modelin dengeye ulaştığı 40 nanosecondlık ilk kısmı ihmal ederek analizlerimizi simulasyounumuzun son 100 nanosecondluk bölümü için gerçekleştirdik. Pore yapısında önemli değişime neden olmayan disülfit köprülerin reseptörün hareketlerinde ve özellikle C loop, M2-M3 bağlantı bölgesinde bölgelerindeki önemli etkilerini gözlemledik.
v
Acknowledgements
I would like to express my deepest gratitude for my thesis supervisor Asst. Prof. Şebnem Eşsiz Gökhan for the continuous support of my master’s study and myresearch. This thesis would not have been possible without the her help and her guidance .
Besides my advisor, I would like to express my acknowledge to Prof. Dr. Mine Yurtsever , Asst. Prof. Ebru Demet Akten Akdoğan for participating in my thesis jury and also for insightful comments.
I also would like thank Prof. Dr. Kemal Yelekçi, and Dr. Tuğba Arzu Özal for their ncouragement and perceptive notes.
vi
Table of Contents
Abstract ...iii
Özet ...iv
Acknowledgements ...v
Table of Contents …...vi
List of Figures ……...viii
List of Tables ……...ix
1. Chapter 1:Introduction ……...1
1.1. Ion Channels ………...1
1.2. Ligand-gated ion channels ……….….4
1.3.Gamma-Aminobutyric acid type-A Receptor ( ) ……….….7
2. Chapter 2:Theory and Methods………10
2.1. Importance of Disulphide Bridges on Protein Structure ………...10
2.2. Molecular Dynamics ………11
2.2.1. Molecular Dynamics Analysis Tools ……….……...14
2.2.2. Principal Component Analysis ………..………...15
2.2.3. Minimum Radius Calculation:Hole Program ………...17
2.3.Models and Simulations Setup..………..…..…18
3. Chapter 3: Results and Discussion ……….…..…...20
3.1.Effect of Disulphide Bonds on Protein Fluctuation …….………….………. 23
3.2. Effect of Disulphide Bonds on R Pore Motion ………..…….32
vii
CurriculumVitae ………..………..…….…37 5.REFERENCES……….38 6. SUPPORTING MATERIAL ……….40
viii
List of Figures
Figure 1.1: Membrane permeability ………. 2
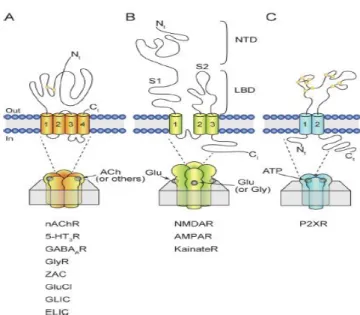
Figure 1.2: Schematic represantation of LGICs family ……….. 4
Figure 1.3: Extracellular domain of with ligands (GABA, BZD) ……….. 7
Figure 2.1: Disulphide bridges ………. 10
Figure 2.2: Bonded interactions ………... 13
Figure 2.3: Extracellular view of R and GABA binding site are represented ……. 18
Figure 2.4: receptor that was created by using GluCl template ……….. 19
Figure 3.1: RMSD results for C alpha atoms along the 140 ns MD simulations ……..….. 20
Figure 3.2: Three subunits of R ……….………. 21
Figure 3.3: Cys residue distance are represented ………... 22
Figure 3.4: Ligand binding site and one of the accepted gating mechanism ………. 23
Figure 3.5: Rms fluctation C alpha atoms of betasubunits ……….. 25
Figure 3.6: Rms fluctation C alpha atoms of gammasubunits ………. 25
Figure 3.7: Rms fluctation C alpha atoms of alphasubunits ……… 26
Figure 3. 8: Cross-correlation maps ……….. 28
Figure 3.9: Pore radius diferences for two models ……… 32
Figure 3.10: Top view of two models alpha helices ………..33
ix
List of Tables
1
1. Chapter 1:Introduction
1.1 Ion channels
Ion channels play an essential role in neurotransmission by regulating ion concentration through neuron membrane. Disruption in neural transmission mechanism causes important common diseases. As a result, ion channels, regulators of neural transmission have been an important class of target for pharmaceutical intervention in a broad range of disease areas such as Alzheimer's, Parkinson's, epilepsy, schizophrenia. According to the 2014 Alzheimer’s Disease and Facts and Figures report just in USA is estimated 7.1 million people who are 65 age and older in a risk for Alzheimer’s Disease. Thus a better understanding of the structure and function relationship of ion channels is an essential step in developing treatments for these widespread neurological diseases.
All the metabolic reactions occur in the cell and sufficuents necessary for the reactions that can not across the lipid bilayer must flow the inside of cell to live. Plasma membrane is selectively permeable to gases ( ) , small uncharged polar molecules (urea,waters). However ions ( ), large uncharged polar molecules (glucose,amino acids) can not across the lipid bilayers (Figure 1.1 ).
2 Figure 1.1. Membrane permeability1
The mechanism of how ion channels function is as the following: Charged molecules can move from an area of high concentration to low concentration by ion channels without using energy. The state of the ion channel in which ions can flow along the channel is called open state, vice versa is called closed state. The conformational change of ion channels from closed to open states is named as “gating mechanism” and this mechanism is controlled by external perturbations such as voltage difference, binding of chemical molecules to the protein orphysical effects such as osmotic pressure depending on the channel type. Accordingly ion channels are classified to which chemical or physical modulator controls their gating activity. Different groups of channels can be summarized as the following6:
● voltage gated channels → transmembrane potential (electric field) ● ligand gated channels → neurotransmitters
●second messenger gated channels nucleotides → G-proteins
● mechanosensitive channels →osmotic pressure - membrane curvature ●gap junctions, porin → not gated.
3
In voltage-gated ion channels gating mechanism is controlled by the difference in membrane potential. Membrane potential changes when ions are present in a higher concentration on one side of a membrane than the other side. When voltage-gated ion channels open, ions can move from higher ion concentration to the side with the lower ion concentration. This drive is also known as the concentration gradient.
In ligand gated ion channels neurotransmitters such as acetylcholine, GABA, glycine bind them directly and this change cause the receptor to go to its open state. Ligand gated ion channels (LGICs) produce rapid synaptic potentials which inhibit or excite the neuron. The ligand-gated ions channels are the subject of my thesis and will be discussed in detail in the following sections.
Second messenger-gated channels are only found in eukaryotes and they are activated by light-sensitive compounds such as odors,pheromones78.
The mechanosensitive channels are found in all cell types. These channels open by touch, cardiovascular regulation, sensing of gravity 9.
Gap junctions are intracellular channels and they allow diffusions of ions directly cell to cell
10
.
How these channels work can be summurized as the following: Membrane potential is named action potential in nervous system. When an impulse occurs, a wave of electrical activity passes along the neuron but interrupt at the terminal of the axon. It cannot cross directly to the other neuron because of a physical gap. The gap is called synapse and the communication between two neurons in this gap is called neurotransmission. Neurotransmitters bind directly to ligand-gated ion channels and they produce rapid synaptic potentials, which may excite or inhibit the neuron. An excitatory postsynaptic potential causes the flux of ions to make the inside of the cell more positive.An inhibitory postsynaptic potential causes the flux of ions to make the inside of the cell more negative11.
4 1.2 Ligand-gated ion channels
Agonists and antogonists are mostly used in clinical treatments. In the beginning of the nineteenth century LGICs are introduced as a concept of pharmalogical receptor. Mainly LGICs are responsible for fast excitatory and inhibitory transmission in mammalin nervous system. There is good evidence that their principal targets are ligand-gated ion channels such as inhibitory (γ-aminobutyric acid) receptors and excitatory nicotinic acetylcholine receptors (nAChR) , which are respectively potentiated and inhibited by general anaesthetics12.They are the targets for many currently used clinically relevant drugs such as nicotine as an agonist for nAChR , carbamazepine as a channel blocker for nAChR, muscimol as an agonist for , clobazam as an agonist for 2( Table 1.1 Vertebrate some LGICs and their drugs).
5
Pentameric LGIC receptors share a common structure of five subunits, pseudo-symmetrically arranged to form a rosette with a central ion-conducting pore (General classification of LGIC is shown in Figure 1.2). They consist of two main groups as cation selective (e.g. nACh and 5-HT3) and anion selective (e.g. and glycine) (Figure 1.2 A). There is an extracellular domain (ECD) that contains the ligand-binding sites,a transmembrane domain (TMD) that allows ions to flux the membrane, and an intracellular domain (ICD) that plays a role in channel conductance and receptor modulation.
The other branch of LGICs family is tetrameric receptors (Figure 1 B) and they have been implicated in dementia, traumatic brain injury , neuronal apoptosis, AD, PD and neuropathic pain2.The third member of LGICs member is ATP-gated P2X receptor (Figure 1C). It has been implicated thromboembolism, bladder instability, pain and implamation2.
In order to study how these proteins are functioning, the very first thing necessary is the 3D structure of the protein. However experimental methods (X-Ray difraction, Nuclear Magnetic Resonance) have some disadvantages specific to membrane proteins. First of all they cannot represent the phsylogical conditions of mebrane proteins properly, namely the lipid bilayer that they are embedded in creates a solubility problems. Besides membrane proteins are large systems due to their molecular weights and they are not suitable for these methods. In spite of these advantages, they are still the main source of structural information of biomolecules. With molecular dynamics and homology modeling techniques we are trying to overcome the problems that are inherited from experimental work. This aspect will be explained in more detail throughout this document. Till very recently most of the 3D structure information for pLGIC has been coming from nAChRs structure. In 1992, nAChR at 9 Å resolution represented by Unwin and coworkers1314.
This resolution was determined by electron microscopy of tubular crytals of Torpedo postsynaptic membranes where nAChRs are found in high concentrations. Then from the same specimen the channel structure at 4,6 Å resolution was represented from the same group. Finally refined model of this channel 4 Å resolution was showed in 2005 by Unwin1516. These low resolution structures were the ones that were utilized for homology modeling attempts different members of pLGIC till recently17. However the sequence identity
6
present between different members of the family is very low and this created problems in modeling studies due to the issues in the sequence alignment.
The prokaryotic members of the pLGICs also started to get investigated besides the eukartoticmembers. Gloebacter violaceus (GLIC) and Erwinia chrysanthemi (ELIC) X-Ray resolutions were represented in 2009. GLIC at 2,9 A resolution , ELIC at 3,3 A resolutionhave more sequence similarity to the eukaryotic pLGICs from other prokaryotic pLGICs. Therefore , GLIC and ELIC are thought that they would be ancestors of the eukaryotic neurotransmitter receptors branch 18.
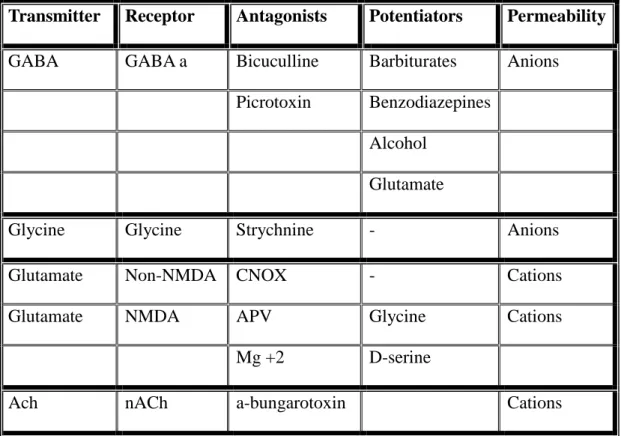
Table 1.1 Widespread LGICs of Vertebrate with their antogonists and potentiators 19 Transmitter Receptor Antagonists Potentiators Permeability
GABA GABA a Bicuculline Barbiturates Anions
Picrotoxin Benzodiazepines Alcohol
Glutamate
Glycine Glycine Strychnine - Anions
Glutamate Non-NMDA CNOX - Cations
Glutamate NMDA APV Glycine Cations
Mg +2 D-serine
7
1.3 GAMMA-AMINOBUTYRIC ACID TYPE– A RECEPTOR ( )
According to the early biochemical studies, gamma-aminobutyric (GABA) acid was found in 1950 and to be present in the brain in primarily in its free form decarboxylation of glutamic acid20. Today , it is known that GABA is the major inhibitory transmitter in the brian20.Gamma-aminobutyric acid (GABA) type A receptor (GABAR) is a major inhibitoryneuroreceptor in human brain. GABARs are homo or hetero pentamers consisting of different subunit combinations. It is known that a pool of 19 distinct genes are responsible for the production of these subunits5.
Most of GABARs in the brain are composed of two α, two β and one γ subunits21
. Although subtype is one of the most prevalent GABARs, gating mechanism of this subtype has not been clarified yet.
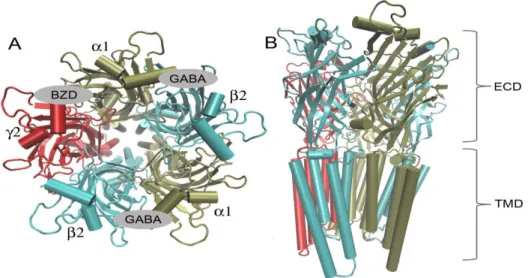
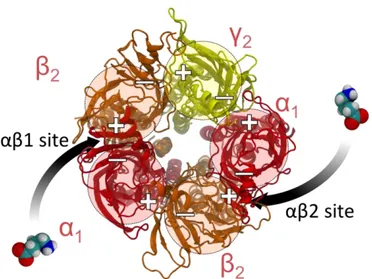
Figure 1.3. A :Extracellular domain of with ligands (GABA, BZD). B: Cartoon representation of showing extracellular (ECD) and transmembrane (TMD) segments
The heteropentameric receptor GABARs are chloride permeating ion channels gated by GABA. On the other hand a variety of pharmacologically important drugs (benzodiazepines, barbiturates, neuroactive steroids, anaesthetics and convulsants) can
8
modulate the GABAR as well. Benzodiazepines (BZDs) are commonly used for treatment of alcohol withdrawal in spite of the efficiency of BZDs for long-term treatment of alcoholism has been still controversial. It is suggested that BZDs is not indicated on a long-term treatment of alcoholism, but clinical reality is that many alcoholics are treated by BZDs during detoxification22. In figure 1.3 BZDs and GABA binding region are illustrated. Development of novel drugs with higher efficiency and lower cost is limited to identifying new binding sites in the protein whill will regulate its ion channel properiesis limited because of the missing details of receptor structure.
Before the X-ray structure of a eukaryotic Cys-loop receptor - a glutamate gated chloride channel from C. Elegans has been solved17 in 2011, the topographical organization of Cys-loop LGIC receptors was studied by using only available X-Ray structure of nACh receptor of the Torpedo electric organ 23 as mentioned above. This template is a better match for GABAR modeling because of three reasons. First of all, bacterial members of this family ELIC and GLIC do not have well-conserved signature Cys-loop. It has been thought that this cys-loop has been conserved evolutionary time in eukaryotes since it is important in the function and structure of the protein in terms of ligand binding. Secondly ELIC and GLIC are cation selective channels, while GluCl is anion selective like . This creates a whole different ion channel structure in terms of positive and negative residue alignments along the pore. Finally ELIC and GLIC represent low sequence identity (18%-%20) to GABAR while GluCl show ~%35 -38 sequence identitydepending on the subunit type. Old template nAChR receptor also has ~%18 sequence identity to GABAR structure. The last one is the most important advantage of GluCl structure since sequence identity/similarity is the essential feature in terms of correctly aligning two protein sequences in homology modelling.
When the gating mechanism is considered it has still not been elucidated due to the mentioned difficulties with obtaining a good representative structure. However, even when the crystal structures are available, they can only provide static pictures. Proteins are dynamics structures and this dynamic structure is regulating their function. Namely theychange their shape and adapt to new forms when they are interacting with water or other small molecules
9
present in their environment. Computational simulations and molecular dynamics (MD) is a commonly used tool to bridge the gaps between the static images by creatingdynamic movies, at an atomic level, of these channels as they transition between functional states24.
In this study, we developed a new homology model based on recently available X-Ray structure of the glutamate-gated chloride channel (GluCl17). When it is compared with old homology models of the , there are three additional disulphide bridges occurring in between membrane spanning alpha helices, two in the alpha and one in the gamma
subunits. These new disulphide bridges are occurring due to the differences in the alignments of helices along the pore.We performed MD simulation with these models to see the effect of these newly occurring bonds in the structure and dynamics. Additional computational tools such as HOLE program for minimum pore radius calculation, RMSD and RMSF and correlation matrices are utilized while we were analyzing MD simulation results.
Visual Molecular Dynamic (VMD) and nanoscale molecular dynamics ( NAMD) were the main tools of our study.
10
2. Chapter 2:Theory and Methods
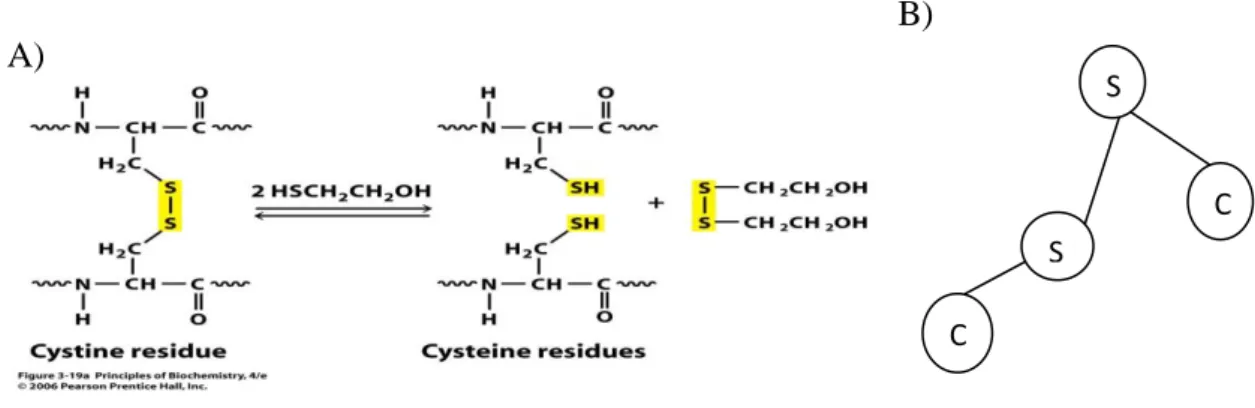
2.1.Importance of Disulphide Bridges on Protein Structure
Disulphide bridges, hydrogen bonds and ionic bonds play an important role in the
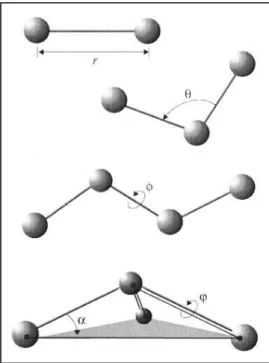
stabilization of the three-dimensional protein structure. Disulphide bonds stabilize peptide chain strands and provide a strong topological constraint.When the thiol groups of cysteine residues are close enough to each other and oxidized, disulphide bonds( S-S) are formed. While the distance between two sulphur atoms is about 2.07 the bond can be occured. Either two amino acids of the same polypeptide chain or two different polypeptide chains can be linked by disulphide bridges. Conformation of a protein can not be changed by disulphide bridges, however they reinforce most favored conformation of a protein24.The dihedral angle between two S-C atoms in the four atoms group C-S-S-C is about . It is make potential barrier to rotation about the S-S bond in the range 10-20 kcal (Figure2.2)25
B) A)
Figure 2.1.A: Disulphide bridges. B: Schematic represent of dihedral between in the four atoms C-S-S-C group.
C S
C S
11
2.2. Molecular Dynamics
Biomolecules in living cells are constantly in motion. The conformational search capability of MD provides en efficient tool to investigate the structure-function relationships of
biomolecules by studying dynamics of the system. Since experimental methods (X-Ray , NMR etc.) represents static images for researchers , MD is an attractive tool for biochemist and biophysicst. Molecular dynamics processes Newton’s equation of motion for a system of N atoms interacting according to a potential energy force field. Since MD provides incorporation of factors such as temperature, pressure controls, researchers can calculate and generate statistical ensemble in MD26. When a system can be represented effectively in MD, experimental and MD results can be observed to promote each other that is already desired state. Typically a molecular dynamics simulation starts with the preparation of the system which is composed of atoms and their starting positions and momentums. Then the system is minimized. After the system temperature is raised to desired temperature,
The system is then allowed to come to equilibrium. After it reaches to equilibrium,the data is collected.
The particles are interacting via a potential energy function, and this function is
defined by different bond and non-bonded terms and calculated by the following formula:
For bonded atoms (called 1,2 pairs) this potential controls the length of covalent bonds and it is based on Hook’s law (harmonic potential)274
.
12
(2.2)
, b, are the bond stretching force constant, the bond lenght, the equilibrium distance. Bond angle potential is used of desinging the bond geometry of triples of atoms.
(2.3)
is angle bending force constant, is bond angle, is equilibrium value parameter. Dihedral angle potential is designed to correct geometry of four atoms and it is calculated,
(2.4)
is force constant, dihedral angle, n is multiplicity and is phase.
Lennard-Jones ( LJ) and Coulomb are the most widely used expressions for the nonbonded interactions.
(2.5)
Nonbonded distance is represented as r, is dispersion well depth, is LJ diameter, are charges and is dielectric parameter. Nonbonded atoms interactions exist between every nonbonded pair of particles in the system.
It is difficult to compute all possible long-range interactions so it is obligation to put limits of neighboor particles and imply cutting off methods to calculate the potential energy of system. Therefore, some approximations such periodic boundary conditions are used in MD.The intrinsic potential described by the force field is also depicted in Figure 2.2.
13
Figure 2.2. Bonded interactions: r shows bond stretching; is the bond angle term; gives the dihedral angle; the small out-of-plane angle is governed by the so-called “improper” dihedral angle 4
NAMD is the Molecular Dynamics package which is utilized in my thesis and it is a program that provides the user with the imply to use external forces to the system. Both CHARMM and AMBER force field are used the parameterizations in NAMD 28
14
2.2.1 Molecular Dynamics Analysis Tools
There are mainly two parameters that are used to analyze the MD simulations. One is the Root Mean Square Deviation (RMSD) and the other one is the Root Mean Square Fluctuation RMSF). RMSD is used to measure the average change in displacement of a selection of atoms for a particular frame with respect to a reference frame.
The RMSD for frame t is:
(2.6)
N is the number of selected atoms, M= and (t) is the position of atom I at time after superimposing on the reference frame. Every frame is recorded. The process is repeated for every frame in the simulation trajectory3031.
RMSF is a method that shows the local changes along the protein chain.
It is measured for residue i is:
(2.7)
In a formula T is the trajectory time over which the RMSF is calculated, is the reference frame, ri(tj) is the position ofresidue at time after superpositioning on the reference , and the angle brackets indicate that the average of the square distance is taken over the selection of atoms in the residue29.
15
2.2.2.Principal Component Analyses
At the end of the MD simulation, complex datasets namely trajectory of the equilibrium system is generated. Statistical methods are used to analyze the trajectory. One such method used for the dimensional reduction of dataset is called Principal Component Analyzes (PCA). PCA, is the linear algebra analyze tool and it consists of three steps. First step is superposition. It means that each of configurations in the trajectory of the protein fit onto a reference structure . Trajectories are used to make a variance-covariance matrix in second step by calculatingdeviations of positions from the average structure. Then a variance-covariance matrix is constructed after superposition with a formula in below:
(2.8)
If the total number of atoms is N, 3N dimensional position shows the trajectory
{ , this symbol is for average over the trajectory segment32.
This formula can also curtail like :
C = <( X (t) - < X > ) (X (t) - < X > > (2.9)
C is symmetric covariance matrix and it can be rewrited with diagonalization by an orthogonal coordinate transformation T:
16
If the system includes N atoms , C is a 3N by 3N matrix. The covariance matrix yields 3N eigenvalues in diagonal matrix and eigenvectors (or principal components) arranges in 3N by 3N matrix. Then eigenvectors are normalized and they represent the intrinsic collective coordinate of protein and the eigenvalues, including 6 zero for translational and rotational motion, present to mean square displacements along these coordinates33.
Correlation analyzes of system at least calculated formula by3234 : (2.11)
where corresponds to the displacement of atom i compared to a reference position. The normalized cross-correlation values range from -1 to 1.35 If two segments of the protein are moving in a fully correlated motion they will have a value of 1 as their value. If two segments of the protein are moving in a fully correlated motion but in opposite directions, they will have a value of -1 as their value.
While we are discussing eigenvalues and eigenvectors of the protein dynamics here, we should look over the other two similar but significantly different methods also: Normal Mode Analysis and Elastik Network Model (ENM). ENM is actually simplified version of Normal Mode Analyzes (NMA) which uses more like an ad-hoc potential to get slowest frequency motions of the protein34. NMA and ENM are both harmonic analysis and limited to small displacements around a single equilibrium. Namely then can not sample over energy barriers since the approximations are valid onlyfor small displacements. NMA does not only have limitiations at functioning temperatures but also have computational diffuculties (for example , CPU time). The potential energy in ENM is approxiamed via connecting C alpha atoms via harmonic springs with uniform force constants.34. In contrast to ENM and NMA,
17
PCA is an unharmonic analysis which can capture fluctuations of the protein although the sampling is far from equilibrium.
2.2.3 Minimum Radius Calculation:Hole Program
Hole is a primary program for the detection of channels of membrane proteins and macromolecules. It was developed to analyze dimension of pores using the Metropolis Monte Carlo simulated annealing procedure 36.Hole program is suitable for Linux and pdb files, CHARMM trajectory can be used as the input.
The pore is sliced into user-defined vector and this vector is vertical to general direction of the pore. Then pore is sliced paralel planes according to the this vertical vector. Randomly a plane which containing the initial point located inside the pore is selected. According to the this selected point, the program produce maximize the radius with Monte Carlo after that, maximal sphere is found. The next plane all process is repetad. The results can moniter VMD,Gnuplot,Matlab.
18
2.3 Models and Simulation Setup
In my thesis I used two models of R which will be named Model1 and Model2 throughout this document. The old one was created by my advisor and her colleagues and the new model was created by adding three disulphide bridges, one in between M1 and M3 helices of the gamma subunit and two again in between M1 and M3 helices but in the two alpha subnunits.
Figure 2.3. Extracellular domain of Using the old model’s pdb and GABA binding site represented between 5
.
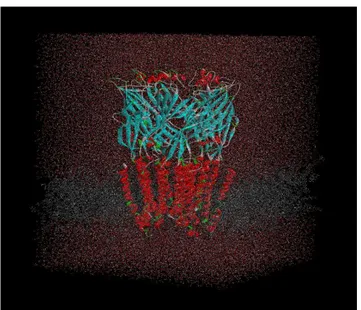
First disulfide bonds are added to the structure in VMD program. Then new structure (pdb) and topology (psf) files have been created, Both system sare inserted into a pre-formed and equilibrated Palmitoyl-oleoyl phosphatidylcholine (POPC) bilayer that was used for previous GABAR simulations 37. Then they are solvated with TIP3P water molecules. At the end, nearly 210.000 atoms are present in both systems (Figure 2.4 below for simulation box). .Both systems were minimized, then simulated for 1 ns with positional restraints implemented on the protein .The positional restraints were subsequently removed ,.then 140 ns MD simulation was run with NAMD. For each time step 2 femtosecond was implied. The first 40
19
ns was disgarded and remaining100 ns trajectory was used for analysis. PTRAJ module of Amber was used for RMSD and RMSF calculations.
All MD simulations were run using the CHARMM force field38 in NAMD38 with a nonbonded vdw cutoff of 12 Å. Production runs were conducted at constant pressure and temperature (NPT). Constant pressure was maintained with a Langevin piston set at 1 atm. Constant temperature was maintained using a Langevin temperature piston set at 310 K. Particle mesh Ewald electrostatics settings were applied to each system. All of the simulations were run with SHAKE [53] and with a 2-fs time step. All of the MD runs were conducted on 512 processors of either the Atlas or Zeus machines at the Livermore Computing Center (Atlas and Zeus are 9216, and 2304 processor AMD Opteron machine)5.
Figure 2.4 : receptor that was created by using GluCl template. This figure is prepared with VMD. Lipids (POPC) are in gray, waters (TIP3P) are in red points and simulated modelling is cyan (ECD) and red (TMD and alpha helices).
20
3.Chapter 3:Results and Discussion
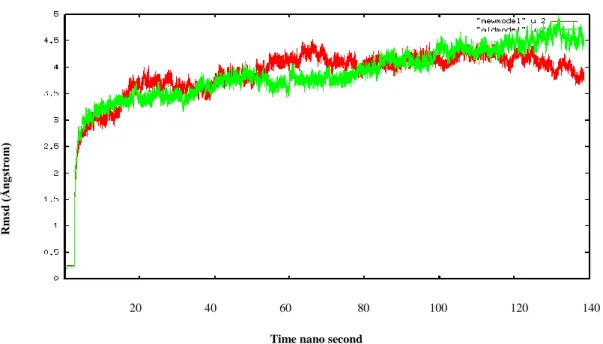
The structural stability of the models was analyzed throughout the equilibration to ensure their quality. First, the root mean squared deviation (RMSD) of the C atoms from their starting positions was calculated. RMSD is described as the distance between two conformations of a biomolecules or group of selected atoms. Both simulations seem to reach to a plateau after 20 ns (note that we disgarded the first 40 ns to be sure of the equilibration). However the model with the disulfide bridges seems more stable while RMSD for model2 plateaud around 4 Å , model1 seems still rising above ~4.5 Å. This shows us that disulfide bridges added to the stability of the model. These bonds are appearing due to the differences in the new sequence alignments. They may have well created some steric clashes with other parts of the molecule. If that was the case, i.e. if there were unfavorable contacts, it would have been reflected in the RMSD values. However in our case we see the opposite, thus we can conclude that these bonds are likely to occur since model2 seems more structurally intact. Additionally RMSD values for both models are comparable even a little better, more stable, then previous MD simulations of the receptor starting with 4 Å resolution5.
20 40 60 80 100 120 140
Time nano second
Figure 3.1: Progress over 140 ns of the RMSD at C alpha atoms for model1 (in green) and model2 (in red).
R msd (Å ng st ro m)
21
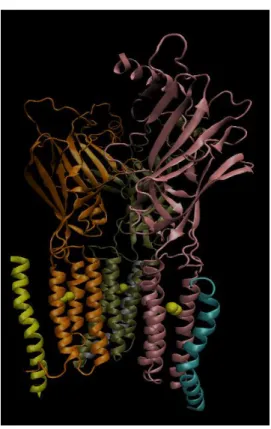
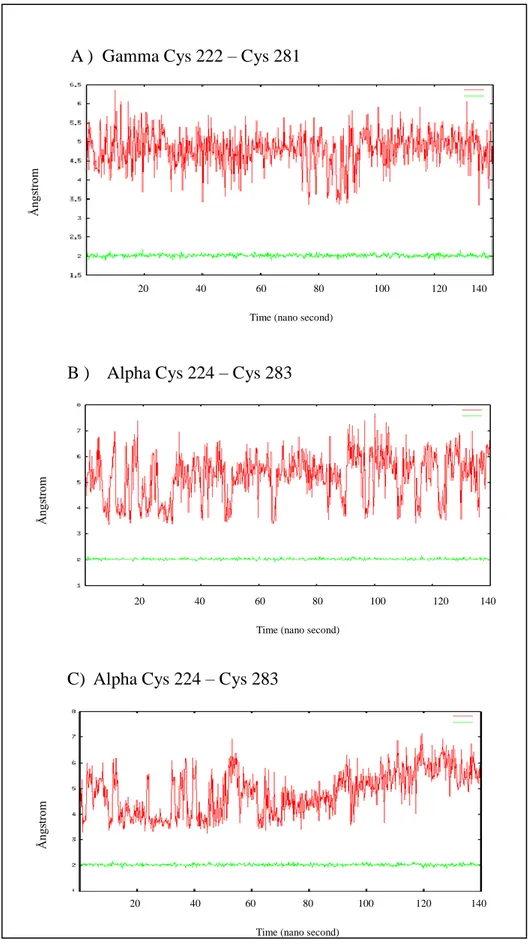
Distances between three Cys residues have been monitored (Figure 3.2) in model1 and model2. In all subunits, the distance is fluctuationg in between in between 3 and 7Å. When this value drops to around 3 Å, it is well in the range for bonding. However as it is observed in model1 lines in Fig 3.3 A-B-C, when there is no physical bond in between Cys residues, the distances fluctuated to much higher values also. This shows that Cys-Cys bridge is possible in these models, however unless it is physically bonded, it doesn’t stay in the limits of the bond. The structure samples different conformation distances for those Cys residues namely.
Figure 3.2 : Different subunits of R. is shown in orange, is shown in dark green, the other is shown lilac. Disulphide bridges Cys residues are shown in yellow colour.
22 A ) Gamma Cys 222 – Cys 281
B ) Alpha Cys 224 – Cys 283
C) Alpha Cys 224 – Cys 283
Figure 3.3. A-B-C : Distance of cysteine atoms in model1 is presented red colour and model2 is presented green colour along the 140 nano second MD simulations.
Å ng st ro m Å ng st ro m Å ng st ro m 20 40 60 80 100 120 140
Time (nano second)
20 40 60 80 100 120 140
Time (nano second)
20 40 60 80 100 120 140
23
3.1 Effect of Disulphide Bonds on Protein Fluctuation
Before discussing the results any further it is better to give a brief discussion about the gating mechanism of GABAR receptor in this section. As stated in the introduction section, most of the structural information is coming from nAchR and recently from bacterial homologues. There is no direct information for GABAR itself. In ligand gated ion channels, in the resting state of the channel, there is hydrophobic girdle that is impermeable to ions. When ligand binds at the interface between different subunits of the ECD (c.f Fig 2.3), C-loop in the ECD closes on top ligand binding site in addition to some other conformational changes in ECD. Then these changes are transmitted to transmembrane helices to open the hydrophobic girdle to permeation of ions. One of the most accepted proposed gating mechanisms is as the following: ligand binding induces conformational change which entails 15 º-16 º rotational movements of the subunit inner sheets relative to the outer sheets of the ECD domain. Then the rotational motion in the inner sheets is transmitted by their connected M2 helices to the hydrophobic girdle, thus weakening the hydrophobic interactions that hold the girdle together Figure 3.4 below39.
Figure 3.4: Ligand binding site is on the left side and in the middle of figure, one of the accepted gating mechanisms contact points is figured on the right side of figure.
24
Still debating part, which will also be explored with RMSF and correlation plots here, is how ECD is communicating with TM. The main question is that whether the communication is through the direct linker from M1 to C-loop, or beta1-beta2 linker is causing the conformational change happening in M2-M3 linker. Both of them may happen at the same time. In the following sections these contact points will be analyzed.
In Figure 3.5, C alpha RMSF values are plotted by calculating average of two beta subunits. Even though there are no additional disulphide bridges occurring in the beta subunits, notice the reduced fluctuations in the transmembrane helices of model2 (green line in Fig 3.5) with respect to model1 (red line). Moreover there is major decrease in the fluctuations of F-loop motion and an increase in the fluctuations of Loop A in model 2 when compared with model1. Loop A is in the close approximity of binding site thus it may have an essential impact in the functionality of LBD. When we look at loop F, various previous works have proposed the direct involvement of this loop in the ligand binding5 40. It is seen that new model loop motion is effected by disulphide bridges and also transmembrane alpha helixs units motion are affected.
25
Figure 3.5:Alpha atoms of fluctuations of betasubunits in two models. Model1 betasubunit is presented in red, model2 betasubunits is in green. F Loop motions reduced in model2. Black vertical line separates ECD from TMD.
Figure 3.6 : Comparision of the fluctuations of C alpha atoms in two gamma subunits of two model, C Loop motions reduced.
Loop F TMD ECD M1 M2 M3 M4 ECD TMD Loop C M1 M2 M3 M4 M2 – M3 linker
26
One of the additional disulphide bridges is occurring in the gamma subunit. In the RMSF plot of this subunit (Figure 3.6) there is a major reduction in the fluctuations of C loop in model 2 .When transmembrane segments are compared, there is slight decrease in the M3-M4 region. It is known that C-loop is closing on top of the ligand. Thus a flexibility change in this segment will directly contribute to the stability of the protein when the ligand binds. Once again notice that the disulphide bridge, which we added, is in between M1-M3 helices, not in ECD segment. However that change seems to be reflected to LBD domain as well.
Figure 3.7: C alpha atoms fluctations of two alpha subunits average of two model. It is seen that fluctuations of transmembrane alpha helices reduced.
In each of the two alpha subunits, there are additional disulphide bridges. RMSF values displayed in the Figure 3.7 are calculated by taking the average of two alpha subunits. There is a noticeable decrease in the fluctuations of M1, M2, M3 and M4 alpha helixs just like the ones in the beta subunits. Moreover fluctuations in Loop C motion in model 2 slightly increase, while there is a decrease in the flexibility of loop A.
ECD TMD
Loop A
Loop C
27
Additionaly correlated motions were effected differently when new disulphide bridges are present. Some correlations became weak such as the ones in the gamma subunit, however some still stronger correlated motions were also observed such as the ones in alpha subunits.
The correlations displayed in Figure 3.8 are the normalized covariance matrix values calculated by Equation 2.11. The system consists of 1655 residues so 4965 eigenvalues and eigenvectors are calculated with PTRAJ suite of AMBER MD package. The eigenvalues are sorted in descending order, thus the first eigenvalue captures the largest amplitute motion of the protein. In the previous studies it has been seen that the first 10 eigenvalues are enough to capture most of the fluctuations in the protein or slowest motion of protein33 41. In our case also, first 10 eigenvalues covers 70 % of total fluctuations and 63 % of total fluctuations. By using the first 10 eigenvectors and eigenvalues, covarince matrix is calculated. The results in Figure 3.8 are the normalized covariance matrix values based on C-alpha atoms and they show how correlated motions were effected when S-S bonds are present.
28
A) 1st beta subunit of model1 B) 1st beta subunit of model2
29
Figure 3. 8 Correlation plots of two models are presented for each subunits. Subunits of model 1 are in the left side and subunits of model 2 are in the right side. Cross-correlation values range from -1 to 1.
E)1st alpha subunit of model1 F)1st alpha subunit of model 2
G)2nd beta subunit of model 1 H)2nd beta subunit of model2
30
When we compared beta subunits of the models, there is major reduction in the correlated motions of Model2 (Figure 3.8B) when compared with Model1 (Figure 3.8A) As mentioned above there is no additional disulphide linking that we added to beta subunits. Interestingly we observe a major change in the beta subunits correlations.
Figure 3.8 C-D shows the correlations in gamma subunit. In the correlation graphs, diagonal segments are for spatially close segments of the protein. However off-diagonal segments shows the correlations between distant segments. There are 3 major peaks disappering when the disulphide bridges are added. The first one is in between D-loop and M2-M3 linker .The second peak disappering is in between D-loop and C-loop. The third peak disappearing is for cys loop and M2-M3 linker. Thus we can derive a mechanism of communication by looking to differences: First of all C loop is the binding site itself and it appears that it is not directly transmitting the motion to TMD. It interacts with D loop and Cys-loop. Then D loop and Cys loop do correlated motions with M2-M3 linker.
In Figure 3.8 E and F, the correlations of the first alpha subunit is displayed. The first observation is that the correlations in the transmembrane segment gets much localized in model2 when compared with model1. When off-diagonal segments are considered M2-M3 linker is correlating with B loop, cys loop, 1 and 4 and these correlated motions are
conserved in both models in alpha subunits (Figure 3.8 E-F).
In model1 of the second alpha subunit, correlated motions in between D loop and M1-M2 linker, B loop, F loop and M4 alpha helice correlated are observed (Figure 3.8 G). These correlated motions were not seen in model2 (Figure 3.8 H). Additionally there is a reduction in the anti correlated motion in between M2-M3 linker and the following segments of the protein: 6, B loop, 10 and the end segment of M4 (circled in Figure 3G). Anti correlation can
be as informative as correlation, since the motions are still related but just in opposite directions. Thus in this figure also, M2-M3 linker is correlating with different segments in ECD.
31
Like the other first beta subunit, in figure Figure 3.8 I-J, the correlation off all segments are reduced when going from model1 to model2. That shows again, the disulphide bridges are stabilizing the protein, and bringing some inflexibility to the conformation of the protein.
32
3.2 Effect of Disulphide Bonds
R pore motion
In Figure 3.9.A minimum pore radius along the pore is displayed. Minimum pore radius is around 2 Ångstrom and it is around the mid section of the pore. This result is expected for the closed state of the channel. In Figure 3.9 B , water profile along the pore is displayed. From this figure it is visible hydrophobic girdle, the minimum pore size, is around the same position as Figure 3.9. A along the pore.
Figure 3.9.A: Pore radius diferences for two model ,B: Pore with waters in VMD.
Model 2 Model 1
A)
33
Figure 3.10:Bottom view of two models transmembrane alpha helices A: Model 1 B: Model 2 A)1st mode of model 1, bottom view of TMD 1452
34
In Figure 3.10 largest amplitude mode of principal component analysis of 100 ns long trajectorty is displayed. The molecule is displayed from bottom of TM segment. In model 1 all five subunits have rotation along pore axis (Figure 3.10 A). In model 2 the motion of each subunit is more like breathing motion around pore axis. Additionally there is a clear bending motion in some of the helices (Figure 3.10 B).
Figure 3.11: Top view of M1 and M3 alpha helices are compared model1 and model2. Without additional disulphide bridges in the left side of figure is about model1. Within additional disulphide bridges in the right side figure is model2.
In Figure 3.11 again largest amplitude motion is displayed just like Figure 3.10. However only the motion in the subunits which have additional disulphide bridges, have been shown, M1 and M3 helices in gamma and two alpha subunit. First the motion in model1 seems less restricted than the motion in model2. Moreover these two helices are moving in more correlated fashion in model2 while disulphide bridge is present. Again as a summary, the motions are affected from disulphide bridges in the transmembrane segment.
35
4.Chapter 4: Conclusion
receptor is like the other members of the pLGICs superfamily which has five subunits that form a pore along the membrane. Each single subunit spans the membrane four times and each of this transmembrane parts are named M1 to M4 that contain an alpha helix. In the M1 to M3 alpha helices, we created disulphide bridges in gamma subunit and two alpha subunits. After 140 ns MD simulations, when we compared the two models ( model1 – model2 ) , alpha helices motion decreased because of these new covalent bonds. Both models are stable along the simulation, although model2 seems more stable from RMSD results. In the RMSF graphs, the C-loop, F-loop and A-loop and transmembrane helices are the main segments that shows a change in the flexibility. Although the disulphide bridges are localized to almost mid transmembrane segment of the protein, it is interesting to observe the changes in the flexibility of the protein in the distant ECD. This is along the allosteric charecteristics of these proteins; mainly ligand binding in the far end of ECD induces conformational change in the distant girdle of the protein to open the ion channel for ion permeation.
C-loop itself closes on top of the ligand when ligand binding event occurs. This is proved by agonist bound experimental structures as well as computational studies. Thus a change by these disulphide bridges in the C-loop flexibility shows the importance of these newly occurring disulphide bridges in the stcruture of the protein39. Morover F-loop has been shown to play an essential role in the transmission of conformational change from ECD to TMD by previous studies. Again a change in the F-loop’s flexibility should be considered while modeling from the template5.
In the correlation graphs, we observed a reduction in the correlations magnitutes when the disulphide bridges are present. However the correlations got more localized at the same time. This is also expected result from the reduction of flexibility of the protein while disulphide bridges are present.
Last but not least, while we investigated the largest amplitude, most collective mode of the protein from PCA analysis, we observed a rotation motion in all the subunits of TMD in model1 along the pore axis, while the motion in model2 is more like a bending motion.
36
Actually both type of motions are suggested in the literature before. Thus the change in the conformational motion prefence of the protein because of the disulphide bridges is indicative of the importance of these newly appearing bonds in the calculation.
As a summary, although it looks like this document is comparing two models, the main point is the importance of homology modeling actually.Namely the importance of sequence alignment in homology modeling is once again shown in the results of this document. In low sequence identity range such as the one with nAchR, some structural details, which stabilized the protein, was left out. Although the sequence identity of GluCl structure with GABAR is still in the low region, clearly an improvement in the stability of the structure has been observed with the additional disulphide bridges occurring due to a better sequence alignment .Within the new model it is emphasized that pore conformation of old model was created correctly. Creating a new model about receptor we suggest that these three disulphide bridges should be considered while modeling from this template.
37
Curriculum Vitae
Meral Ayan was born in 19 June 1977 in Istanbul. Her BS degree received in Biology in 2000 from Istanbul University. After she worked as a biology teacher in courses 4 years then science teaching in a high school for 3 years. Between 2007-2010 she also worked as a purchasing manager in a BIM company, after that she resigned. She was accepted Kadir Has University Department of Computational Biology and Bioinformatics. Her main research interests is life science. She likes reading about science, philosophy and politics. She is single and lives with her family in Istanbul.
38
References
1. Alberts, B. et al. Essential Cell Biology. Arch. Biochem. Biophys. 231, 860 (2004).
2. Lemoine, D. et al. Ligand-gated ion channels: new insights into neurological disorders and ligand recognition. Chem. Rev. 112, 6285–318 (2012).
3. Richter, L. et al. Diazepam-bound GABAA receptor models identify new benzodiazepine binding-site ligands. Nat. Chem. Biol. 8, 455–64 (2012).
4. Phillips, J. C. et al. Scalable molecular dynamics with NAMD. J. Comput. Chem. 26, 1781–802 (2005).
5. Carpenter, T. S., Lau, E. Y. & Lightstone, F. C. A role for loop F in modulating GABA binding affinity in the GABA(A) receptor. J. Mol. Biol. 422, 310–23 (2012).
6. Keiser, J. & Utzinger, J. The Drugs We Have and the Drugs We Need Against Major Helminth Infections. Adv. Parasitol. 73, 197–230 (2010).
7. Oldham, W. M. & Hamm, H. E. Heterotrimeric G protein activation by G-protein-coupled receptors. Nat. Rev. Mol. Cell Biol. 9, 60–71 (2008).
8. McCudden, C. R., Hains, M. D., Kimple, R. J., Siderovski, D. P. & Willard, F. S. G-protein signaling: Back to the future. Cell. Mol. Life Sci. 62, 551–577 (2005).
9. Ghazi, A., Berrier, C., Ajouz, B. & Besnard, M. Mechanosensitive ion channels and their mode of activation. Biochimie 80, 357–362 (1998).
10. Goodenough, D. A. & Paul, D. L. Gap junctions. Cold Spring Harb. Perspect. Biol. 1, a002576 (2009).
11. Sullivan, H. Ionic Channels of Excitable Membranes, 2nd Ed. Neurology 42, 1439–1439 (1992). 12. Nury, H. et al. X-ray structures of general anaesthetics bound to a pentameric ligand-gated ion
channel. Nature 469, 428–31 (2011).
13. Miyazawa, A., Fujiyoshi, Y., Stowell, M. & Unwin, N. Ê Resolution : Nicotinic Acetylcholine Receptor at 4 . 6 A Transverse Tunnels in the Channel Wall. (1999).
14. Unwin, N. Refined structure of the nicotinic acetylcholine receptor at 4A resolution. J. Mol. Biol. 346, 967–89 (2005).
15. Miyazawa, A., Fujiyoshi, Y., Stowell, M. & Unwin, N. Ê Resolution : Nicotinic Acetylcholine Receptor at 4 . 6 A Transverse Tunnels in the Channel Wall. (1999).
16. Unwin, N. Refined structure of the nicotinic acetylcholine receptor at 4A resolution. J. Mol. Biol. 346, 967–89 (2005).
17. Hibbs, R. E. & Gouaux, E. Principles of activation and permeation in an anion-selective Cys-loop receptor. Nature 474, 54–60 (2011).
18. Corringer, P.-J. et al. Structure and Pharmacology of Pentameric Receptor Channels: From Bacteria to Brain. Structure 20, 941–956 (2012).
19. Sullivan, H. Ionic Channels of Excitable Membranes, 2nd Ed. Neurology 42, 1439–1439 (1992). 20. Brown, A. R. Endogenous neurosteroid actions at GABAA receptors during neuronal
development. (2011).
21. Sieghart, W., Ramerstorfer, J., Sarto-Jackson, I., Varagic, Z. & Ernst, M. A novel GABA(A) receptor pharmacology: drugs interacting with the α(+) β(-) interface. Br. J. Pharmacol. 166, 476–85 (2012).
22. Lejoyeux, M., Solomon, J. & Ades, J. REVIEW BENZODIAZEPINE TREATMENT FOR ALCOHOL-DEPENDENT PATIENTS. 33, 563–575 (1998).
39
23. Unwin, N. The nicotinic acetylcholine receptor of the Torpedo electric ray. J. Struct. Biol. 121, 181–190 (1998).
24. Akabas, M. H. Using molecular dynamics to elucidate the structural basis for function in pLGICs. Proc. Natl. Acad. Sci. U. S. A. 110, 16700–1 (2013).
25. Alberts, B. et al. Molecular Biology of the Cell. Amino Acids 54, 1725 (2008).
26. Sansom, M. S. P. & Biggin, P. C. Molecular Simulations and Biomembranes. From Biophys. to Funct. 314 (2010). doi:10.1039/9781849732154
27. Schlick, T. Molecular Modeling and Simulation. Most 21, 205–231 (2002).
28. Allen, M. P. Introduction to Molecular Dynamics Simulation. Computing 23, 27 (2004). 29. Phillips, J. C. et al. Scalable molecular dynamics with NAMD. J. Comput. Chem. 26, 1781–802
(2005).
30. Details, S., Information, P. & Information, L. Protein-Ligand RMSD. 1–9 (2013).
31. Tim Isgro Marcos Sotomayor, Elizabeth Villa, Hang Yu, David Tanner, Yanxin Liu, J. P. et al. NAMD Tutorial: Unix/MacOSX Version. Univ. Illinois Urbana-Champaign, NIH Resour.
Macromol. Model. Bioinformatics, Beckman Institute, Comput. Biophys. Work. 1–115 (2012). 32. Richardson, M. Principal Component Analysis. 1–23 (2009).
33. Issack, B. B., Berjanskii, M., Wishart, D. S. & Stepanova, M. Exploring the essential collective dynamics of interacting proteins: application to prion protein dimers. Proteins 80, 1847–65 (2012).
34. Jeong, D. H., Ziemkiewicz, C., Ribarsky, W., Chang, R. & Charlotte, U. N. C. Understanding Principal Component Analysis Using a Visual Analytics Tool.
35. Castellanos, M. M. & Colina, C. M. Molecular dynamics simulations of human serum albumin and role of disulfide bonds. J. Phys. Chem. B 117, 11895–905 (2013).
36. Brezovsky, J. et al. Software tools for identification, visualization and analysis of protein tunnels and channels. Biotechnol. Adv. 31, 38–49 (2013).
37. Law, R. J. & Lightstone, F. C. Modeling neuronal nicotinic and GABA receptors: Important interface salt-links and protein dynamics. Biophys. J. 97, 1586–1594 (2009).
38. Tim Isgro Marcos Sotomayor, Elizabeth Villa, Hang Yu, David Tanner, Yanxin Liu, J. P. et al. NAMD Tutorial: Unix/MacOSX Version. Univ. Illinois Urbana-Champaign, NIH Resour.
Macromol. Model. Bioinformatics, Beckman Institute, Comput. Biophys. Work. 1–115 (2012). 39. Brejc, Ï. et al. Crystal structure of an ACh-binding protein reveals the ligand-binding domain of
nicotinic receptors. 411, 269–276 (2001).
40. Khatri, A. & Weiss, D. S. The role of Loop F in the activation of the GABA receptor. J. Physiol. 588, 59–66 (2010).
41. Hayward, S. & de Groot, B. L. Normal modes and essential dynamics. Methods Mol. Biol. 443, 89–106 (2008).