Original papers
DOI: 10.11152/mu.2013.2066.171.yvzAbstract
Aims: To evaluate the feasibility of quantitative analysis of muscle stiffness by Acoustic Radiation Forced Impulse (ARFI)
elastography over a course of graduate isometric voluntary contractions. Material and methods: The stiffness of the bilateral biceps muscle of 13 healthy volunteers was measured in real time by ARFI elastography, while the forearm was in neutral-extended position, 90 degree self-flexed positions and 90 degree self-flexed position, with altered weights ranging from 1 to 8 kg placed on flattened palmar surfaces consecutively. The determined increases in biceps muscle stiffness were measured for both arms and correlated with the loadings weights adopted at progressive trial stages. Results: The mean shear wave velocity (SWV) values of biceps muscles in a neutral position, in 90 degree flex position and 90 degree flex position with 1 to 8 kg weights on palmar surfaces were 2.162±0.302 m/sec, 3.382±0.581 m/sec, and 3.897±0.585 to 5.562±0.587 m/sec, re-spectively. Significant correlations between the muscle SWV values and related palmar weights and between the SWV values of right and left sides at different trial stages were identified (r=0.951 and r=0.954, respectively). A mutual propagation path of deep regions to entire areas was described to account for the distribution of increase in stiffness with increases in palmar weights. The confidence of method regarding inter-observer difference was confirmed by the correlation analyses of the re-sults (r=0.998). Conclusions: ARFI elastography is a feasible imaging modality for quantifying the stiffness of isometrically voluntarily contracting muscles.
Keywords: Acoustic Radiation Force Impulse, elastography, muscle stiffness
Acoustic Radiation Force Impulse (ARFI) elastography quantification
of muscle stiffness over a course of gradual isometric contractions: a
preliminary study.
Alpaslan Yavuz
1, Aydın Bora
1, Mehmet Deniz Bulut
1, Abdussamet Batur
1, Aysel
Milanlioglu
2, Cemil Göya
1, Cagatay Andic
31Department of Radiology, Yuzuncu Yil University, Medical Faculty, Van, 2Department of Neurology. Yuzuncu Yil
University, Medical Faculty, Van, 3Department of Radiology Baskent University Medical Faculty, Adana, Turkey
Received 15.10.2014 Accepted 27.11.2014 Med Ultrason
2015, Vol. 17, No 1, 49-57
Corresponding author: Alpaslan Yavuz, MD,
Yüzüncü Yıl University, School of Medical Science Department of Radiology, 65100, Van, Turkey E-mail: [email protected] Phone No: 0090 532 3424959 Fax No: 0090 432 2168352 Introduction
Ultrasound (US) elastography is a new technology with many potential applications. Increasingly, new ar-eas of usage for this novel imaging modality are being described in the literature. To improve the utility of this method, particularly in the diagnosis of pathological tis-sues, the elasticity values of normal soft tissues [1-6] or comparisons between normal and pathological tissues
have been described by recent reports [7]. Additionally, the characterization and/or differentiation of pathologi-cal tissues by US elastography have increasingly been evaluated by numerous up-to-date studies that aimed to reveal the diagnostic efficacy of US elastography in dif-ferentiating benign or malignant conditions. Although the visceral organs, such as the liver [8], kidney [9], spleen [10], pancreas [11], uterus [12], and prostate [13], were the main subjects in these studies, the utility of US in assessing pathologies of the thyroid glands [14-16] and breast tissue [17-19] have also been evaluated by a substantial number of researchers. In comparison, only a limited number of studies in the literature have reported the validity of using US elastography in clinical practice for patients with musculoskeletal issues. In these studies, the shear wave elastography (SWE) technique was most-ly used to evaluate the normal-physiological parameters of the muscle and tendon components [20-24]. Although
these works provided innovative ideas for future studies, they were mostly experimental in design and no practi-cal implementation of US elastography use in the clinipracti-cal examination of voluntary muscle contraction has been suggested to date.
In our study, we aimed to reveal the feasibility of using shear wave (ARFI) elastography to identify the stiffness of biceps muscle of healthy volunteers during gradually leveled isometric contractions procured by al-tered loadings. Accordingly, we used a methodology that is more clinically applicable than that used in previous studies. As such, our study provides direction for further prospective clinical studies that might point to new uses of SWE in quantitative analyses or the screening of path-ological muscle weaknesses in patients with neurpath-ological and/or muscular diseases.
Materials and methods
Thirteen healthy volunteers (9 male, 4 female; mean age of 32.69±7.69 years old) were included in this pro-spective study. The consent for ethical approval was ob-tained from the local Ethics Committee. Written informed consent was obtained from all participants. The descrip-tive properties of the thirteen attendees, including their age, gender, heights, weights, Body Mass Indexes (BMI) and the side of functional dominancy, were recorded. Shear wave ARFI elastographic examinations, which was used to measure the shear wave velocity (SWV) of bilateral biceps muscles of each participant, were per-formed. The stiffness of the bilateral biceps muscles dur-ing isometric contraction activity against prearranged al-tered loadings were designated separately in real-time on the basis of SVW measurement.
A Siemens ultrasound machine with an ARFI based elastography option of Virtual Touch IQ technology was used (Siemens ACUSON S2000™, Siemens Healthcare, Erlangen, Germany). This machine could provide imag-ing and quantification in one image, as well as a Quality Map for improved interpretations. US elastographic im-ages of the study subjects’ biceps muscles were obtained by a linear probe with 4-9 MHz frequency bandwidth (9L4 Transducer, Siemens Healthcare, Erlangen, Ger-many). The sonographic examinations of the volunteers were performed by a radiologist with at least nine years of experience in soft tissue sonography (A.Y.).
The initial elastographic examination of the biceps muscles was started following a ten minute resting pe-riod for every individual; any potential effect of previous physical activity was aimed at being avoided. Volun-teers were initially seated on a stretcher, facing towards the clinician and with the elbow of the relevant extremity
placed comfortably on the table. The mean SWV value measurements of the biceps muscle for each extremity was performed in ten different circumstances, including the positions where the forearm was in neutral-extended position, in 90 degree flexion position with no palmar weight on and in 90 degree flexion position with con-secutively deployed weights of 1, 2, 3, 4, 5, 6, 7 and 8 kg on the flattened palmar surface, respectively. A de-lay of 5 minutes between each of the trials was set and each trial stage were performed by switching between the two sides (right and left), instead of completing one side before beginning the trial on the other side. In one particular individual who was not capable of lifting the increased weights, the heaviness of the weights was not increased and examination was terminated at that stage (5 kg). The angle between the forearm and arm was set to be 90 degree while performing measurements in flexion position and a triangle-set square with proper sizes was used for this purpose.
The transducer was held over the biceps muscle, par-allel to the long axis of the muscle (fig 1), to obtain a valid SWV quantification [25,26]. To prevent any com-pression effects due to the comcom-pression by the radiolo-gist or the weight of the transducer itself, the transducer was put directly on the skin but held by the radiologist to minimize its’ self-weight. Initially, B-Mode US scanning of the biceps muscle was performed, and a longitudinal line with the same length as the transducer was drawn over the skin, where the biceps muscle could clearly be displayed (over the tip of belly of the muscle). As such, the repeated imaging of the muscle could be achieved from a constant region in the longitudinal cross sectional plane. On B-Mode images, the ROI for generating the color-coded SWV maps were adjusted to frame the bi-ceps muscle so that ROIs fully filled with the muscle tis-sue could be obtained. The color-coded SWV maps in which the velocities of the shear waves in user-defined region of interest (ROI) was displayed by a spectrum of colors embracing the relevant SWV values were than composed. In trials involving palmar loadings, color-code formation was immediately performed within the first 5 seconds following the placement of weights on the palmar surface. A color spectrum was also present on the left side of the screen and indicated the lowest and high-est limits of SWVs that were displayed. The range of 1 to 6.5 m/sec for the SWV values was adjusted accord-ing to standard procedures unless an evident increase in the stiffness at a sampling region necessitated the widen-ing of the range (up to 10 m/sec). Before measurwiden-ing the SWV values from the obtained color-coded SWV maps, the quality of the SVW maps were verified against the “quality maps” that were generated automatically by the
software (according to the definition of the manufacturer, “Quality Map” indicates the quality and reliability of the shear wave measurements. Specifically, areas, where the shear waves are absent, are shown as black rather than being assigned a possibly erroneous color and areas where the shear waves with sufficient quality for quanti-fication are shown in green). The SWV values from eight previously concerted pinpoint ROI areas were acquired from the color-coded SWV map. For quantitative purpos-es and standardization of the sampling pattern for every patient these eight pinpoint areas were placed in color-coded SWV maps according to a previously designed transparent template (that had the same sizes of ROI) was overlaid over the screen. Ensuring the accuracy of quan-tifications and minimizing operator dependent disparities were aimed to be avoided. The SWV quantification steps of the biceps muscle are shown in figure 2. Finally, the mean SWV value of the biceps muscle was calculated for each trial by averaging the eight SWV values from the eight sampling pinpoint areas for each consecutive trial. The right and left upper extremities were tested
separate-ly, and the data from both extremities were used in the calculation of the mean SWV values.
The correlation between muscle stiffness, which was indirectly quantified by measuring the mean SWV value, and palmar loadings was assessed statistically. A scatter/ dot graph with a linear fit-line at total was constructed, and demonstrated the correlation between the SWV val-ues of the right and left biceps brachii muscle of every trial and in all attendees. The comparison regarding the SWV values of biceps brachii muscles in neutral extend-ed position (in rest) was made between the functionally dominant (was right side in 11 and left side in 2 case) and recessive sides. A consideration of the SWV values of biceps brachii muscles in the rest-extension position (stage 1 of the trial) and in the 90° flexion position with an 8 kg weight on the palmar surface (stage 10 of the trial) was made to investigate the significance of the cor-relation between the rest SWV values and the maximal SWV values obtained from the trials. This was to inves-tigate if the resting stiffness of the muscle could be a pre-dictive indicator for estimating the further stiffness levels of the muscle at sub-maximal contractions.
A qualitative analysis of the distribution of the in-crease in muscle stiffness by the progressive levels of trials was made on the basis of the consideration of color-coded SWV maps of each trail. The purpose was to determine the locations within the ROI where the increase in stiffness (due to increase in palmar loading weights) initially began and subsequently spread over the entire ROI. A mutual pattern was aimed at to describe the distribution of the muscle stiffness increase by consecu-tive isometric muscle contractions with an increasing in strength.
Additionally, the inter-observer variability of the technique was interrogated. The SWV quantification of
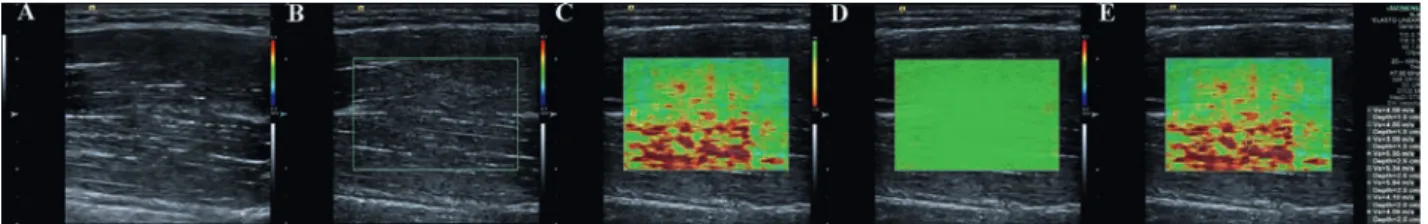
Fig 2. The stages of the quantification of the mean SWV values by ARFI imaging technique are demonstrated. These stages were repeated for each different trial on each side the of biceps muscle in all patients. A) B-Mod US scanning to identify the optimum location with the thickest muscle tissue underneath was performed by positioning the transducer parallel to the longitudinal plane of the muscle; B) The ROI for color-coded SWV map formation was adjusted as fully loaded by muscle tissue when the transducer was over the pre-assigned location over the muscle belly; C) Color-coded SVW maps, in which the velocities of the shear waves in user-defined region of interests (ROI) were displayed by a spectrum of colors depicting the relevant SWV values, were constructed. A color spectrum was also present on the left side of the screen, and indicated the lowest and highest limits of SWVs that were dis-played; D) The quality of the color-coded SVW maps that were acquired were verified against the “quality maps” that were generated automatically by the software. According to the definition of the manufacturer, “Quality Map” indicates the quality and reliability of the shear wave measurements. Specifically, areas where the shear waves are absent are shown as black, rather than being assigned a possibly erroneous color, and areas where the shear waves are of sufficient quality to be quantified are shown as green in color; E) The shear wave velocity values from eight previously concerted pinpoint areas were acquired from the color-coded SWV map.
Fig 1. The transducer was placed in a posi-tion parallel to the muscle’s longitudinal plane, where the muscle tissue could fulfill the ROI area (on the belly of the muscle in all cases), so that the more valid SWV values could be obtained.
the biceps brachii muscles of five volunteers, who were randomly selected from the cohort, were repeated on the 5th-7th days following than the initial examination. All
tri-als were re-performed according to the initial protocol, but by a different radiologist, A.B., who had at least 5 years of experience in musculoskeletal ultrasound imag-ing. The same ARFI elastography US machine was used for the purpose. The inter-observer difference was statis-tically analyzed.
Descriptive statistics for studied variables (character-istics) were presented as means, standard deviations and minimum and maximum values. Student’s t test was used to compare the SWV value means for the studied vari-ables. For the determination linear relationships among the variables, Spearman rank correlation analysis was carried out. Statistical significance levels were set at 5%. The SPSS (ver. 13, SPSS Inc, Chicago, IL) statistical program was used for all statistical computations.
Results
Thirteen healthy volunteers (9 male, 4 female; mean age of 32.69±7.69 years old, range from 25 to 51) were prospectively included in the study. The mean BMI value of the cohort was 24.5±3.96 and no significant differ-ence was present between the genders in terms of weight (p=0.066) and BMI (p=0.442). There was a significant difference in the heights of the groups (p=0.002).
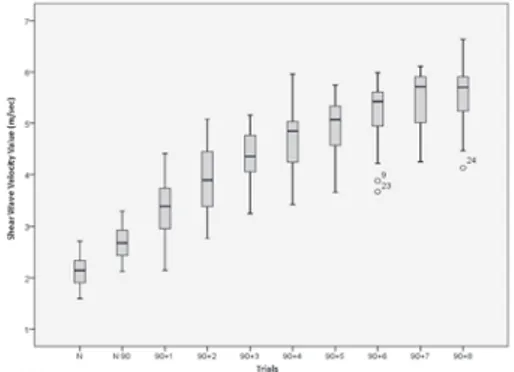
The mean SWV values of the biceps brachii muscle were measured at each trial stage. The data for the neutral extended position, 90° flex position with no loadings and 90° flex position with 1, 2, 3, 4, 5, 6, 7 and 8 kg weights of loading that were placed consecutively on the flattened palmar surfaces were 2.162±0.302 (n=6), 3.382±0.581 (n=26), 3.897±0.585 (n=26), 4.318±0.524 (n=6), 4.704±0.615 (n=26), 4.962±0.573 (n=26), 5.197±0.626 (n=24), 5.47±0.567 (n=24) and 5.562±0.587 (n=24), respectively. A significant positive correlation between the adopted palmar weight and the mean muscle stiff-ness value was detected (with a correlation coefficient of 0.951). The mean values and standard deviations of the SWVs of thirteen volunteers’ biceps brachii muscles ac-cording to each trial stage are shown in figure 3. The data including the mean and standard deviation of SWVs for both right and left upper extremities are comparatively shown in figure 4.
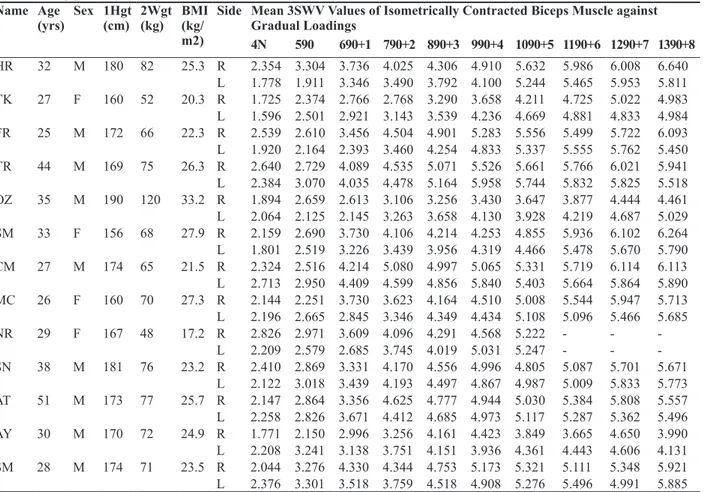
The detailed data on the thirteen volunteers, including ages, genders, heights, weights and BMI values, and the SVW values of the biceps brachii muscles of each side at each trail stage, are shown in Table I.
The mean SVW of the biceps brachii muscle, which was used as an indicator of muscle stiffness, was
2.162±0.302 m/sec (n=26) in the neutral extended posi-tion (in rest) and no statistically significant difference (p=0.272) was obtained in comparison between the func-tionally dominant and recessive extremities regarding the mean biceps brachii muscle stiffness in the neutral extended position, which might be considered as mus-cle tonus in rest. The mean SWV values of the function-ally dominant and opposite sides were 2.228±0.347 m/ sec and 2.095±0.245 m/sec, respectively. The statistical analysis for assessing the correlation between the right and left biceps brachii muscles with respect to changes in their stiffness as a response to the increased palmar loadings showed a significant correlation at the 0.01 level (r=0.953). A scatter/dot graph with a linear fit-line at total (r=0.909) was constructed (fig 5). Additionally, a signifi-cant correlation was observed between the mean SWV values of the biceps brachii muscles in the rest-extension position (1st stage of the trial) and in the 90° flexion
po-sition with an 8 kg weight on the palmar surface (10th
stage of the trial) (r= 0.579; n=12, one individual was not capable of lifting over 5 kg).
The dispersion pattern of the increase in muscle stiff-ness in terms of the regions in muscle tissue was quali-tatively assessed by a subjective comparison between the color-coded SWV (stiffness) maps of each trial. A Fig 3. Mean values and standard deviations of
the SWVs of thirteen volunteers’ biceps brachii muscles.
Fig 4. Mean and standard deviation of SWVs for right and left upper extremities.
common pattern observed among most patients (61.5%, 8/13) was that the enhancement in muscle stiffness as a response to the increased palmar loadings initially
oc-curred at deeper regions (from the skin) of the muscle, and then spread over the remaining superficial areas at advanced stages of the trials when heavier loadings were used (fig 6). Although the described dispersion pattern was mutual in the 14 extremities of eight attendees (the described dispersion pattern was recognized as unilat-eral in two cases), the stage of the trial at which the local hardening of the muscle at deep regions spread to entire ROI varied among patients. Specifically, the dispersion over the whole ROI occurred at the stages of 2 kg on the palmar surface and 3 kg on the palmar surface in 10 (5 right and 5 left) and 4 (1 right and 3 left) extremities, respectively.
To assess the inter-observer variation and the repeat-ability confidence of the technique, the correlation be-tween the results of five randomly selected attendees, Fig 5. Correlation between the SWV values of
the right and left biceps brachii muscle.
Table I. The mean values for shear wave velocities (SWV, expressed in meters per seconds) of the study subjects’ biceps muscles
while resisting gradient loadings.
Name Age
(yrs) Sex 1Hgt(cm) 2Wgt(kg) BMI (kg/ m2)
Side Mean 3SWV Values of Isometrically Contracted Biceps Muscle against Gradual Loadings 4N 590 690+1 790+2 890+3 990+4 1090+5 1190+6 1290+7 1390+8 HR 32 M 180 82 25.3 R 2.354 3.304 3.736 4.025 4.306 4.910 5.632 5.986 6.008 6.640 L 1.778 1.911 3.346 3.490 3.792 4.100 5.244 5.465 5.953 5.811 TK 27 F 160 52 20.3 R 1.725 2.374 2.766 2.768 3.290 3.658 4.211 4.725 5.022 4.983 L 1.596 2.501 2.921 3.143 3.539 4.236 4.669 4.881 4.833 4.984 FR 25 M 172 66 22.3 R 2.539 2.610 3.456 4.504 4.901 5.283 5.556 5.499 5.722 6.093 L 1.920 2.164 2.393 3.460 4.254 4.833 5.337 5.555 5.762 5.450 TR 44 M 169 75 26.3 R 2.640 2.729 4.089 4.535 5.071 5.526 5.661 5.766 6.021 5.941 L 2.384 3.070 4.035 4.478 5.164 5.958 5.744 5.832 5.825 5.518 OZ 35 M 190 120 33.2 R 1.894 2.659 2.613 3.106 3.256 3.430 3.647 3.877 4.444 4.461 L 2.064 2.125 2.145 3.263 3.658 4.130 3.928 4.219 4.687 5.029 SM 33 F 156 68 27.9 R 2.159 2.690 3.730 4.106 4.214 4.253 4.855 5.936 6.102 6.264 L 1.801 2.519 3.226 3.439 3.956 4.319 4.466 5.478 5.670 5.790 CM 27 M 174 65 21.5 R 2.324 2.516 4.214 5.080 4.997 5.065 5.331 5.719 6.114 6.113 L 2.713 2.950 4.409 4.599 4.856 5.840 5.403 5.664 5.864 5.890 MC 26 F 160 70 27.3 R 2.144 2.251 3.730 3.623 4.164 4.510 5.008 5.544 5.947 5.713 L 2.196 2.665 2.845 3.346 4.349 4.434 5.108 5.096 5.466 5.685 NR 29 F 167 48 17.2 R 2.826 2.971 3.609 4.096 4.291 4.568 5.222 - - -L 2.209 2.579 2.685 3.745 4.019 5.031 5.247 - - -SN 38 M 181 76 23.2 R 2.410 2.869 3.331 4.170 4.556 4.996 4.805 5.087 5.701 5.671 L 2.122 3.018 3.439 4.193 4.497 4.867 4.987 5.009 5.833 5.773 AT 51 M 173 77 25.7 R 2.147 2.864 3.356 4.625 4.777 4.944 5.030 5.384 5.808 5.557 L 2.258 2.826 3.671 4.412 4.685 4.973 5.117 5.287 5.362 5.496 AY 30 M 170 72 24.9 R 1.771 2.150 2.996 3.256 4.161 4.423 3.849 3.665 4.650 3.990 L 2.208 3.241 3.138 3.751 4.151 3.936 4.361 4.443 4.606 4.131 SM 28 M 174 71 23.5 R 2.044 3.276 4.330 4.344 4.753 5.173 5.321 5.111 5.348 5.921 L 2.376 3.301 3.518 3.759 4.518 4.908 5.276 5.496 4.991 5.885
1Hgt: Height of the volunteers, 2Wgt: Weight of the volunteers, 3SWV: Shear wave velocities, 4N: Arm in neutral position, 5 90:
Fore-arm in 90 degree flexion, 690+1: Forearm in 90 degree flexion and with a weight of 1 kg placed on flattened palmar surface, 790+2:
Forearm in 90 degree flexion and with a weight of 2 kg placed on flattened palmar surface, 890+3: Forearm in 90 degree flexion and
with a weight of 3 kg placed on flattened palmar surface, 9 90+4: Forearm in 90 degree flexion and with a weight of 4 kg placed on
flattened palmar surface, 1090+5: Forearm in 90 degree flexion and with a weight of 5 kg placed on flattened palmar surface, 1190+6:
Forearm in 90 degree flexion and with a weight of 6 kg placed on flattened palmar surface, 1290+7: Forearm in 90 degree flexion and
with a weight of 7 kg placed on flattened palmar surface, 1390+8: Left forearm in 90 degree flexion and with a weight of 8 kg placed
which were obtained by two different operators within a time period of five to seven days, was assessed and a significant correlation (at the 0.01 level) confirmed the reliability of the technique (r=0.996).
Discussions
Improving the understanding of the structural mecha-nisms of muscle contraction was the most significant scientific query of the last half of the 20th century and
has been the subject of considerable research. When referring to the skeletal muscle system, the term “con-traction” indicates the tension generated by the muscle fibers as a reaction to the activity of motor neurons and the mechanism by which this occurs has been further elaborated since the initial development of the “sliding filament” theory that was made by Huxley et al. in 1954 [27]. Briefly, the muscle is composed of a large number of muscle fiber units, called “actin” and “myosin”, and contraction begins with sophisticated order of biochemi-cal events triggered by the relevant motor neuronal ac-tivity in the central nervous system. This results in the continuous sliding of the unique-thinner muscle filament (actin) over the unique thicker muscle filament (myosin) due to consecutive binding in the weak and strong states. This activity results in the pulling of muscle Z-bands to-wards each other. Thus, the Z lines come closer and the sarcomere, the basic unit of skeletal muscle, becomes shorter. A similar action in all the sarcomeres results in the shortening of the entire myofibril and, thus, of the whole fibers and muscle. Because of the meshing of the
muscle filaments within each other during contraction, the viscosity, density and therefore, the tonicity of the sarcoplasm increases. This accounts for the increase in muscle stiffness observed when the muscle is contract-ing.
Presently, only a limited number of studies have made quantitative assessments of the increase in muscle stiff-ness as a result of skeletal muscle contraction. In most, the findings were not applicable beyond contributing to the knowledge of physiology, but suggested potential utility in medical science [28]. With recent significant developments in medical technology, an increasing num-ber of prospective studies based on ultrasound elastog-raphy machines have been reported. Although the utility of this technique in the quantitative analysis of muscle stiffness has been studied by various groups, determin-ing suitable applications of these methods, particularly in routine medical practice, will take time. In this regard, studies aimed at figuring out new areas of usage for US elastography, partially shear-wave elastography, as an assessment method for muscle tissue in relevant clin-icopathological aspects, have been recently published [20,25,26,28-31].
Different ultrasound elastography techniques for evaluating the muscle stiffness have been described, in-cluding strain elastography, acoustic radiation force im-pulse (ARFI) imaging and SWE [22]. Only a small num-ber of studies based on the elastographic assessment of muscle stiffness and indicating the potential application of the method are present in the literature [30,32]. These initial studies were experimental in design and were performed in laboratory conditions using un-ergonomic machines. In these studies, US elastographic considera-tions of the changes in muscle stiffness following dif-ferent circumstances, such as eccentric exercise [30] or passive stretching [32], were analyzed. These investiga-tions were commonly focused on a single-static condi-tion, rather than analyzing dynamic and versatile aspects. Fortunately, an increasing number of studies studying the capability of real-time ultrasound elastography in the quantification of muscle stiffness during varied contrac-tion strengths have been introduced in the past decade. Gennisson et al used a low-frequency pulse that was sent repetitively at five-second intervals by an innova-tive shear elasticity probe that was applied to the surface of the bicep, over the biceps brachii muscle [25]. Trans-verse shear modulus (TSM) were calculated at maximal voluntary contraction during an elbow flexion effort, and additional calculations for TSM were performed every five seconds over the two minutes period of the ramp trial, in which elbow flexion varied from 0% to 50% and volunteers’ maximal biceps brachii myoelectric activity Fig 6. A mutual pattern regarding the enhancement in
mus-cle stiffness as a response to the increased palmar loadings observed among most patients (61.5%, 8/13): the increase in muscle tissue stiffness was initially occurred at deeper regions of the muscle (pictures at first column) and was spread over the remaining superficial areas at advanced stages of the trials when heavier loadings were used (pictures at second column).
was measured. Specifically, volunteers were asked to pull a fixed-stable dynamometer, which was placed around their wrists, with progressive power. The surface elec-tromyographic signals (sEMG) were also recorded dur-ing all trials. A systematic linear relationship between the TSM and the corresponding sEMG value was revealed, indicating the parallelism between the electrical and me-chanical activities within the muscle during contractions. Additionally, lower muscle hardness indexes were found to be associated with higher rest TSM values, indicating that the change in transverse shear modulus during con-traction depends on its level at rest. These findings were suggested to be applicable in the medical field, especially for exploring deep muscles that are unreachable by clas-sical testing methods. This study was one of the few that had a similar design to our study, in terms of the adopted trial stages of gradual isometric muscle contractions. However, in contrast, we used a more practical and com-pact US machine with an ARFI based elastography ex-amination mode to measure the SWV values as an indica-tor of muscle stiffness of the biceps muscle. Additionally, palmar loadings of varied weights were used, instead of a bulky fixed-stable dynamometer. Although we did not measure the sEMG activity of the biceps brachii, a signif-icant correlation was also observed between the quanti-fied stiffness values of the muscle and the corresponding amount of the weights of palmar loadings. A correlation between higher values of muscle stiffness when resisting to maximal amount of weight (8 kg) was also determined in most volunteers with higher muscle stiffness values in the neutral-rest position. This is in agreement with the study of Gennisson et al, which deduced that the rest-ing stiffness of the muscle can be a predictive indicator for estimating the further stiffness levels of the muscle at sub-maximal contracting aspects. An in vitro study us-ing a porcine brachialis whole-muscle tissue specimen model was performed by Eby et al to investigate the vali-dation of SWE throughout the functional range of motion of skeletal muscle for three ultrasound transducer orien-tations [20]. This study confirmed that the orientation of the ultrasound probe affected the results when assessing the SWE shear modulus throughout the normal range of tension of appendicular skeletal muscle, possibly because the shear waves propagate much more readily along fib-ers, rather than across them [20,25]. Our studies’ method section was designed according to this data, such that the ARFI elastography imaging was performed with a linear transducer that was positioned parallel to the muscle fib-ers, rather than crossing. This was aimed at achieving a more accurate quantification of SWV values.
Yoshitake et al were investigated the repeatability of measuring muscle shear modulus using ultrasound
shear-wave elastography between trails and between days [26]. This study brought a different point of view by question-ing if this technique is within the bounds of possibility to be efficient in practical usage in clinical medicine. In this study, a similar technique, including the placement of an ultrasound probe over the muscle belly of the short head of the biceps brachii and the measurement of the muscle shear modulus at rest and during different con-traction levels, was applied. Subsequently, the associa-tion between the shear modulus and contracassocia-tion intensity over a wide range of intensities were investigated. A lin-ear correlation between the shlin-ear modulus and the elbow flexion torques across varied contraction intensities was established. The relationship between the muscle shear modulus and contraction intensity was examined by av-eraging the corresponding muscle shear modulus values at each contraction level across trials and days. A linear correlation between the muscle shear modulus and the muscle contraction levels was determined (p<0.05), and the technique was accepted as having high repeatability between trials and between days. There was no signifi-cant association between the shear modulus of the rest-ing muscle and the shear modulus durrest-ing contraction, and only muscle strength was found to be helpful as an indicator for estimating the rate of increase in stiffness during contraction. In our study, the linear correlation between the muscle shear modulus and the muscle con-traction levels was confirmed by a more practical model of study design, including the use of a high-tech, com-pact US machine that could measure the shear wave ve-locity of the muscle based on ARFI elastography tech-nique. Furthermore, free hand transducer positioning was performed, rather than the constant attachment of the transducer to the arm, and finally, simple palmar load-ings with assigned weights were used, instead of a fixed dynamometer. A significant positive correlation between the adopted palmar weight and the mean muscle stiffness values was revealed. Additionally, the resting muscle SWV values and, hence, stiffness, were found to be valid predictors for estimating the muscle SWV values while contracting in different trial stages with variable load-ings. The applicability of these findings to muscles other than the biceps brachii or to individuals with diseases af-fecting muscular tonus requires further study.
The inter-observer difference of the technique used in our study was surveyed and the confidence of the repeat-ability of the method was confirmed by the significant correlation between the quantifications that were pro-vided by 2 observers with a time interval of 5 to 7 days.
Shinohara et al investigated feasibility of US shear wave imaging in the real time evaluation of muscle stiff-ness distribution during contraction [28]. The
color-cod-ed imaging of the distribution of Young’s modulus within and between multiple muscles was performed preliminar-ily with a stand-alone ultrasound device with a handheld transducer that was capable of inducing and detecting propagating shear waves within the tissues in real-time. The observed distributions of Young’s modulus were consistent with the literature and supported the feasibility of the new ultrasound technology. In our study, a similar search, but with a more compact US machine that was capable of demonstrating the color-coded visualization of muscle stiffness distribution, was used. Additionally, the calculation of mean SWV values by averaging the ob-tained SWV values from preferred pin point regions over the color-coded maps could be performed and the range of the color spectrum regarding the peak and lowest limit for SWV values could also be decided by the clinician. For the SWV values, a standard range from 1 to 6.5 m/sec was used, unless an evident increase in the stiffness ne-cessitated widening the range (up to 10 m/sec). While the hardened regions were mostly coded in red, soft regions were coded in bluish green, thus enabling the visualiza-tion of the distribuvisualiza-tion of different stiffness levels with respect to their location within the biceps brachii muscle fibers at each trial of the study. In our study, regarding the locations for the initial hardening of muscle tissue at first stage of the trials, a mutual distribution pattern among most patients (61.5%, 8/13) was also described. Specifically, the enhancement in muscle stiffness as a re-sponse to the increased palmar loadings initially occurred at deeper regions of the muscle, and subsequently spread over the remaining superficial areas at later stages of the trials, when heavier loadings were in use. Further stud-ies with extended serstud-ies are necessary to confirm these findings.
There were several limitations of our study. Firstly, the number of attendees included in this preliminary study was limited and further studies with extended co-horts are necessary to confirm our findings and improve the technique. Secondly, to enable the application of the technique for more practical use, rather than just being experimental, the usage of previous quantification meth-ods described by previous studies, including the usage of a fixed dynamometer for creating resistance to the mus-cle components or the persistent attachment of the trans-ducers to the arm during the study trial’s period, were avoided. Thus, it is possible that the quantifications made in our study were less precise than those in previous stud-ies.
In our study, when the findings were considered to provide insights for future studies, it is foreseeable to ex-pect potential novel applications for SWE, particularly in the assessment of musculoskeletal disorders, or even in
the utilization by different scientific fields, such as sport medicine (for evaluating the performance of elite ath-letes), physiology, veterinary medicine and agriculture. The physiological charts demonstrating the relationship between muscle stiffness and resisting loadings or/and the graphs demonstrating the normative correlation be-tween right and left side regarding the stiffness (SWV values) for different muscle groups with bilateralism (as we demonstrated for the biceps muscle) among different populations or races can be generated. Muscle hardening percentile charts can be formed to assess mild forms of muscle disorders that are unilateral in origin and uniden-tifiable by physical or other laboratory examinations. Ad-ditionally, with this method, the screening of the progress and/or the therapy responses of muscle tonus disorders and the evaluation of the efficacy of specific treatment methods, such as Botulinum toxin injection therapies (BOTOX), or in pathologies involving increased muscle tonicity, such as torticollis, can strongly be recommended in the light of this studies’ conclusion.
Conclusions
The ARFI based elastographic quantification of SWV values of the biceps muscle tissue as an indicator of mus-cle stiffness is a feasible and simple method that can be used to determine the changes in muscle stiffness at iso-metric voluntary contractions of differing strength levels. The ARFI based elastography machines with improved transducer technology, such as the one used in this study, can enable the clinician to quantify the patient’s muscle stiffness in-real time and with gradual contracting as-pects and to compose synchronously color-coded maps expressing the heterograde levels of hardenings with re-spect to locations. Finally, further studies assessing the use of SWE for muscle-related clinical examinations are necessary.
Conflict of interest: none. References:
1. Arda K, Ciledag N, Aktas E, Aribas BK, Kose K. Quantita-tive assessment of normal soft-tissue elasticity using shear-wave ultrasound elastography. AJR Am J Roentgenol 2011; 197: 532-536.
2. Arda K, Ciledag N, Aribas BK, Aktas E, Kose K. Quantita-tive assessment of the elasticity values of liver with shear wave ultrasonographic elastography. Indian J Med Res 2013; 137: 911-915.
3. Berko NS, Fitzgerald EF, Amaral TD, Payares M, Levin TL. Ultrasound elastography in children: establishing the
normal range of muscle elasticity. Pediatr Radiol 2014; 44: 158-163.
4. Badea AF, Tamas Szora A, Ciuleanu E, et al. ARFI quan-titative elastography of the submandibular glands. Normal measurements and the diagnosis value of the method in ra-diation submaxillitis. Med Ultrason 2013; 15: 173-179. 5. D’Onofrio M, Gallotti A, Mucelli RP. Tissue quantification
with acoustic radiation force impulse imaging: Measure-ment repeatability and normal values in the healthy liver. AJR Am J Roentgenol 2010; 195: 132-136.
6. Chang S, Kim MJ, Kim J, Lee MJ. Variability of shear wave velocity using different frequencies in acoustic ra-diation force impulse (ARFI) elastography: a phantom and normal liver study. Ultraschall Med 2013; 34: 260-265. 7. Drakonaki EE, Allen GM. Magnetic resonance imaging,
ul-trasound and real-time ulul-trasound elastography of the thigh muscles in congenital muscle dystrophy. Skeletal Radiol 2010; 39: 391-396.
8. Davies G, Koenen M. Acoustic radiation force impulse elastography in distinguishing hepatic haemangiomata from metastases: preliminary observations. Br J Radiol 2011; 84: 939-943.
9. Goya C, Daggulli M, Hamidi C, et al. The role of quan-titative measurement by acoustic radiation force impulse imaging in differentiating benign renal lesions from malig-nant renal tumours. Radiol Med 2014 Aug 6. doi: 10.1007/ s11547-014-0443-7.
10. Chin JL, Chan G, Ryan JD, Aiden McCormick P. Spleen stiffness can non-invasively assess resolution of portal hy-pertension after liver transplantation. Liver Int 2014 Jul 29. doi: 10.1111/liv.12647.
11. Yashima Y, Sasahira N, Isayama H, et al. Acoustic radiation force impulse elastography for noninvasive assessment of chronic pancreatitis. J Gastroenterol 2012; 47: 427-432. 12. Furukawa S, Soeda S, Watanabe T, Nishiyama H, Fujimori
K. The measurement of stiffness of uterine smooth muscle tumor by elastography. Springerplus 2014; 3: 294.
13. Zheng X, Ji P, Mao H, Hu J. A comparison of virtual touch tissue quantification and digital rectal examination for dis-crimination between prostate cancer and benign prostatic hyperplasia. Radiol Oncol 2012; 46: 69-74.
14. Yoon JH, Yoo J, Kim EK, et al. Real-time elastography in the evaluation of diffuse thyroid disease: a study based on elastography histogram parameters. Ultrasound Med Biol 2014; 40: 2012-2019.
15. Calvete AC, Mestre JD, Gonzalez JM, Martinez ES, Sala BT, Zambudio AR. Acoustic radiation force impulse imag-ing for evaluation of the thyroid gland. J Ultrasound Med 2014; 33: 1031-1040.
16. Liu BX, Xie XY, Liang JY, et al. Shear wave elastography versus real-time elastography on evaluation thyroid nod-ules: a preliminary study. Eur J Radiol 2014; 83: 1135-1143. 17. Zippel D, Shalmon A, Rundstein A, et al. Freehand elastog-raphy for determination of breast cancer size: comparison
with B-mode sonography and histopathologic measure-ment. J Ultrasound Med 2014; 33 : 1441-1446.
18. Lee SH, Chang JM, Kim WH, et al. Added Value of Shear-Wave Elastography for Evaluation of Breast Masses De-tected with Screening US Imaging. Radiology 2014; 273: 61-69.
19. Klotz T, Boussion V, Kwiatkowski F, et al. Shear wave elas-tography contribution in ultrasound diagnosis management of breast lesions. Diagn Interv Imaging 2014; 95: 813-824. 20. Eby SF, Song P, Chen S, Chen Q, Greenleaf JF, An KN.
Validation of shear wave elastography in skeletal muscle. J Biomech 2013; 46: 2381-2387.
21. Drakonaki EE, Allen GM, Wilson DJ. Ultrasound elastog-raphy for musculoskeletal applications. Br J Radiol 2012; 85: 1435-1445.
22. Brandenburg JE, Eby SF, Song P, et al. Ultrasound elastog-raphy: the new frontier in direct measurement of muscle stiffness. Arch Phys Med Rehabil 2014; 95: 2207-2219. 23. Botar Jid C, Vasilescu D, Damian L, Dumitriu D, Ciurea
A, Dudea SM. Musculoskeletal sonoelastography. Pictorial essay. Med Ultrason 2012; 14: 239-245.
24. Lalitha P, Reddy MCh, Reddy KJ. Musculoskeletal applica-tions of elastography: a pictorial essay of our initial experi-ence. Korean J Radiol 2011; 12: 365-375.
25. Gennisson JL, Cornu C, Catheline S, Fink M, Portero P. Human muscle hardness assessment during incremental isometric contraction using transient elastography. J Bio-mech 2005; 38: 1543-1550.
26. Yoshitake Y, Takai Y, Kanehisa H, Shinohara M. Muscle shear modulus measured with ultrasound shear-wave elas-tography across a wide range of contraction intensity. Mus-cle Nerve 2014; 50: 103-113.
27. Huxley AF, Niedergerke R. Structural changes in muscle during contraction; interference microscopy of living mus-cle fibres. Nature 1954; 173: 971-973.
28. Shinohara M, Sabra K, Gennisson JL, Fink M, Tanter M. Real-time visualization of muscle stiffness distribution with ultrasound shear wave imaging during muscle contrac-tion. Muscle Nerve 2010; 42: 438-441.
29. Chino K, Akagi R, Dohi M, Fukashiro S, Takahashi H. Reli-ability and validity of quantifying absolute muscle hardness using ultrasound elastography. PloS One 2012; 7: e45764. 30. Green MA, Sinkus R, Gandevia SC, Herbert RD, Bilston
LE. Measuring changes in muscle stiffness after eccentric exercise using elastography. NMR Biomed 2012; 25: 852-858.
31. Akagi R, Chino K, Dohi M, Takahashi H. Relationships between muscle size and hardness of the medial gastroc-nemius at different ankle joint angles in young men. Acta Radiol 2012; 53: 307-311.
32. Koo TK, Guo JY, Cohen JH, Parker KJ. Quantifying the passive stretching response of human tibialis anterior mus-cle using shear wave elastography. Clinical Biomech (Bris-tol, Avon) 2014; 29: 33-39.