Address for correspondence: Dr. Didem Oğuz, Başkent Üniversitesi İstanbul Hastanesi, Kardiyoloji Bölümü, İstanbul-Türkiye
Phone: +90 216 554 15 00-1615 Fax: +90 216 651 98 58 E-mail: [email protected], [email protected] Accepted Date: 10.02.2016 Available Online Date: 28.03.2016
©Copyright 2016 by Turkish Society of Cardiology - Available online at www.anatoljcardiol.com DOI:10.14744/AnatolJCardiol.2016.6706
Didem Oğuz, Hakan Ümit Ünal
1, Hacer Eroğlu*, Öykü Gülmez, Halime Çevik**, Armağan Altun
Department of Cardiology, *Biochemistry, **Radiology, Başkent University İstanbul Hospital; İstanbul-Turkey
1Department of Gastroenterology, Şişli Florence Nightingale Hospital; İstanbul-Turkey
Aortic flow propagation velocity, epicardial fat thickness, and
osteoprotegerin level to predict subclinical atherosclerosis in patients
with nonalcoholic fatty liver disease
Introduction
Nonalcoholic fatty liver disease (NAFLD) is the most common cause of liver dysfunction in Western countries. Additionally, it is an independent risk factor for atherosclerotic heart disease (1). Several noninvasive markers for atherosclerotic heart disease have recently been discovered, including epicardial fat thick-ness (EFT), aortic flow propagation velocity (APV), and osteopro-tegerin (OPG) level (2–4).
Aortic distensibility and aortic strain are elasticity indices that reflect aortic stiffness. Impaired aortic distensibility has been related to increased cardiovascular mortality in different populations (5, 6). APV, which is also used to evaluate aortic stiff-ness, might be an indicator of the presence of atherosclerotic
heart disease. Another echocardiographic marker for athero-sclerotic heart disease is EFT. Human epicardial adipose tissue is described as a potential paracrine and/or endocrine tissue, specifically within the context of cardiovascular risk (7–9). OPG, a cytokine also known as osteoclastogenesis inhibitory factor, has been found to have a higher plasma concentration in pa-tients with than without atherosclerotic heart disease (10–13). Several authors have concluded that OPG appears to be a prom-ising biomarker of atherosclerosis that is independently associ-ated with traditional risk factors of subclinical and clinical ath-erosclerotic disease (14–16).
The aim of this study was to evaluate OPG, APV, and EFT for atherosclerotic heart disease in patients with NAFLD, which is an independent risk factor for atherosclerotic heart disease.
Objective: Nonalcoholic fatty liver disease is the most common cause of liver dysfunction in Western countries and an independent risk factor for atherosclerotic heart disease. Appropriate noninvasive parameters are lacking for optimal risk stratification of cardiovascular disease in these patients. We evaluated several recently discovered noninvasive parameters for atherosclerosis in patients with nonalcoholic fatty liver disease: epicardial fat thickness, aortic flow propagation velocity, and osteoprotegerin level.
Methods: Forty-one patients (27 men and 14 women; mean age, 37.9±8.9 years) with nonalcoholic fatty liver disease and 37 control subjects (17 men and 20 women; mean age, 34.5±8.6 years) were enrolled in this observational case-control study. Patients with nonalcoholic fatty liver dis-ease diagnosed at a gastroenterology outpatient clinic were included. Patients with cardiac pathology other than hypertension were excluded. Epicardial fat thickness and aortic flow propagation velocity were measured by echocardiography. The serum concentration of osteoprotegerin was measured using a commercial enzyme-linked immunosorbent assay kit.
Results: Nonalcoholic fatty liver disease patients exhibited a significantly lower aortic flow propagation velocity (155.17±30.00 vs. 179.00±18.14 cm/s, p=0.000) and significantly higher epicardial fat thickness (0.51±0.25 vs. 0.29±0.09 cm, p=0.000) than control subjects. Osteoprotegerin levels were higher, but not significant, in patients with nonalcoholic fatty liver disease (28.0±13.0 vs. 25.2±10.8 pg/mL, p=0.244). Binary logistic regression analysis showed that aortic flow propagation velocity (OR, –0.973; 95% CI, 0.947–0.999) and waist circumference (OR, –1.191; 95% CI, 1.088–1.303) were independent predictors of nonalcoholic fatty liver disease.
Conclusion: In this study, epicardial fat thickness and osteoprotegerin level were higher and aortic flow propagation velocity was lower in pa-tients with nonalcoholic fatty liver disease. Early detection of abnormal epicardial fat thickness and aortic flow propagation velocity may warrant a search for undetected cardiovascular disease in patients with nonalcoholic fatty liver disease. (Anatol J Cardiol 2016; 16: 974-9)
Keywords: nonalcoholic fatty liver disease, subclinical atherosclerosis, osteoprotegerin, epicardial fat thickness, aortic flow propagation velocity
A
BSTRACTMethods
Study population
In total, 41 patients with NAFLD (27 men and 14 women; mean age, 37.9±8.9 years) and 37 control subjects (17 men and 20 women; mean age, 34.5±8.6 years) were enrolled in this observational case-control study. The patients had been consecutively observed at our gastroenterology outpatient clinic over the past 12 months. Liver ul-trasound (US) examinations were performed to assess the degree of steatosis. All US scans were performed by the same operator, who was blinded to the patients’ clinical status. The exclusion cri-teria were coronary artery disease; a positive treadmill exercise test result; diabetes mellitus; a body mass index (BMI) of >35 kg/ m2; bundle branch block; paced rhythm; atrial fibrillation; Q waves;
left ventricular hypertrophy or strain on the electrocardiogram at rest; significant valvular heart disease; congenital heart disease; aortic aneurysm; systemic diseases that affect the aorta; severe obstructive pulmonary disease; chronic renal disease; treatment with estrogen, amiodarone, steroids, tamoxifen, diltiazem, or herb-als; history of abdominal surgery; history or suspicion of viral hepa-titis; and a daily alcohol intake exceeding 20 g/day. All participants included in the control group were judged to have normal results on liver function tests and were confirmed to have a normal liver by US scanning. All participants provided informed written consent. The study protocol conformed with the Declaration of Helsinki.
Anthromorphometry, blood pressure measurement, and laboratory testing
All participants underwent physical examination, anthro-pometric measurements, and biochemical screening. BMI was defined as weight (in kilograms) divided by the square of the height (in meters). Waist circumference (in centimeters) was recorded as the average of two measurements at the midpoint between the lowest rib and the iliac crest while the participant was standing. Blood pressure was measured using a mercury sphygmomanometer in a quiet room after at least 10 min of rest. The average of three measurements was used. Blood samples were obtained after 12 h of fasting. The levels of low-density li-poprotein cholesterol (LDL), high-density lili-poprotein cholesterol (HDL), triglyceride, total cholesterol, glucose, creatinine, hemo-globin, aspartate aminotransferase, and alanine aminotransfer-ase were measured by routine laboratory techniques.
The serum concentration of OPG was measured using a com-mercial enzyme-linked immunosorbent assay (ELISA) kit (model number: BMS2021 INST) (eBioscience, Vienna, Austria). Serum samples were collected and subsequently stored at –80°C un-til OPG analysis. The investigator who analyzed the OPG serum concentrations was blinded to all clinical information. Both the monomeric and dimeric forms of OPG and OPG bound to RANKL were detected in this assay. A monoclonal IgG antibody was used as the capture antibody, and a biotin-conjugated polyclonal antihuman OPG antibody was used as the detection antibody. The detection limit of this assay system was 2.5 pg/mL; the
intra-assay and inter-intra-assay coefficients of variation were typically 7% and 8%, respectively, at low and high concentrations of OPG.
Transthoracic echocardiographic examination
Echocardiographic examination was performed at rest in the left lateral decubitus position. Measurements were ob-tained using an Acuson Sequoia 512 system (Siemens, Munich, Germany) with a 4-MHz transducer according to the American Society of Echocardiography measurement guidelines. Echocar-diographic evaluation was performed by the same experienced cardiologist who had no clinical information about the patients. The epicardial fat was defined as the echo-free space between the outer wall of the myocardium and the visceral layer of the pericardium. EFT was measured perpendicularly on the free wall of the right ventricle at end- diastole for three cardiac cycles. The aortic annulus was used as the anatomical landmark with which to standardize the measurement point. The average mea-surement of three cardiac cycles was used for the statistical analysis. Color M-mode Doppler recordings were obtained from the suprasternal window in the supine position. The cursor was located parallel to the main fl ow direction in the descending aorta. The Nyquist limit was adapted to 30–50 cm/s, switching to the mode with the recorder sweep rate of 200 mm/s. The M-mode spatiotemporal velocity map in the shape of a flame was displayed. If the slope of the flame was unclear, baseline shifting was used to change the aliasing velocity until a clear delinea-tion of the velocity slope was obtained. APV was then calculated by dividing the distance between the points corresponding to the beginning and end of the propagation slope by the duration between the corresponding time points. Thus, APV corresponds to the velocity at which the flow is propagating down the artery. The mean of at least three measurements was recorded as APV.
Exercise electrocardiography
A symptom-limited treadmill exercise electrocardiographic test was performed with the modified Bruce protocol to distin-guish lower risk of CVD patients more precisely. The test result was defined as positive if the horizontal or down-sloping ST-segment depression measured ≥1 mm at 80 ms after the J point in two or more contiguous leads, and typical angina increased in severity with exercise.
Statistical analysis
Statistical analyses were performed using the Statistical Package for the Social Sciences (SPSS) software, version 18 (SPSS Inc., Chicago, Illinois, USA). Statistical significance was defined as p<0.05. Results are given as mean±standard error (SE) and median [interquartile range (IQR)]. Variable distribu-tions were assessed with the Kolmogorov–Smirnov normality test. Statistical comparison between groups was assessed by student’s t-test, the Mann–Whitney U test, or the Pearson chi-square test. Correlation analyses were performed using Spear-man or Pearson’s coefficients to assess relationships of
mea-sures. Binary logistic regression analysis was used to determine the independent predictors of NAFLD.
Results
Forty-one patients with NAFLD (mean age, 37.9±8.9 years) and 37 controls (mean age, 34.5±8.6 years) participated in this study. The mean values for the main clinical and laboratory characteristics in the NAFLD and control groups are reported in Table 1. The age, sex distribution, diastolic blood pressure, heart rate, history of hypertension, medications, family history of coronary artery disease, and smoking ratio were similar be-tween the NAFLD and control groups. Patients with NAFLD had significantly higher BMI, waist circumference, lipid profile, sys-tolic blood pressure, fasting blood glucose, hemoglobin, and creatinine values than the controls (Table 1). The median value of EFT was 0.40 cm (0.36–0.55 cm) in patients with NAFLD and 0.29 cm (0.23–0.33 cm) in controls, with a statistically significant difference (p<0.001) (Table 2). APV was 155.17±30.00 cm/s in pa-tients with NAFLD and 179.40±18.14 cm/s in controls, with a sta-tistically significant difference (p<0.001) (Table 2). The OPG level
was higher in the NAFLD group than in the control group, but was statistically insignificant [25.1 pg/mL (21.06–28.6 pg/mL) and 22.26 pg/mL (19.71–25.04 pg/mL) respectively; p=0.244] (Table 2).
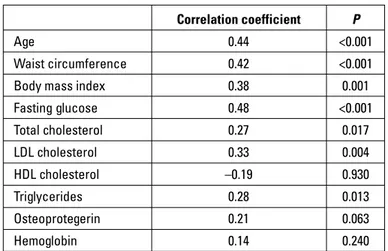
Among all patients, EFT was correlated with age (r=0.44, p<0.001), waist circumference (r=0.42, p<0.001), BMI (r=0.38, p=0.001), fasting blood glucose (r=0.48, p<0.001), total cholesterol (r=0.27, p=0.017), LDL (r=0.33, p=0.004), and triglycerides (r=0.28, p=0.013) (Table 3). However, there was no correlation among EFT, OPG, and HDL.
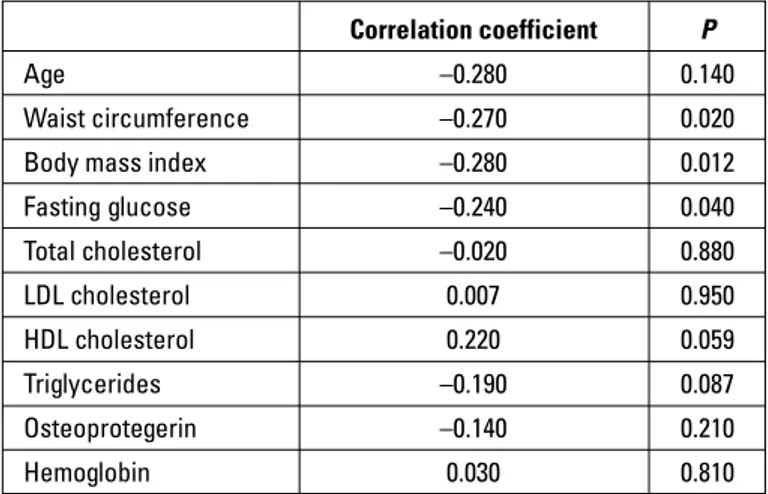
APV was correlated with waist circumference (r=–0.27, p=0.02), BMI (r=–0.28, p=0.012), and fasting blood glucose (r=– 0.24, p=0.04) (Table 4).
We found a statistically significant correlation between EPF and APV (r=–0.313, p=0.006). Binary logistic regression analysis showed that APV (OR, –0.973; 95% CI, 0.947–0.999) and waist cir-cumference (OR, –1.191; 95% CI, 1.088–1.303) were independent predictors of NAFLD.
Discussion
This study mainly evaluated the relationship between APV, EFT, and OPG levels as atherosclerotic parameters and NAFLD. We demonstrated increased EFT and OPG levels and decreased
Table 1. Clinical and biochemical characteristics of patients with nonalcoholic fatty liver disease and controls
Controls Patients with NAFLD P
(n=37) (n=41) Gender, male/female, n 17/20 27/14 NS Age, years 34.5±8.6 37.9±8.9 NS BMI, kg/m2 24.20±3.26 29.50±3.97 <0.001 SBP, mm Hg 118.0±13.8 129.3±14.8 0.001 DBP, mm Hg 75.0±11.5 79.6±12.5 NS
Heart rate, beats/min 78.9±13.9 76.6±13.4 NS Pulse pressure, mm Hg 43.0±10.6 49.2±12.3 0.020 Waist circumference, cm 89.5±9.7 106.0±11.9 <0.001
Smoking 13 15 NS
HT 3 9 NS
Anti-HT treatment 3 7 NS
Family history of CAD 7 5 NS
Hemoglobin, g/dL 13.77±1.40 15.0±1.20 <0.001 Creatinine, mg/dL 0.77±0.12 0.86±0.14 0.002 FBG, mg/dL 91.2±7.0 98.6±9.9 <0.001 LDL, mg/dL 118.0±33.0 140.7±40.3 0.009 HDL, mg/dL 49.0±9.9 39.7±8.9 <0.001 Total cholesterol, mg/dL 183.5±36.1 212.3±42.8 0.002 Triglycerides, mg/dL 87(75–101) 158(126–198) <0.001
BMI - body mass index; CAD - coronary artery disease; DBP - diastolic blood pres-sure; FBG - fasting blood glucose; HDL - high-density lipoprotein cholesterol; HT - hypertension; LDL - low-density lipoprotein cholesterol; NAFLD - nonalcoholic fatty liver disease; NS - nonsignificant; SBP - systolic blood pressure. Student’s t-test or the Mann–Whitney U test was used for comparison of groups. Categorical variables were compared using the Pearson chi-square test
Table 2. Comparison of epicardial fat thickness, aortic flow propagation velocity, and osteoprotegerin level between nonalcoholic fatty liver disease and control groups
Controls Patients with NAFLD P
(n=37) (n=41)
EFT, cm 0.29 (0.23–0.33) 0.40 (0.36–0.55) <0.001 APV, cm/s 179.40±18.14 155.17±30.00 <0.001 OPG, pg/mL 22.26 (19.71–25.04) 25.1 (21.06–28.6) 0.244
APV - aortic flow propagation velocity; EFT - epicardial fat thickness; NAFLD - nonal-coholic fatty liver disease; OPG - osteoprotegerin. Binary logistic regression analysis was performed to assess the correlations between the studied parameters
Table 3. Correlation of epicardial fat thickness with clinical variables
Correlation coefficient P
Age 0.44 <0.001
Waist circumference 0.42 <0.001
Body mass index 0.38 0.001
Fasting glucose 0.48 <0.001 Total cholesterol 0.27 0.017 LDL cholesterol 0.33 0.004 HDL cholesterol –0.19 0.930 Triglycerides 0.28 0.013 Osteoprotegerin 0.21 0.063 Hemoglobin 0.14 0.240
Correlation analyses were performed using Spearman or Pearson’s coefficients according to the distribution of the variables. HDL - high-density lipoprotein; LDL - low-density lipoprotein
APV levels in patients with NAFLD. Moreover, we showed that APV was correlated with waist circumference, BMI, and fasting glucose; EFT was correlated with APV.
NAFLD is a chronic liver disease that comprises a wide spec-trum of hepatic damage ranging from simple steatosis and ste-atohepatitis to advanced fibrosis and cirrhosis (17). Although the true prevalence of NAFLD is unknown, the estimated prevalence in the general population ranges from 3% to 24% (18). In the ent study, patients with NAFLD had a higher systolic blood pres-sure, waist circumference, fasting blood glucose, and triglycer-ide level and a lower HDL level. According to previous studies, NAFLD appears to be strongly associated with risk factors for atherosclerosis, such as hypertension, obesity, diabetes, high tri-glycerides, low HDL, insulin resistance, and metabolic syndrome; NAFLD also appears to increase with age (18). Patients with NAFLD have an increased risk of cardiovascular disease (CVD) (19–21), reportedly independent of underlying cardiovascular risk factors (22). Efe et al. (23) found that the prevalence of coronary artery disease in patients with NAFLD was significantly higher than that in patients with normal liver tissue. The association between NAFLD and the risk of CVD has been attributed to in-creased oxidative stress and subclinical inflammation. Fat depo-sition in patients with NAFLD is considered to increase the levels of free fatty acids that lead to CVD by causing inflammation (24, 25). Indeed, it is hypothesized that NAFLD is not only a risk marker of CVD but may also be involved in its pathogenesis (26). Genetic predisposition, reduced levels of adiponectin, and coagulation imbalance are the other physio-pathogenic mechanisms of CVD in NAFLD patients (27). Endothelial dysfunction is the first stage in the development of atherosclerosis and CVD. Atherosclerosis leads to increased arterial resistance through thickening and stiffening of the arterial wall. A loss of arterial elastic properties results in pathophysiological changes in circulation, including in-creased pulse pressure and vessel endothelial dysfunction (28). Increased arterial resistance may be reflected by a decrease in
APV. Güneş et al. (29) recently showed that the M-mode-derived propagation velocity of the descending thoracic aorta (AVP), which is an easy, practical, noninvasive measurement of arte-rial resistance, was associated with coronary atherosclerosis. In the present study, AVP was lower in patients with NAFLD than in controls. Additionally, APV was correlated with waist circumfer-ence, BMI, and fasting glucose. Increased aortic stiffness has been shown to be more closely related to visceral obesity, as assessed by waist circumference, than to an increased BMI (30). However, further studies are required to determine whether the measurement of AVP may be used to improve cardiovascular risk estimation in patients with NAFLD. EFT is clinically related to car-diac and visceral adiposity, and it has been suggested as a new cardiometabolic risk factor (31). The epicardial fat tissue is in di-rect contact with the myocardium and major coronary arteries and their branches and is metabolically active (32, 33). Epicardial adipocytes can secrete a large number of cytokines and vasoac-tive peptides, all of which can independently increase cardiovas-cular risk (34). Echocardiographic assessment of EFT is simple, rapid, safe, and easily reproducible and may have a potential to be a simple and reliable marker of increased cardiovascular risk. In the study of Eroğlu et al. (35), EFT was found to be a marker of the presence and severity of coronary artery disease. Iacobel-lis et al. (36) found that EFT better predicts ultrasound-measured fatty liver than BMI or waist circumference in obese patients. In our study, we exclude morbid obese patients (BMI >35 kg/m2).
Another study showed that a higher EFT is associated with the severity of liver fibrosis. They also found some alterations of car-diac functions and morphology linked to liver fibrosis (37). How-ever, in the study of Psychari et al. (38), EFT was not found to be significantly correlated with NAFLD. In contrast to these studies, in our study, we did not include high cardiovascular risk patients and showed that EFT is correlated with age, fasting glucose, total cholesterol, LDL, triglycerides, waist circumference, and BMI, in accordance with some previous findings (39, 40).
Moreover, our data showed that EFT was significantly higher in the NAFDL than in the control group. Furthermore, EFT was correlated with APV, which is a previously described marker of increased arterial resistance. In the study of Sünbül et al. (41), patients with NAFLD have increased arterial resistance. In ad-dition, they found that the severity of liver fibrosis and EFT are independent predictors of measurements of arterial resistance.
Numerous randomized controlled studies have found that OPG, a soluble decoy receptor of osteoclast activator, acts as a regulatory molecule in patients with vascular calcification. In the Women on the Move through Activity and Nutrition (WOMAN) study (42), a higher OPG was associated with a higher coronary artery calcium score, whereas the Framingham Study reported a nonsignificant relationship between OPG and coronary cal-cification (12). The serum OPG level is associated with arterial stiffness, as measured by pulse wave velocity (43). Moreover, a high serum OPG level was reported to be an independent pre-dictor of cardiovascular events in patients undergoing
hemodi-Table 4. Correlation of aortic flow propagation velocity with clinical variables
Correlation coefficient P
Age –0.280 0.140
Waist circumference –0.270 0.020
Body mass index –0.280 0.012
Fasting glucose –0.240 0.040 Total cholesterol –0.020 0.880 LDL cholesterol 0.007 0.950 HDL cholesterol 0.220 0.059 Triglycerides –0.190 0.087 Osteoprotegerin –0.140 0.210 Hemoglobin 0.030 0.810
Correlation analyses were performed using Spearman or Pearson’s coefficients according to the distribution of the variables. HDL - high-density lipoprotein; LDL - low-density lipoprotein
alysis (43). In addition, a 17-year prospective follow-up study of patients with type II diabetes showed a strong predictive value of the OPG level for all-cause and cardiovascular mortality (44). However, the present study showed that the OPG level was not significantly increased in patients with NAFLD. Moreover, there was no association between the OPG level and APV. This dis-crepancy may be due to the small sample size of this study as well as the patients’ characteristics, which included younger ages and a more stable clinical status with a lower risk profile of CVD than in previous studies.
Study limitations
Our study has several limitations. First, because the sam-ple size was relatively small, only a few patients in the NAFLD group had upper-limit alanine aminotransferase levels, and the degree of steatosis was not assessed. Second, NAFLD was not confirmed by liver biopsy, and for medical and ethical reasons, we excluded alcoholic liver disease and autoimmune hepatitis based on answers to a simple questionnaire.
Conclusions
In this study, we demonstrated APV is independently associ-ated with NAFLD, even those classified as being at low risk for cardiovascular events according to traditional risk scores. In ad-dition, the present study showed that EFT was higher in patients with than without NAFLD. Early detection of abnormal EFT and APV levels may warrant a search for undetected CVD in patients with NAFLD.
Conflict of interest: None declared. Peer-review: Externally peer-reviewed.
Authorship contributions: Concept – D.O., Ö.G., H.Ü.Ü.; Design – D.O., H.Ç., Ö.G.; Supervision – D.O., A.A.; Fundings – Başkent Üniversitesi; Ma-terials – D.O., H.Ü.Ü., H.Ç., H.E.; Data collection &/or processing – D.O., H.E.; Analysis &/or interpretation – D.O., H.E., H.Ç.; Literature search – D.O., A.A.; Writing – D.O., Ö.G., H.Ü.Ü., A.A.; Critical review – D.O., A.A.
References
1. Sookoian S, Pirola CJ. Non-alcoholic fatty liver disease is strongly associated with carotid atherosclerosis: a systematic review. J Hepatol 2008; 49: 600-7. Crossref
2. Hirai T, Sasayama S, Kawasaki T, Yagi S. Stiffness of systemic arter-ies in patients with myocardial infarction. A noninvasive method to predict severity of coronary atherosclerosis. Circulation 1989; 80: 78-86. Crossref
3. Gatzka CD, Cameron JD, Kingwell BA, Dart AM. Relation between coronary artery disease, aortic stiffness, and left ventricular struc-ture in a population sample. Hypertension 1998; 32: 575-8. Crossref
4. Blacher J, Pannier B, Guerin AP, Marchais SJ, Safar ME, London GM. Carotid arterial stiffness as a predictor of cardiovascular and all-cause mortality in end-stage renal disease. Hypertension 1998;
32: 570-4. Crossref
5. Laurent S, Boutouyrie P, Asmar R, Gautier I, Laloux B, Guize L, et al. Aortic stiffness is an independent predictor of all-cause and car-diovascular mortality in hypertensive patients. Hypertension 2001; 37: 1236-41. Crossref
6. Stefanadis C, Dernellis J, Tsiamis E, Stratos C, Diamantopoulos L, Michaelides A, et al. Aortic stiffness as a risk factor for recurrent acute coronary events in patients with ischaemic heart disease. Eur Heart J 2000; 21: 390-6. Crossref
7. Mazurek T, Zhang L, Zalewski A, Mannion JD, Diehl JT, Arafat H, et al. Human epicardial adipose tissue is a source of inflammatory mediators. Circulation 2003; 108: 2460-6. Crossref
8. Sacks HS, Fain JN. Human epicardial fat: what is new and what is missing? Clin Exp Pharmacol Physiol 2011; 38: 879-87. Crossref
9. Bos D, Shahzad R, van Walsum T, van Vliet LJ, Franco OH, Hofman A, et al. Epicardial fat volume is related to atherosclerotic calci-fication in multiple vessel beds. Eur Heart J Cardiovasc Imaging 2015; 16: 1264-9. Crossref
10. Aksu F, Özçelik F, Kunduracılar H, Barutçu A, Yel M, Ümit EG, et al. The relation between the levels of osteoprotegerin and the degree of coronary artery disease in patients with acute coronary syn-drome and stable angina pectoris. Kardiol Pol 2014; 72: 34-41. 11. Breland UM, Hollan I, Saatvedt K, Almdahl SM, Damas JK,
Yndes-tad A, et al. Inflammatory markers in patients with coronary artery disease with and without inflammatory rheumatic disease. Rheu-matology 2010; 49: 1118-27. Crossref
12. Lieb W, Gona P, Larson MG, Massaro JM, Lipinska I, Keaney JF Jr, et al. Biomarkers of the osteoprotegerin pathway: clinical cor-relates, subclinical disease, incident cardiovascular disease and mortality. Arterioscler Thromb Vasc Biol 2010; 30: 1849-54. Crossref
13. Abedin M, Omland T, Ueland T, Khera A, Aukrust P, Murphy SA, et al. Relation of osteoprotegerin to coronary calcium and aortic plaque (from the Dallas Heart Study). Am J Cardiol 2007; 99: 513-8. 14. Altun A, Uğur-Altun B, Tatlı E. Decreased serum osteoprotegerin
levels in patients with cardiac syndrome X. J Endocrinol Invest 2004; 27: 839-43. Crossref
15. Uğur-Altun B, Altun A, Gerenli M, Tuğrul A. The relationship be-tween insulin resistance assessed by HOMA-IR and serum osteo-protegerin levels in obesity. Diabetes Res Clin Pract 2005; 68: 217-22. 16. Mogelvang R, Pedersen SH, Flyvbjerg A, Bjerre M, Iversen AZ, Galatius S, et al. Comparison of osteoprotegerin to traditional ath-erosclerotic risk factors and high-sensitivity C-reactive protein for diagnosis of atherosclerosis. Am J Cardiol 2012; 109: 515-20. 17. Clark JM. Weight loss as a treatment for nonalcoholic fatty liver
disease. J Clin Gastroenterol 2006;40 Suppl 1: S39-43.
18. Clark JM. The epidemiology of nonalcoholic fatty liver disease in adults. J Clin Gastroenterol 2006; 40 Suppl 1:S5-10.
19. Targher G, Day CP, Bonora E. Risk of cardiovascular disease in pa-tients with nonalcoholic fatty liver disease. N Engl J Med 2010; 363: 1341-50. Crossref
20. Targher G, Marra F, Marchesini G. Increased risk of cardiovascular disease in non-alcoholic fatty liver disease: causal effect or epi-phenomenon? Diabetologia 2008; 51: 1947-53. Crossref
21. VanWagner LB, Ning H, Lewis CE, Shay CM, Wilkins J, Carr JJ, et al. Associations between nonalcoholic fatty liver disease and sub-clinical atherosclerosis in middle-aged adults: the Coronary Artery Risk Development in Young Adults Study. Atherosclerosis 2014; 235: 599-605. Crossref
22. Targher G, Arcaro G. Non-alcoholic fatty liver disease and in-creased risk of cardiovascular disease. Atherosclerosis 2007; 191:
235-40. Crossref
23. Efe D, Aygün F. Assessment of the relationship between non-al-coholic fatty liver disease and CAD using MSCT. Arq Bras Cardiol 2014; 102: 10-8.
24. Perseghin G. The role of non-alcoholic fatty liver disease in cardio-vascular disease. Dig Dis 2010; 28: 210-3. Crossref
25. Targher G, Bertolini L, Scala L, Zoppini G, Zenari L, Falezza G. Non-alcoholic hepatic steatosis and its relation to increased plasma biomarkers of inflammation and endothelial dysfunction in non-diabetic men. Role of visceral adipose tissue. Diabet Med 2005; 22: 1354-8. Crossref
26. Oni ET, Agatston AS, Blaha MJ, Fialkow J, Cury R, Sposito A, et al. A systematic review: burden and severity of subclinical cardiovas-cular disease among those with nonalcoholic fatty liver; should we care? Atherosclerosis 2013; 230: 258-67. Crossref
27. Bhatia LS, Curzen NP, Calder PC, Byrne CD. Non-alcoholic fatty liver disease: a new and important cardiovascular risk factor? Eur Heart J 2012; 33: 1190-1200. Crossref
28. Fargion S, Porzio M, Fracanzani AL. Nonalcoholic fatty liver dis-ease and vascular disdis-ease:state-of-the-art. World J Gastroenterol 2014; 20: 13306-24. Crossref
29. Güneş Y, Tuncer M, Güntekin U, Ceylan Y, Şimşek H, Şahin M, et al. The relation between the color M-mode propagation velocity of the descending aorta and coronary and carotid atherosclerosis and flow-mediated dilatation. Echocardiography 2010;27:300-5. Crossref
30. Rosito GA, Massaro JM, Hoffmann U, Ruberg FL, Mahabadi AA, Va-san RS, et al. Pericardial fat, visceral abdominal fat, cardiovascular disease risk factors, and vascular calcification in a community-based sample. The Framingham Heart Study. Circulation 2008; 117: 605-13. Crossref
31. Natale F, Tedesco MA, Mocerino R, de Simone V, Di Marco GM, Aronne L, et al. Visceral adiposity and arterial stiffness: echocar-diographic epicardial fat thickness reflects, better than waist cir-cumference, carotid arterial stiffness in a large population of hy-pertensives. Eur J Echocardiogr 2009; 10: 549-55. Crossref
32. Talman AH, Psaltis PJ, Cameron JD, Meredith IT, Seneviratne SK, Wong DT. Epicardial adipose tissue: far more than a fat depot. Car-diovasc Diagn Ther 2014; 4: 416-29.
33. Fitzgibbons TP, Czech MP. Epicardial and perivascular adipose tis-sue and their influence on cardiovascular disease: basic mecha-nisms and clinical associations. J Am Heart Assoc 2014; 3: e000582.
34. Iacobellis G, Barbaro G. The double role of epicardial adipose tis-sue as pro- and anti-inflammatory organ. Horm Metab Res 2008; 40: 442-5. Crossref
35. Eroğlu S, Sade LE, Yıldırır A, Bal U, Özbiçer S, Özgül AS, et al. Epi-cardial adipose tissue thickness by echocardiography is a marker for the presence and severity of coronary artery disease. Nutr Metab Cardiovasc Dis 2009; 19: 211-7. Crossref
36. Iacobellis G, Barbarini G, Letizia C, Barbaro G. Epicardial fat thick-ness and nonalcoholic fatty liver disease in obese subjects. Obe-sity 2014; 22: 332-6. Crossref
37. Petta S, Argano C, Colomba D, Camma C, Di Marco V, Cabibi D, et al. Epicardial fat, cardiac geometry and cardiac function in patients with nonalcoholic fatty liver disease: association with severity of liver disease. J Hepatol 2015; 62: 928-33. Crossref
38. Psychari SN, Rekleiti N, Papaioannou N, Varhalama E, Drakoulis C, Apostolou TS, et al. Epicardial fat in nonalcoholic fatty liver dis-ease: properties and relationships with metabolic factors, cardiac structure, and cardiac function. Angiology 2016; 67: 41-8. Crossref
39. Şengül C, Çevik C, Özveren O, Oduncu V, Sünbül A, Akgün T, et al. Echocardiographic epicardial fat thickness is associated with ca-rotid intima-media thickness in patients with metabolic syndrome. Echocardiography 2011; 28: 853-8. Crossref
40. Kim SJ, Kim HS, Jung JW, Kim NS, Noh CI, Hong YM. Correla-tion between epicardial fat thickness by echocardiography and other parameters in obese adolescents. Korean Circ J 2012; 42: 471-8. Crossref
41. Sünbül M, Ağırbaşlı M, Durmuş E, Kıvrak T, Akın H, Aydın Y, et al. Arterial stiffness in patients with non-alcoholic fatty liver disease is related to fibrosis stage and epicardial adipose tissue thickness. Atherosclerosis 2014; 237: 490-3. Crossref
42. Kuller LH, Pettee Gabriel KK, Kinzel LS, Underwood DA, Conroy MB, Chang Y, et al. The Women on the Move Through Activity and Nutri-tion (WOMAN) study: final 48-month results. Obesity 2012; 20: 636-43. Crossref
43. Lee JE, Kim HJ, Moon SJ, Nam JS, Kim JK, Kim SK, et al. Serum osteoprotegerin is associated with vascular stiffness and the onset of new cardiovascular events in hemodialysis patients. Korean J Intern Med 2013; 28: 668-77. Crossref
44. Reinhard H, Lajer M, Gall MA, Tarnow L, Parving HH, Rasmussen LM, et al. Osteoprotegerin and mortality in type 2 diabetic patients. Diabetes Care 2010; 33: 2561-6. Crossref