Is prophylactic formalin exposure a stress source for gilthead sea
bream (Sparus aurata) and sea bass (Dicentrarchus labrax)?
Hijran YAVUZCAN YILDIZ 1*, Mehmet Borga ERGONUL2
1 Ankara University, Faculty of Agriculture, Department of Fisheries and Aquaculture, 06110 Ankara, Turkey; 2Ankara University,
Faculty of Science, Department of Biology, Tandoğan, Ankara, Turkey.
Summary: Stress in gilthead sea bream (Sparus aurata) and sea bass (Dicentrarchus labrax) externally exposed to formalin was evaluated by measuring stress indicators; plasma cortisol, glucose, calcium (Ca), phophorus (P), sodium (Na), potassium (K), chloride (Cl), magnesium (Mg), hematocrit, and innate immunity parameters; C-reactive protein (CRP), ceruloplasmin. Fish were separately exposed to formalin at a concentration of 150 ppm for 60 min. The parameters were analyzed for sea bream and sea bass exposed to antimicrobial agents soon after treatment and fish exposed to antimicrobial agents after 24 h and 48 h (recovery) following the treatments. Plasma cortisol levels increased after exposure in both sea bream and sea bass however, plasma cortisol recovered in sea bass within 48 h. Plasma glucose values in exposed sea bream and sea bass were 2-fold and 3-fold higher than controls, respectively. Plasma glucose values remained high in 48 h recovery. Plasma electrolytes after exposure and during recovery showed fluctuated results, with different time profile and fish species. While plasma P, Mg and Cl were not affected by formalin exposure in sea bream, plasma Na and Cl remained unchanged in sea bass exposed to formalin. Hematocrit values in sea bream and sea bass did not change after formalin exposure. Innate immunity parameters measured in this study; C-reactive protein (CRP) and ceruloplasmin changed after formalin exposure. CRP levels in sea bream decreased after exposure and did not return to control values in recovery period. However, CRP levels in sea bass increased soon after exposure and decreased to control levels within 48 h recovery. Ceruloplasmin values decreased after formalin exposure both in sea bream and sea bass and did not return to control values within 48 h recovery. The results demonstrated that formalin exposure represents potentially stressful event for sea bream and sea bass when considered the elevated plasma cortisol, glucose, disrupted hydromineral balance, altered CRP and ceruloplasmin.
Key words: Formalin exposure, gilthead sea bream, sea bass, stress indicators
Profilaktik amaçla formaline maruz bırakma çipura (Sparus aurata) ve levrek (Dicentrarchus labrax) için stres kaynağı mıdır?
Özet: Çalışmada, çipura (Sparus aurata) ve levrek (Dicentrarchus labrax) balıklarını profilaktik amaçla formaline banyo şeklinde maruz bırakmanın ardından meydana gelen stres araştırılmıştır. Stres indikatörlerinden; plazma kortisol, glukoz, kalsiyum (Ca), fosfor (P), sodyum (Na), potasyum (K), klorür (Cl), magnezyum (Mg), hematokrit ile non spesifik immunite parametrelerinden; C-reactive protein (CRP) ve seruloplazmin ölçümleriyle stres olgusu değerlendirilmiştir. Balıklar, ayrı ayrı olmak üzere 150 ppm formalin konsantrasyonuna 60 dakika süreyle maruz bırakılmışlardır. Belirtilen parametrelerin analizi için, balıklar formalin uygulamasından hemen sonra; ve uygulamanın ardından taze deniz suyunda 24 ile 48 saat bekletme (iyileşme periyodu) sonrasında örneklenmiştir. Plazma kortisol seviyesi hem çipura hem levrek balıklarında formaline maruz kalma sonrası artmıştır ancak, levrek balıklarında plazma kortisol seviyesi 48 saat içinde azalmıştır. Çipura ve levrek balıklarında plazma glukoz değerleri, kontrole göre, sırasıyla 2 ve 3 kat daha yüksek bulunmuştur. Plazma glukoz değerleri her iki balıkta da 48 saat süresince yüksek kalmıştır. Plazma elektrolit değerleri, formalin uygulamasının ardından ve iyileşme periyodu boyunca, farklı zaman profili ile balık türüne bağlı olarak dalgalanmalar göstermiştir. Çipurada plazma P, Mg and Cl değerleri formalin uygulamasından etkilenmez iken, levrekte plazma Na ve Cl değerleri formalin uygulamasını takiben değişim göstermemiştir. Hematokrit değerleri her iki balık türünde de formalin uygulamasının ardından değişim göstermemiştir. Non spesifik bağışıklık parametrelerinden C-reaktif protein (CRP) ve seruloplazmin formalin uygulamasından etkilenmiştir. CRP seviyesi, çipurada uygulamadan sonra düşmüş ve 48 saat iyileşme periyodu boyunca yükselmemiştir. Levrekte ise formalin uygulamasından sonra artmış ve 48 saat içinde kontrol değerlerine dönmüştür. Seruloplazmin seviyesi her iki balık türünde de formaline maruz kalmadan sonra azalmış ve 48 saatlik iyileşme peryodunda normal değerlere dönmemiştir. Sonuçlar, formalin uygulamasının hem çipura hem levrek için potansiyel olarak stres yaratan bir uygulama olduğunu göstermiştir.
Introduction
Research into the effects of aquaculture procedures on stress physiology is necessary to understand the physiological response and relate the consequences to fish welfare. In fishes, stressors disturb homeostatic equilibria and catecholamines and corticosteroid hormones are released by means of activation of neuroendocrine system. These, in turn, cause the mobilization of carbohydrate and lipid reserves, and stimulate the production of energy reserves via gluconeo genesis, all of which may have an adaptive value to
stressed fish (14) Changes in plasma cortisol have been
used to monitor stress response although altered plasma cortisol levels may not necessarily be indicative of exposure to a stressor. Plasma glucose and plasma electrolytes are the most commonly measured indicator of the secondary phase stress response in fish and may provide indirect measures of altered cortisol. As well as that appropriate immune system function is a sensitive indicator of the health of an organism can be used in aquaculture to monitor fish health. When functioning optimally, specific and non-specific humoral and cellular components become activated and are regular accordingly (20). The immune system can be perturbed as a result of exposure to a range of endogenous and exogenous factors. Measurement of C-reactive protein (8) and ceruloplasmin (23) which are non specific immunity parameters can be used as bioindicator of the health condition of the fish. Hence, health is a fundamental of fish welfare (2).
Anti-ectoparasitic chemicals such as formalin are widely used in aquaculture. However, externally applied antimicrobial agents received little attention with respect to their effects on stress physiology. The present study, therefore, was aimed at investigating the exposure of sea bream (Sparus aurata) and sea bass (Dicentrarchus labrax) to formalin, as reflected in stress and health indicators; plasma cortisol, plasma glucose, plasma Ca, P, Na, K, Cl, Mg, hematocrit, C-reactive protein (CRP) and ceruloplasmin.
Materials and Methods
Experimental fish: One hundred and twenty clinically healthy sea bream (Sparus aurata) with a mean body weight of 213±21.69 g and 120 sea bass (Dicentrarchus labrax) with a mean body weight of 141.22±9.13 g were used in the experiments. The study was carried out in a commercial marine aquaculture farm (Kılıç Deniz AŞ) at Salih Island (Bodrum), Turkey. Fiberglass tanks containing 400 L sea water were used for the experiments. Experiments were performed at a water temperature of 18±3 °C and pH was 7.5. The dissolved oxygen level increased to 18 ppm with additional oxygen supply as formalin is a reducing agent
which absorbs oxygen from water (19). Feeding was stopped one day prior to the experiment.
Experimental design: In the formalin exposure and return trials, fish were exposed to i) 150 ppm formalin for 60 min (N=20); ii) 150 ppm formalin for 60 min followed by 24 h recovery in fresh sea water (N=20); and iii) 150 ppm formalin for 60 min followed by 48 h recovery in fresh sea water (N=20). Control fish (Total N=60) were sampled at the same intervals and were handled in the same way with treatment groups. Each fish were sampled. Experiments were done in dublicate: each trial containing 10 fish corresponds 20 fish for each group. Fish were not anesthetised before blood sampling. The antimicrobial agent, its concentration and duration were specified considering the real conditions of cage cultured sea bream and sea bass.
Blood, plasma and serum collection: Blood of each fish was collected from the caudal vein through with heparinized 5 ml syringes (17). Plasma was seperated
after centrifugation at 12000 rpm and stored at -18 oC
until analyzed.
Analytical procedures: Hematocrits were immediately measured by drawing well-mixed samples of blood into heparinized capillary tubes and centrifuged at 12.500 rpm for 4 min according to Siwicki and Anderson (17). Plasma cortisol was determined using ELISA with commercial kit (DRG Diagnostics, Germany). Plasma glucose, calcium (Ca), sodium (Na), potassium (K), chloride (Cl), inorganic phosphore (P) and C-reactive protein determined by using commercial kits; Olympus ISE (Ireland) and plasma magnesium (Mg) with the kit; Randox (UK) following the the instructions of the manufacturer. Ceruloplasmin levels were measured according to the p-phenylendiamine (PPD) oxidase activity (12, 17).
Statistical analysis: Statistical analysis were performed according to Steel et al. (18). The parametric test for ANOVA was used to compare the groups and the DUNCAN Post-Test of multiple comparisons was applied considering p < 0.05. Each value was expressed as mean ± standard deviation (SD).
Results
Mean values of stress indicators in sea bream (S. aurata) and sea bass (D. labrax) after exposure to formalin; formalin exposure followed by 24 h in fresh sea water and formalin exposure followed by 48 h in fresh sea water (recovery) are presented in Table 1 and 2, respectively.
Following to formalin exposure plasma cortisol values of sea bream increased significantly (p<0.05). Plasma cortisol decreased during recovery periods however, never return to control levels. Plasma glucose values increased after exposure to formalin (p<0.05) and
Table 1. Stress indicators in sea bream (S. aurata) after exposure to formalin.
F: formalin exposure; F-R 24: formalin exposure followed by 24 h in fresh sea water (return); F-R 48: formalin exposure followed by 48 h in fresh sea water (return); C: control; C-R 24: control sampled after 24 h (control of F-R 24); C-R 48: control sampled after 48 h (control of F-R 48). Data from 20 fish in each group expressed as mean ± SD.
Tablo 1. Çipurada (S. aurata) formalin uygulaması sonrası stres indikatörlerinin değişimi.
F: formaline maruz bırakma; F-R 24: formalin uygulaması ve ardından 24 saat deniz suyunda tutma (iyileşme); F-R 48: formalin uygulaması ve ardından 48 saat deniz suyunda tutma (iyileşme); C: kontrol ; C-R 24: 24 saat kontrolü (F-R 24 grubunun kontrolü); C-R 48: 48 saat kontrolü (F-R 48 grubunun kontrolü). Veriler, herbir grup için 20 balıktan elde edilen verilerin ortalaması ± SD olarak sunulmuştur.
Stress indicator Control (C) C-R 24 C-R 48 Formalin exposure (F) F- R 24 F- R 48 Plasma Cortisol (ng/mL) 4.72±0.57a* 5.39±0.09a 4.61±0.24a 87.29±0.01d 33.24±0.28c 18.64±0.65b Plasma Glucose (mg/dL) 83.86±7.74a 78.80±2.64a 72.82±2.74a 163.60±9.18c 112.46±16.65b 102.62±4.29b Plasma Ca (mg/dL) 11.82±0.35a 11.12±0.37a 11.35±0.55a 12.86±0.50b 12.13±0.39b 12.89±0.53b Plasma P (mg/dL) 8.57±0.67c 8.20±0.88c 7.91±0.22b 8.72±0.70c 7.88±0.51b 6.61±0.64a Plasma Na (mmol/L) 186.4±3.57a 188.4±2.41ab 186.8±2.86a 194.0±3.53b 186.6±3.36a 205.4±4.28c Plasma Mg (mg/dL) 3.15±0.26a 3.10±0.24a 3.17±0.15a 3.48±0.26a 3.20±0.13a 3.16±.0.24a Plasma K (mmol/L) 2.75±0.15b 2.95±0.18bc 2.83±0.27bc 3.07±0.18bc 2.15±0.15a 2.99±0.19bc Plasma Cl (mmol/L) 158.6±4.22a 162.2±4.66a 160.4±1.67a 161.2±1.64a 164.8±3.11ab 179.4±8.38b Hematocrit (%) 29.23±3.95a 30.79±4.28a 31.86±3.08a 33.97±1.28a 30.97±3.78a 29.20±5.05a CRP (µg/mL) 67.0±0.8b 66.0±0.11b 68.0±0.13b 54.0±0.9a 48.0±0.8a 50.0±0.7a Ceruloplazmin (mg/L) 5.94±0.13b 5.89±0.99b 5.81±0.11b 3.93±0.08a 4.08±0.06a 4.16±0.09a * Different superscripts in a row refer significant differences (p<0.05)
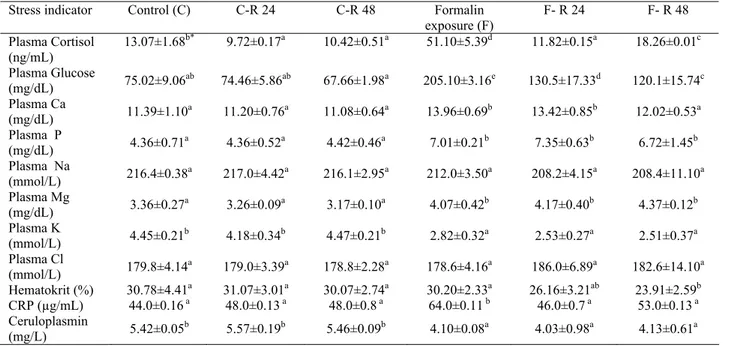
Table 2. Stress indicators in sea bass (D. labrax) after exposure to formalin.
F: formalin exposure; F-R 24: formalin exposure followed by 24 h in fresh sea water (return); F-R 48: formalin exposure followed by 48 h in fresh sea water (return); C: control; C-R 24: control sampled after 24 h (control of F-R 24); C-R 48: control sampled after 48 h (control of F-R 48). Data from 20 fish in each expressed as mean ± SD.
Tablo 2. Levrekte (D. labrax) formalin uygulaması sonrası stres indikatörlerinin değişimi.
F: formaline maruz bırakma; F-R 24: formalin uygulaması ve ardından 24 saat deniz suyunda tutma (iyileşme); F-R 48: formalin uygulaması ve ardından 48 saat deniz suyunda tutma (iyileşme); C: kontrol ; C-R 24: 24 saat kontrolü (F-R 24 grubunun kontrolü); C-R 48: 48 saat kontrolü (F-R 48 grubunun kontrolü). Veriler, herbir grup için 20 balıktan elde edilen verilerin ortalaması ± SD olarak sunulmuştur.
Stress indicator Control (C) C-R 24 C-R 48 Formalin
exposure (F) F- R 24 F- R 48 Plasma Cortisol (ng/mL) 13.07±1.68 b* 9.72±0.17a 10.42±0.51a 51.10±5.39d 11.82±0.15a 18.26±0.01c Plasma Glucose (mg/dL) 75.02±9.06ab 74.46±5.86ab 67.66±1.98a 205.10±3.16e 130.5±17.33d 120.1±15.74c Plasma Ca (mg/dL) 11.39±1.10a 11.20±0.76a 11.08±0.64a 13.96±0.69b 13.42±0.85b 12.02±0.53a Plasma P (mg/dL) 4.36±0.71a 4.36±0.52a 4.42±0.46a 7.01±0.21b 7.35±0.63b 6.72±1.45b Plasma Na (mmol/L) 216.4±0.38a 217.0±4.42a 216.1±2.95a 212.0±3.50a 208.2±4.15a 208.4±11.10a Plasma Mg (mg/dL) 3.36±0.27a 3.26±0.09a 3.17±0.10a 4.07±0.42b 4.17±0.40b 4.37±0.12b Plasma K (mmol/L) 4.45±0.21b 4.18±0.34b 4.47±0.21b 2.82±0.32a 2.53±0.27a 2.51±0.37a Plasma Cl (mmol/L) 179.8±4.14a 179.0±3.39a 178.8±2.28a 178.6±4.16a 186.0±6.89a 182.6±14.10a Hematokrit (%) 30.78±4.41a 31.07±3.01a 30.07±2.74a 30.20±2.33a 26.16±3.21ab 23.91±2.59b CRP (µg/mL) 44.0±0.16 a 48.0±0.13 a 48.0±0.8 a 64.0±0.11 b 46.0±0.7 a 53.0±0.13 a Ceruloplasmin (mg/L) 5.42±0.05b 5.57±0.19b 5.46±0.09b 4.10±0.08a 4.03±0.98a 4.13±0.61a * Different superscripts in a row refer significant differences (p<0.05).
did not return to normal values of controls after 24 and 48 h recovery in fresh sea water. Plasma Ca, Na and K increased significantly following to formalin exposure (p<0.05). However, during recovery period plasma Ca did not decline to the control levels. Plasma Na returned to control levels in 24 h recovery and then increased to high level exceeding exposure value in the period of 48 h recovery. Plasma K showed unsteadily fluctuated results both in control groups and recovery groups. Plasma P, Mg and Cl did not affected by formalin exposure (p>0.05), however, plasma P decreased significantly during recovery periods. Plasma Mg remained unchanged both after exposure and recovery periods. Plasma Cl increased significantly during recovery periods (p<0.05). Hematocrit values did not show any significant changes when compared the controls (p>0.05). Of the innate immune parameters CRP and ceruloplasmin levels elevated after formalin exposure (p<0.05) and did not return to control levels during recovery periods.
After formalin exposure plasma cortisol values in sea bass increased significantly (p<0.05). Plasma cortisol level declined to control levels of 24 and 48 h in the recovery period of 24 h. However, cortisol level increased slightly in the recovery period of 48 h. Plasma glucose values in sea bass increased after exposure to formalin (p<0.05) and did not return to normal values of controls after 24 and 48 h recovery in fresh sea water. Plasma Ca increased significantly following to formalin exposure (p<0.05) and remained high at 24 h recovery. However, during recovery period of 48 h plasma Ca declined to the control levels. Plasma P levels elevated after formalin exposure (p<0.05) and did not return to control levels during recovery periods. Plasma Na did not show any significant differences after exposure when compared to controls (p>0.05). Plasma Mg levels increased after exposure to formalin when compared to controls (p<0.05) and did not return to control levels. Plasma K remained unchanged (p>0.05). Plasma Cl was not affected by formalin exposure (p>0.05).
Hematocrit values did not change after exposure to formalin (p>0.05) however, hematocrit decreased during recovery periods. Of the innate immune parameters CRP levels elevated after formalin exposure (p<0.05) and returned to control levels during recovery periods of 24 and 48 h. Ceruloplasmin level increased after formalin exposure (p<0.05) and remained high during recovery periods.
Discussion and Conclusion
Plasma cortisol and glucose were affected by the formalin exposure. Plasma cortisol was found to be approximately 18-fold higher, glucose 2-fold higher in sea bream and cortisol 4-fold higher and glucose 3-fold
higher in sea bass than control fish. The higher values of plasma cortisol and glucose after exposure is related with the activation of chromaffin cells/HPI axis and secondary phases of stress response. Similar results were reported for confinement stress in sea bass (D. labrax) by Vazzana et al. (22); acute handling stress in red sea bream (Pagrus major) by Biswas et al. (4); air exposure and confinement stress in gilthead sea bream (S. aurata) by Arends et al. (1), handling stress in common dentex (Dentex dentex) by Morales et al. (11); crowding stress in gilthead sea bream (S. aurata) by Montero et al. (10); stress due to a drop in ambient temperature in gilthead sea bream (S. aurata) by Rottland et al. (16). Although plasma cortisol levels decreased during recovery period of 24 and 48 h they remained being elevated, did not return to control levels in sea bream. Elevated plasma cortisol level after exposure in sea bass returned to control level in 24 h recovery however, this decreased cortisol level was not maintained for the 48 h recovery. In both fish species, higher plasma glucose values measured after exposure decreased during recovery period however, did not return to control levels. Similar type of cortisol and glucose dynamics were also shown by Biswas et al. (4), Fanouraki et al. (7), Montero et al. (10) and Rottland et al. (15).
In the present study, plasma Ca, Na and K values increased in formalin exposed sea bream. During recovery period only plasma Na returned to control level in 24 h, however, increased within 48 h again. Plasma P, Mg and Cl were not affected by formalin exposure in sea bream however, plasma Cl increased within 48 h recovery. In sea bream a disturbance of the hydromineral balance was found in air-exposure and the confinement experiments with increased levels of Na, Mg and Cl and unchanged levels of plasma K, Ca and P after air exposure (1). Laiz-Carrion et al. (9) stated that cortisol-implanted sea bream (Sparus auratus) showed higher gill Na, K-ATPase however, no changes were observed in sodium and chloride levels. In sea bass exposed to formalin, plasma Ca, P and Mg increased in this study. During recovery period plasma P and Mg did not return to control levels however, plasma Ca returned back to control level within 48 h. Plasma K decreased after exposure in sea bass and did not return back to control levels in recovery period. Plasma Na and Cl remained unchanged in sea bass exposed to formalin. Deane et al. (5) demonstrated that cortisol administration to the marine teleost, Sparus sarba did not alter the serum Na and Cl levels.
Many stressors affect the hydromineral balance in fish (21) and cortisol is involved in the control of osmoregulatory capacity (9). In sea bream and sea bass after exposure in the present study, hydromineral balance was disrupted with different time profile responses and
magnitude, as stated by Arends et al. (1) for air-exposure and the confinement experiments in sea bream (Sparus aurata). Direct comparison with other values is not possible due to experimental differences.
Hematocrit has been shown to increase under stressful conditions (10, 13, 24). However, decrease in hematocrit under chronic stress has also been shown by Barcellos et al. (3). In this study, there was no significant increase or decrease in hematocrit values of sea bream and sea bass after exposure to formalin. The unchanged hematocrit values are possibly related to additional oxygen supply to the sea water during the experiment.
The stress-activated mechanism of immunodepression or immunosuppression in fish is not completely understood, but appears to be mediated through endocrine pathways (6). In this study, we observed change in immune response with two immune parameters namely, CRP and ceruloplasmin. The increase of CRP in several fish suggest that CRP is important in host defence machanism as it is a classical acute-phase reactant. Measurement of CRP is useful as a primary bioindicator for evaluating the health status of fish, with a possible application to determining levels of water contamination and timing therapy for fish diseases (8). CRP levels in sea bream decreased after exposure and in recovery period in the present study. However, CRP levels in sea bass increased soon after exposure but decreased to control levels following 48 h recovery. When considered the sea bass, the results are in agreement with the findings of Kodama et al. (8). Exposure of rainbow trout (Oncorhynchus mykiss) to anti-ectoparasite chemicals was found to cause an increase of CRP levels after exposure however, levels of CRP in the treated fish decreased afterwards to lower levels than in unexposed fish. Ceruloplasmin is one of the acute-phase proteins, released in response to infection and inflammation, playing important anti-inflammatory roles as a copper transporter from hepatocytes to other tissues, a regulator for hepatic iron mobilization as well as a scavenger of free radicals and superoxide (23). In the present study, ceruloplasmin values decreased after formalin exposure both in sea bream and sea bass and did not return to control values within 24 and 48 h recovery. Although the mechanism of this decrease is not clear it may be related with the high levels of plasma cortisol and glucose, as stated by Vazzana et al. (22). When compared sea bream and sea bass with respect to susceptibility to formalin exposure sea bream seemed to be more susceptible to stress of formalin exposure than sea bass with respect to primary (cortisol release) and secondary responses.
From the results presented here, it can be stated that formalin for prophylactic treatment may be an under-recognized stress source as blood chemistry of sea bream and sea bass after exposure has undergone alterations.
Acknowledgements
This work was supported by TUBITAK (The Scientific and Technological Research Council of Turkey) with the grant code of COST 867-106O257.
References
1. Arends RJ, Mancera JM, Munoz JL, Wendelaar Bonga SE (1999): The stress response of the gilthead seabream
(Sparus aurata L.) to air exposure and confinement. J
Endocrinol, 163, 149-157.
2. Ashley PJ (2007): Fish welfare:Current issues in
aquaculture, App Anim Behav Sci, 104, 199-235.
3. Barcellos LJG, Kreutz LC, de Souza SMG, Rodrigues LB, Fioreze I, Quevedo RM, Cericato L, Soso AB, Fagundes M, Conrad J, de Almeida Lacerda L, Terra S (2004): Hematological changes in jundia (Rhamdia quelen
Quoy and Gaimard Pimelodidae) after acute and chronic stress caused by usual aquacultural management, with emphasis on immunosuppressive effects. Aquaculture, 237,
229-236.
4. Biswas AK, Seoka M, Takii K, Maita M, Kumai H (2006): Stress response of red sea bream Pagrus major to
acute handling and chronic photoperiod manipulation.
Aquaculture, 252, 566 -572.
5. Deane EE, Kelly SP, Woo NYS (2000):
Hypercortisolemia does not affect the branchial osmoregulatory responses of the marine teleost Sparus sarba. Life Sci, 66, 1435-1444.
6. Esteban MA, Rodriguez A, Garcia Ayala A, Meseguer J (2004): Effects of high doses of cortisol on innate
cellular immune response of seabream (Sparus aurata L.)
Gen Comp Endocrinol, 137, 89-98.
7. Fanouraki E, Divanach P, Pavlidis M (2007): Baseline
values for acute and chronic stres indicators in sexually immature red porgy (Pagrus pagrus) Aquaculture, 265,
294-304.
8. Kodama AH, Matsuoka Y, Tanaka Y, Liu Y, Iwasaki T, Watarai S (2004): Changes of C-reactive protein levels
in rainbow trout (Oncorhynchus mykiss) sera after exposure to anti-ectoparasitic chemicals used in aquaculture Fish Shellfish Immunol 16, 589–597.
9. Laiz Carrion R, Sangiao Alvarellos S, Guzman JM, Martin del Rio MP, Miguez JM, Soengas JL, Mancera JM (2002): Energy metabolism in fish tissues related to
osmoregulation and cortisol action. Fish Physiol Biochem,
27, 179-188.
10. Montero D, Izquierdo MS, Tort L, Robaina L, Vergara, JM (1999): High stocking density produces
crowding stress altering some physiological and biochemical parameters in gilthead seabream, Sparus aurata, juveniles. Fish Pysiol Biochem, 20, 53-60.
11. Morales AE, Cardenete G, Abellan E, Garcia Rejon L (2005): Stress related pyhsiological responses to handling
in common dentex (Dentex dentex Linnaeus, 1758).
Aquacult Res, 36, 33-40.
12. Pelgrom SMGJ, Lock RAC, Balm PHM, Bonga W (1995): Integrated physiological response of tilapia to
sublethal copper exposure Aquat Toxicol, 32, 303-320.
13. Pierson PM, Lamers A, Flik G, Mayer Gostan N (2004): The stress axis, stanniocalcin and ion balance in
14. Reddy PK, Leatherland JF (1998): Stress Physiology,
Fish Diseases and Disorders. 279-302. In: JF Leatherland,
P Woo (Ed), Fish Diseases and Disorders, CABI Publishing, Oxon.
15. Rottland J, Balm PHM, Perez-Sanchez J, Wendelaar Bonga SE, Tort L (2001): Pituitary and interrenal
function in gilthead sea bream (Sparus aurata L., Teleostei) after handling and confinement stress. Gen
Comp Endocrinol, 121, 333-342.
16. Rottland J, Balm PHM, Perez-Sanchez J, Wendelaar Bonga SE, Tort L (2000): A drop in ambient temperature
results in a transient reduction of interrenal ACTH responsiveness in the gilthead sea bream (Sparus aurata, L.). Fish Pysiol Biochem, 23, 265-273.
17. Siwicki AK, Anderson DP (1993): Immunostimulation in
Fish: Measuring The Effects of Stimulants by Serological and Immunological Methods, The Nordic Symposium on
Fish Immunology, Lysekil, Sweden pp: 1-24.
18. Steel RGD, Torrie JH, Dickey DA (1996). Principles and
Procedures of Statistics: A Biometrical Approach. Third
Edition. Mc Graw-Hill. New York.
19. Treves-Brown KM (2000): Applied Fish Pharmacology, Aquaculture Series No:3, Kluwer Academic Publishers, London .
20. Watts M, Munday BL, Burke CM (2001): Isolation and
partial characterisation of immunoglobulin from southern bluefin tuna Thunnus maccoyii Castelnau, Fish Shellfish
Immunol, 11, 491-503.
21. Wendelaar Bonga SE (1997): The stress response in fish. Physiol Rev, 77, 591-625.
22. Vazzana M, Cammarata M, Cooper EL, Parrinello N (2002): Confinement stress in seabass (Dicentrarchus
labrax) depresses peritoneal leukocyte cytotoxicity.
Aquaculture, 210, 231-243.
23. Yada T, Muto K, Azuma T, Ikuta K (2004): Effects of
prolactin and growth hormone on plasma levels of lysozyme and ceruloplasmin in rainbow trout. Comp
Biochem and Physiol C, 139, 57–63.
24. Yildiz HY, Pulatsu S (1999): Evaluation of the secondary
stress response in healthy Nile tilapia (Oreochromis niloticus L.) after treatment with a mixture of formalin, malachite green and methylene blue. Aquacult Res, 30,
379-383.
Geliş tarihi: 16.04.2009 / Kabul tarihi: 14.07.2009 Address for correspondence:
Hijran Yavuzcan Yıldız
Ankara University,Faculty of Agriculture, Dept.of Fisheries and Aquaculture 06110 Ankara