Turkish Journal of Endocrinology and Metabolism, published by Galenos Publishing.
Purpose: This study aimed to investigate the influence of aerobic exercise on the quality of life and leptin and adiponectin levels in patients with type 2 diabetes mellitus.
Material and Method: Patients were randomized into two groups: aerobic exercise-training and control group. Parameters were assessed at baseline and end of the twelve-week follow-up for 60 type 2 diabetic patients who completed the program. The 36-item Short Form Health Survey was administered to the patients.
Results: The exercise-training group results showed a decrease in adiponectin and leptin levels, a reduction of waist circumference and percentage of body fat (p=0.007, 0.023, 0.012 and 0.048, respectively). The leptin levels in the aerobic exercise group were positively correlated with body mass index (r=0.303, p=0.021) and percentage of body fat (r=0.371, p=0.005); they were negatively correlated with physical problems (r=-0.482; p=0.009) and pain (r=-0.540; p=0.003). Exercise led to statistically significant improvements in the SF-36 physical functioning and mental health subscales (p=0.020 and 0.023, respectively).
Discussion: The association of better HbA1c, waist circumference, and percentage of body fat with improved mental and physical scores may be related to a decrease in leptin levels, despite a significant reduction in serum adiponectin levels. Turk Jem 2015; 19: 7-13
Key words: Adiponectin, exercise, leptin, SF-36, type 2 diabetes mellitus
Conflicts of Interest: The authors reported no conflict of interest related to this article.
Amaç: Bu çalışmada tip 2 diyabetli hastalarda aerobik egzersizin serum leptin, adiponektin düzeylerine ve yaşam kalitesi üzerine etkisini değerlendirmeyi amaçladık.
Gereç ve Yöntem: Hastalar 2 gruba randomize edildi: aerobik egzersiz ve kontrol grubu. Altmış tip 2 diyabetli hastanın parametreleri başlangıçta ve 12 haftalık program sonunda değerlendirildi.
Bulgular: Egzersiz grubunda adiponektin, leptin düzeylerinde düşme, bel çevresinde ve vücut yağ oranında azalma gözlendi (sırasıyla p değerleri 0,007, 0,023, 0,012, 0,048). Egzersiz grubunda leptin düzeyleri, Beden kitle indeksi (r=0,303, p=0,021), vücut yağ oranı (r=0,371, p=0,005) ile pozitif korelasyon, fizik problemlerle (r=-0,482; p=0,009) ve ağrı (r=-0,540; p=0,003) ile negatif korelasyon gösteriyordu. Aynı zamanda egzersiz, bir yaşam kalitesi ölçeği olan SF-36 anketinde fiziksel fonksiyon ve mental sağlık skalasında da anlamlı iyileşmeyle sonuçlandı (sırasıyla, p değerleri 0,020, 0,023).
Tartışma: Serum adiponektin düzeylerinde önemli ölçüde azalmaya rağmen, mental ve fiziksel skorlardaki iyileşme, HbA1c, bel çevresi ve vücut yağ oranındaki iyileşme azalan leptin düzeyleri ile ilişkili olabilir. Turk Jem 2015; 19: 7-13
Anah tar ke li me ler: Adiponektin, egzersiz, leptin, SF-36, tip 2 diyabet
Çıkar Çatışması: Yazarlar bu makale ile ilgili olarak herhangi bir çıkar çatışması bildirmemiştir.
Address for Correspondence: Süleyman Hilmi İpekci MD, Selçuk University Faculty of Medicine, Department of Internal Medicine, Division of Endocrinology and Metabolism, Konya, Turkey E-mail: [email protected] Received: 14/04/2014 Accepted: 05/12/2014
Nesrin Doğan Dede, Süleyman Hilmi İpekci*, Levent Kebapcılar*, Mihriban Arslan**, Sevil Kurban***,
Mustafa Yıldız****, Mustafa Sait Gönen*****
Başkent University Faculty of Medicine, Department of Internal Medicine, Konya, Turkey *Selçuk University Faculty of Medicine, Department of Internal Medicine, Division of Endocrinology and Metabolism, Konya, Turkey **Develi State Hospital, Clinic of Internal Medicine, Kayseri, Turkey ***Necmettin Erbakan University Meram Faculty of Medicine, Department of Biochemistry, Konya, Turkey ****Karamanoğlu Mehmetbey University Faculty of Physical Education and Sport, Karaman, Turkey *****Bilim University Faculty of Medicine, Department of Internal Medicine, Division of Endocrinology and Metabolism, İstanbul, TurkeyInfluence of Exercise on Leptin, Adiponectin and Quality of Life in
Type 2 Diabetics
Tip 2 Diyabetlilerde Egzersizin Leptin, Adiponektin ve Yaşam Kalitesi
Üzerine Etkisi
DOI: 10.4274/tjem.2564
Abs tract
Introduction
The incidence and prevalence of diabetes mellitus (DM) has been increasing in recent years (1). Type 2 DM (T2DM) is associated with insulin resistance and obesity resulting from genetic and environmental factors including the decrease of physical activity and the increase of calorie intake (2). Regular physical activity has a positive effect on insulin sensitivity, appetite, glycemic regulation, and control of body weight. Therefore, exercise is suggested as the primary first-line modality and is considered indispensable in the treatment of obesity and T2DM (3). However, the mechanisms underlying the beneficial effects of aerobic exercise that prevent cardiovascular disease and improve glycemic control are not entirely understood.
Adiponectin (4) and leptin (5), two proteins secreted by adipose tissue, are implicated in insulin resistance, and they may play a role in the etiology of T2DM. Adiponectin has anti-diabetic, insulin-sensitizing, anti-inflammatory, and anti-atherogenic effects (6,7) and it may be used as a treatment strategy in the management of obesity, diabetes, and metabolic syndrome (4). Adiponectin also has beneficial actions in the control of the inflammatory process and atherogenesis on vascular endothelial function (7). We have little knowledge about the relationship between the improvement in insulin resistance induced by short-term aerobic exercise and adiponectin levels in T2DM. In the literature, a few reports have investigated the acute or chronic effects of short- and long-term physical activity on plasma adiponectin levels (8,9,10,11).
Leptin is produced by adipocytes and acts on the satiety center on the hypothalamus to suppress appetite, limit food intake and increase energy expenditure. A leptin-resistant/hyperleptinemic state has been demonstrated in obesity and obesity related cardiovascular disease (12). Furthermore, there was a significant association between insulin resistance and serum leptin concentrations (13). High serum leptin levels and low serum adiponectin levels have been demonstrated to be related to T2DM (4,5). The effect of exercise on circulating adiponectin remains inconclusive, with increases (14,15), decreases (8), and “no change” (9) reported in different studies.
Several studies have shown that diabetic patients have a decreased quality of life (QOL) compared to healthy individuals (16). On the other hand, the relationship between glycemic control and QOL is unclear. A randomized controlled double-blind trial showed that improved HbA1c was associated with short-term improvement in QOL and economic benefits in T2DM (17). Another study showed no association (18) in these parameters.
In this study, the relationship between aerobic exercise and QOL as measured by the SF-36 was evaluated before and after 12 weeks of exercise. The major purpose of this study was to determine whether moderate-intensity exercise training would change leptin and adiponectin levels and whether leptin and adiponectin levels affect QOL. Another purpose was to determine if adults who regularly exercised had better QOL than those who did not perform these lifestyle behaviors.
Materials and Methods
ParticipantsPotential participants were excluded if they: 1- were receiving insulin therapy, 2- were participating in exercise ≥2 times per week for at least 20 min per session or had undertaken any resistance training during the previous six months, 3- reported changes in oral hypoglycemic medications during the previous two months, 4- reported changes in antihypertensive or lipid-lowering agents in the previous month, 5- reported a change of ≥5% in body weight during the previous two months, 6- had serum creatinine ≥1.5 mg/dL, 7- had proteinuria >1 g/24 h, 8- had blood pressure >160/95 mmHg, 9- had physical activity restrictions due to disease, 10- had other medical conditions making participation inadvisable, 11- had HbA1c >9.5%, 12- were smoking, 13- were receiving hormone replacement therapy, or 14- had any known microvascular or macrovascular diseases. Seventy-five T2DM patients aged between 35 and 70 years, with an HbA1c value of 6.5% or above, weight stability (±2 kg) 6 months before entry; without restraining orthopedic or neuromuscular diseases were assessed for eligibility. The study was approved by our institution’s ethics committee and it was conducted in accordance with the Declaration of Helsinki.
All participants were asked to revert to their pre-study activity levels. They were inactive and none reported previous systematic (more than once a week) exercise activity.
Nine of 75 subjects were unwilling to participate following completion of the preparation phase of the study (such as filling out the questionnaire, dietary assessment, and advice). Sixty-six subjects (medical outpatients) were randomized into two groups: aerobic exercise training and no exercise (control). Of these, six patients dropped out (three from each group) during the experimental period due to non-compliance and loss to follow-up. Twenty-nine males and 31 females with T2DM completed this study. The aerobic exercise and control groups did not differ in clinical or demographic characteristics. Eligible patients were interviewed to measure utility values, and they were administered the 36-item Short Form Health Survey (SF-36) (19) which provides scores on eight areas of functioning and well-being (physical functioning, mental health, role physical, role emotional, bodily pain, general health, vitality, and social functioning) and all items are summed and transformed to form a scale from 0 to 100. We used the Turkish version of the SF-36 prepared by Kocyigit and colleagues (20). A dietitian evaluated the study participants, and she prescribed a diet program to all participants according to American Diabetes Association recommendations (21). Participants were asked to check compliance with the diet at the end of the study. A total of 60 subjects were receiving blood glucose-lowering medication as follows: metformin alone (6 in exercise group, 6 in control group); sulfonylurea (1 in the exercise group, 1 in the control group); pioglitazone + metformin (4 in the exercise group, 4 in the control group); sulfonylurea + metformin (12 in the exercise group, 11 in the control group); sulfonylurea + pioglitazone (2 in the exercise group, 1 in the control group); and pioglitazone + metformin + sulfonylurea (5 in the exercise group, 7 in the control group). All patients completed the SF-36 using the pencil-and-paper method in a separate, quiet room while waiting for their turn to see the doctor. In order to avoid bias, relatives and friends were
not allowed to be present. On average, each patient took about 10-15 minutes to complete the SF-36. During the administration of the questionnaire, a researcher was readily available for assisting the patients in understanding the SF-36 if required. The researchers were instructed to minimize their explanations, and the patients were asked to answer the questions according to their understanding. After completion of the questionnaire, the researcher determined the completeness of the returned SF-36s. The participants filled out the SF-36 questionnaire again at the end of 12 weeks.
The aerobic exercise group consisted of 30 subjects who took part in an exercise-training program. The participants exercised on a treadmill three times per week, with training gradually progressing in length and intensity. Heart rate monitors were used to adjust workloads to achieve target heart rates. The participants progressed from 15-20 minutes per session at 60% of maximum heart rate to 45 minutes per session at 75% of measured maximum heart rate. A personal trainer was present for a minimum of three scheduled sessions weekly at each exercise facility and supervised the exercise program. After randomization, the trainer met each participant individually at least once a week for four weeks, then, every two weeks for the subsequent eight weeks to ensure appropriate progression through the program. The personal trainer monitored attendance and contacted the participants if any sessions were missed. Patients, who completed fewer than ten of the 12 weeks exercise sessions during the study period, were excluded. The control participants were asked to revert to their pre-study activity levels, and they continued with their normal daily activities during the twelve weeks of research without additional guided physical activities. Efforts were made to minimize dietary and medication co-intervention.
Laboratory Tests
Blood samples were obtained from all subjects in the morning between 08:00 and 09:00 hours after an overnight fast. Measurements were taken on recruitment and repeated after twelve weeks. The samples were centrifuged, aliquoted, and immediately frozen at -80 °C for analysis of leptin, adiponectin, and lipoproteins.
Serum glucose, total cholesterol (TC), LDL-cholesterol (LDL-c), triglyceride (TG), and HDL-cholesterol (HDL-c) levels were measured using Randox enzymatic kits in the Roche-Hitachi Modular system. LDL-c was calculated by the Friedewald equation method. Leptin and adiponectin concentrations in serum were determined using a commercially available ELISA kit from RayBiotech (Norcross, GA, USA). The intra- and inter-assay coefficients of variation were less than 7-10% for all parameters.
Body weight (kg) and height (cm) of all subjects were measured; measurements were taken on recruitment and repeated after twelve weeks. Body mass index (BMI) was calculated as weight in kilograms divided by the square of height in meters. Waist circumference (WC) was measured as the minimum between the costal margin and the iliac crest.
A foot-to-foot body fat analyzer (Tanita TBF 300, Tanita, Tokyo, Japan) was used for bioelectrical impedance analysis. Fat percentage was recorded before and after twelve weeks. Physical examinations included systolic and diastolic blood pressure
measurement using a mercury sphygmomanometer after a 10-minute rest.
Statistical Analysis
The Kolmogorov-Smirnov test was used to determine if continuous variables were normally distributed. For normally distributed data, results were presented as mean ± standard deviation (SD) and comparison between groups of continuous variables was performed by using the Student’s t test. When the variables were found not to be normally distributed (SF-36, and TG), results were given as median ± interquartile range (IQR); comparisons between groups of data were made using the Mann-Whitney U test. Differences between categorical variables were analyzed by the chi-square test (gender and DM treatment). Changes in outcome measures were assessed using paired t-test or the Wilcoxon-signed ranks test (SF-36, and TG). Relationships between variables were analyzed using Pearson’s or Spearman’s rank correlation coefficients (SF-36, and TG). Statistical analysis was carried out by using Statistical Package of Social Science (SPSS), version 16.0 (SPSS Inc., Chicago, IL). A p value of <0.05 was considered statistically significant.
Results
A total of 60 patients, 31 females and 29 males, were included in the analysis. HbA1c values, lipid panel values, and baseline scores on the SF-36 sub-scales and summary measures are shown in Tables 1 and 2.
No exercise-related injuries were reported. Five hypoglycemic events were observed immediately post-exercise, which were resolved with administration of high-sugar snacks. Exercisers did not report hypoglycemia at home or on non-training days. The aerobic exercise and control groups did not differ in baseline HbA1c, age, gender, percentage of body fat, duration of diabetes, BMI, WC, systolic (SAP) and diastolic arterial blood pressure (DAP), LDL-c, HDL-c, TG, TC, or leptin and adiponectin levels (Table 1). The SF-36 showed no statistically significant differences in baseline scores between the control and aerobic exercise groups except physical functioning (Table 2).
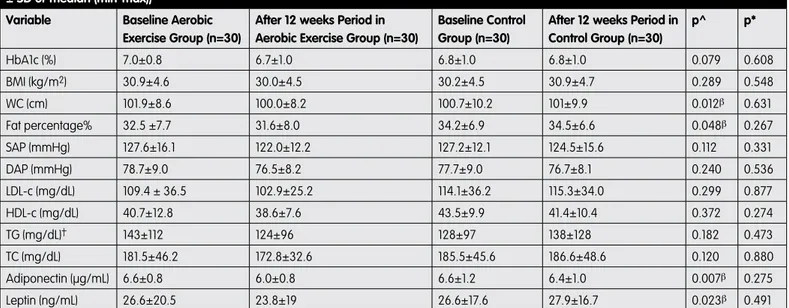
The exercise training group completed follow-up over twelve weeks, with a 2% weight loss. Lipid profile, BMI, and SAP and DAP decreased, but these changes were not statically significant (Table 3). HbA1c levels also decreased but were not statistically significant (7.0±0.8 vs. 6.7±1.0, p=0.079). The levels of WC, leptin, adiponectin and percentage of body fat decreased significantly after the 12-week period in the exercise training group (Table 3; p=0.012, 0.023, 0.007, 0.048, respectively). Changes in adiponectin levels were not associated with changes in any parameter.
Comparison of initial and terminal SF-36 scores revealed significant improvements in the physical functioning and mental health subscales in the aerobic exercise group (p=0.020, 0.023, respectively). No effects on the other SF-36 parameters were noted in that group (Table 4).
Spearman’s correlation analysis revealed that baseline physical functioning scores were correlated with mental health (r=0.496, p<0.001), physical functioning (r=0.494, p<0.001), bodily pain (r=0.584, p<0.001), general health (r=0.512, p<0.001), vitality
(r=0.544, p<0.001), social functioning (r=0.416, p=0.001), and role emotional (r=0.370, p=0.004) in both groups.
In both groups, baseline leptin levels were positively correlated with percentage of body fat (r=0.530, p<0.001), BMI (r=0.457, p<0.001), TC (r=0.301, p=0.021), and LDL-c (r=0.302, p=0.020). Baseline leptin levels were negatively correlated with physical functioning (r=-0.265, p=0.042), physical problems (r=-0.280, p=0.032), bodily pain (r=-0.360 p=0.005), general health (r=-0.334, p=0.010), vitality (r=-0.335, p=0.010), role emotional (r=-0.261, p=0.046) and mental health (r=-0.292, p=0.025). Baseline adiponectin levels were not correlated with any parameters. After the 12-week period, Spearman’s correlation analysis revealed that physical functioning scores in the aerobic exercise group were negatively correlated with HbA1c levels (Figure 1; r=-0.475, p=0.009);
mental health scores were negatively correlated with LDL-c levels (r=-0.391, p=0.044). After the 12-week period, mental health scores in the aerobic exercise group were positively correlated with physical functioning (r=0.478, p=0.009).
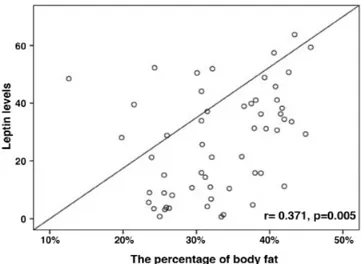
After the 12-week period, leptin levels in the aerobic exercise group were positively correlated with BMI (r=0.303, p=0.021) and percentage of body fat (Figure 2, r=0.371, p=0.005); they were negatively correlated with physical functioning (r=-0.482; p=0.009) and bodily pain (r=-0.540; p=0.003).
Discussion
Our data show that an aerobic exercise training program induced a significant decrease in adiponectin and leptin levels and WC, as
Table 2. The difference in the SF-36 between the two groups of patients at baseline
Scale in SF-36 Aerobic Exercise Group (n=30) Control (n=30) p
Physical health component
Physical functioning 85.0±18 60.0±41 0.010*
Physical problems 75.0±50 50.0±75 0.102
Pain 80.0±39 61.5±46 0.074
General health perception 60.0±27 58.5±43 0.425
Mental health component
Vitality 65.0±30 57.5±35 0.235
Social functioning 87.5±25 75.0±38 0.262
Emotional problems 66.6±67 100.0±75 0.402
Mental health 68.0±18 66.0±24 0.761
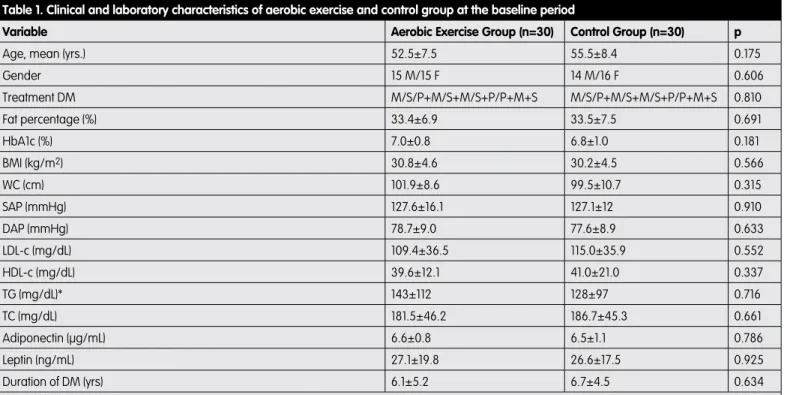
Data are median ± IQR. Mann-Whitney U test was applied to test for significant differences between groups. *p<0.05 by Mann-Whitney U test Table 1. Clinical and laboratory characteristics of aerobic exercise and control group at the baseline period
Variable Aerobic Exercise Group (n=30) Control Group (n=30) p
Age, mean (yrs.) 52.5±7.5 55.5±8.4 0.175
Gender 15 M/15 F 14 M/16 F 0.606 Treatment DM M/S/P+M/S+M/S+P/P+M+S M/S/P+M/S+M/S+P/P+M+S 0.810 Fat percentage (%) 33.4±6.9 33.5±7.5 0.691 HbA1c (%) 7.0±0.8 6.8±1.0 0.181 BMI (kg/m2) 30.8±4.6 30.2±4.5 0.566 WC (cm) 101.9±8.6 99.5±10.7 0.315 SAP (mmHg) 127.6±16.1 127.1±12 0.910 DAP (mmHg) 78.7±9.0 77.6±8.9 0.633 LDL-c (mg/dL) 109.4±36.5 115.0±35.9 0.552 HDL-c (mg/dL) 39.6±12.1 41.0±21.0 0.337 TG (mg/dL)* 143±112 128±97 0.716 TC (mg/dL) 181.5±46.2 186.7±45.3 0.661 Adiponectin (µg/mL) 6.6±0.8 6.5±1.1 0.786 Leptin (ng/mL) 27.1±19.8 26.6±17.5 0.925 Duration of DM (yrs) 6.1±5.2 6.7±4.5 0.634
Chi-square was used to detect differences between groups for gender and DM duration. Results were presented as mean ± SD, and *median ± IQR. P values <0.05 accepted as statistically significant
well as an improvement in physical functioning and mental health subscales in sedentary middle-aged type 2 diabetic subjects maintaining their usual dietary habits.
Adiponectin is secreted by visceral adipose tissue rather than subcutaneous adipose tissue, and recent studies have demonstrated that the visceral fat area is negatively correlated with plasma adiponectin levels in obese subjects (22). Furthermore, visceral adipose tissue, not total adipose tissue, plays an important role in pathogenesis of insulin resistance, T2DM, and cardiovascular disease (23,24). Circulating levels of adiponectin may be a link between visceral obesity and certain related metabolic abnormalities that contribute to the development of insulin resistance, T2DM, and atherosclerosis (25,26,27). Adiponectin levels have been reported to be inversely correlated with central adipose tissue stores. The marked reduction in WC induced by our training program was associated with a decrease in adiponectin
levels. These findings suggest that decreased adiponectin levels may be because of the increases in proinflammatory cytokines (28), such as inteleukin-6, tumor necrosis factor-α and adrenaline, or ethnicity discrepancy, in the post-exercise period (29). The reasons for these discordant findings are not clear.
In recent years, various authors have emphasized that increased adiponectin levels may not always be beneficial in terms of good health (30,31). Hadjadj et al. reported increased levels of adiponectin associated with diabetes-related microvascular complications (30). Dekker et al. found that high adiponectin serum levels predict all-cause and cardiovascular disease mortality (31). On the other hand, we found a relationship between leptin and the percentage of body fat and BMI in the exercise training group. This is in agreement with a number of studies that have shown decreases in leptin levels in response to weight loss, lower percentage of body fat, and decreased WC. In general, post-exercise decreases in leptin can
Table 4. The difference in the SF-36 baseline and after 12 weeks period in aerobic exercise group (median ± IQR)
Scale in SF-36 Before Exercise (n=30) After Exercise (n=30) p
Physical Health Component
Physical functioning 85.0±18 90.0±20 0.020β
Physical problems 75.0±50 100.0±25 0.367
Pain 80.0±39 74.0±38 0.936
General health perception 60.0±27 62.0±34 0.267
Mental Health Component
Vitality 65.0±30 70.0±28 0.216
Social functioning 87.5±25 87.5±25 0.776
Emotional problems 66.6±67 66.6±67 0.346
Mental health 68.0±18 72.0±20 0.023β
βStatistical difference compared to pre-test values of variables in aerobic exercise group of diabetic patients (Wilcoxon signed ranks test (SF-36); p<0.05)
Table 3. Comparisons of clinical and laboratory characteristics baseline and after 12 weeks period in aerobic exercise and control group (mean ± SD or median (min-max))
Variable Baseline Aerobic
Exercise Group (n=30)
After 12 weeks Period in Aerobic Exercise Group (n=30)
Baseline Control Group (n=30)
After 12 weeks Period in Control Group (n=30) p^ p* HbA1c (%) 7.0±0.8 6.7±1.0 6.8±1.0 6.8±1.0 0.079 0.608 BMI (kg/m2) 30.9±4.6 30.0±4.5 30.2±4.5 30.9±4.7 0.289 0.548 WC (cm) 101.9±8.6 100.0±8.2 100.7±10.2 101±9.9 0.012β 0.631 Fat percentage% 32.5 ±7.7 31.6±8.0 34.2±6.9 34.5±6.6 0.048β 0.267 SAP (mmHg) 127.6±16.1 122.0±12.2 127.2±12.1 124.5±15.6 0.112 0.331 DAP (mmHg) 78.7±9.0 76.5±8.2 77.7±9.0 76.7±8.1 0.240 0.536 LDL-c (mg/dL) 109.4 ± 36.5 102.9±25.2 114.1±36.2 115.3±34.0 0.299 0.877 HDL-c (mg/dL) 40.7±12.8 38.6±7.6 43.5±9.9 41.4±10.4 0.372 0.274 TG (mg/dL)† 143±112 124±96 128±97 138±128 0.182 0.473 TC (mg/dL) 181.5±46.2 172.8±32.6 185.5±45.6 186.6±48.6 0.120 0.880 Adiponectin (µg/mL) 6.6±0.8 6.0±0.8 6.6±1.2 6.4±1.0 0.007β 0.275 Leptin (ng/mL) 26.6±20.5 23.8±19 26.6±17.6 27.9±16.7 0.023β 0.491
Results were presented as mean ± SD, and †median ± IQR. p^ Before vs after 12 weeks period in aerobic exercise group. p* Before vs after 12 weeks period in control group. βStatistical difference compared to pre-test values of dependent variables in aerobic exercise group of diabetic patients (paired t-test and Wilcoxon signed ranks test (TG);
be observed if energy expenditure is high. In our study, BMI decreased after the 12 week-period in the exercise-training group, but these changes were not statically significant. The levels of WC and leptin decreased in spite of a significant decrease in serum adiponectin levels. Leptin levels were positively correlated with BMI and negatively with physical functioning and pain. As in our study, Gomez-Merino et al. reported a reduction in leptinemia after three weeks of military training, but body weight remained stable (32). Ishii et al. showed a reduction in leptinemia after six weeks of aerobic training in type 2 diabetic subjects (33). As with fat percentage, expected associations between physical activity and leptin were observed. Thus, our study supports a potential link between reduced leptin levels and elevated physical activity levels in patients with T2DM.
We found significantly lower leptin levels after exercise, and we concluded that regular exercise, by reducing WC and percentage of body fat, suppresses serum leptin levels. This decrease appeared despite the absence of significant changes in BMI. There is, however, a wide variation in serum leptin levels among
individuals with similar BMI or fat mass (34,35,36) indicating that there are also other modifiers of serum leptin levels.
Physical exercise affects hormonal concentrations (insulin, cortisol, growth hormone, catecholamines, testosterone, etc.) and metabolites (free fatty acids, lactic acid, triglycerides, etc.). For these reasons, we believe that physical exercise and training could modify leptin response, depending on several factors. After the 12-week period, mental health scores in the aerobic exercise group were positively correlated with physical functioning. Thus, high physical activity is viewed as a consequence of cognitive processing. A number of studies have indicated that physical activity can prevent or reduce mental health problems (typically, anxiety and depression) and that physically active adolescents are less likely to suffer from these mental health problems (37,38,39). In our study, we found that mental health scores were negatively correlated with LDL-c levels in the exercise-training group after the 12-week period. However, whether low-serum cholesterol levels may cause adverse effects on mental health remains unclear (40). Strandberg et al. found, with 39 years of follow-up, that men with the lowest serum cholesterol levels have longer survival rates, better physical function, and QOL, along with no adverse effect on mental health (41).
It is generally known that the overall QOL in patients with diabetes mellitus is poorer than in the normal population, however, the extent of this decline related to the level of glycemic control remains debatable, as results from previous studies have been inconsistent (17,18). After 12 weeks, we found that patients in the exercise training group who reported better physical functioning and vitality were more likely to have decreased HbA1c levels. Higher glycemic levels were associated with lower well-being scores (42). Improved QOL was positively associated with a decrease in hyperglycemic incidences, which may be a reflection of better glycemic control (17,43). Whether measures to improve physical functioning and vitality would help to improve glycemic control may be an area for future studies. Improved diabetic control through aerobic exercise training is associated with improved mental and physical functioning and is related to a decrease in adiponectin and leptin levels. Improvement in physical functioning and mental health and amelioration of glycemic status may result in an improvement of physical QOL. A limitation of our study is that there was a lack of multi-isoforms and receptors of adiponectin. The high molecular weight isoform has been shown to be the active form and, therefore, may be determined to identify the beneficial health effects of endurance training in T2DM. Our results may be explained by different adiponectin isoforms or the expression of adiponectin receptors. Finally, aerobic exercise training may bring about significant beneficial effects including a decrease in serum adiponectin and leptin and an improvement in body fat, glycemic status, and physical and mental QOL in type 2 diabetic individuals.
Larger, longer-term cohort studies are needed to further evaluate the relationship between glycemic control and QOL. Physicians should be aware of physical and mental QOL in the management of T2DM.
Acknowledgements
We would like to thank Fatma Ozdamar for help with samples collection.
Figure 1. Physical functioning scores were negatively correlated with HbA1c levels after 12 weeks period in aerobic exercise group
Figure 2. After 12 weeks period in aerobic exercise group, leptin levels were correlated with the percentage of body fat
References
1. Satman İ, İmamoğlu Ş, Yılmaz C, Ayvaz G, Çömlekçi A. Türkiye’de ve Dünya’da diyabet, Türkiye Endokrinoloji ve Metabolizma Derneği Diabetes Mellitus Çalışma ve Eğitim Grubu Raporu. Turk JEM. 2012;16:(1 Suppl):1-56. 2. Eriksson J, Lindström J, Tuomilehto J. Potential for the prevention of type 2
diabetes. Br Med Bull. 2001;60:183-199.
3. Diabetes Study Group of the Society of Endocrinology and Metabolism of Turkey. Exercise and physical activity in diabetes. Turk JEM. 2010;14:(1 Suppl):30-32.
4. Kadowaki T, Yamauchi T. Adiponectin and adiponectin receptors. Endocr Rev. 2005;26:439-451.
5. McNeely MJ, Boyko EJ, Weigle DS, Shofer JB, Chessler SD, Leonnetti DL, Fujimoto WY. Association between baseline plasma leptin levels and subsequent development of diabetes in Japanese Americans. Diabetes Care. 1999;22:65-70.
6. Yamauchi T, Hara K, Kubota N, Terauchi Y, Tobe K, Froguel P, Nagai R, Kadowaki T. Dual roles of adiponectin/Acrp30 in vivo as an anti-diabetic and anti-atherogenic adipokine. Curr Drug Targets Immune Endocr Metabol Disord. 2003;3:243-254.
7. Ohashi K, Ouchi N, Matsuzawa Y. Anti-inflammatory and anti-atherogenic properties of adiponectin. Biochimie. 2012;94:2137-2142.
8. Jürimäe J, Purge P, Jürimäe T. Adiponectin is altered after maximal exercise in highly trained male rowers. Eur J Appl Physiol. 2005;93:502-505. 9. Polak J, Klimcakova E, Moro C, Viguerie N, Berlan M, Hejnova J, Richterova
B, Kraus I, Langin D, Stich V. Effect of aerobic training on plasma levels and subcutaneous abdominal adipose tissue gene expression of adiponectin, leptin, interleukin 6, and tumor necrosis factor alpha in obese women. Metabolism. 2006;55:1375-1381.
10. Ferguson MA, White LJ, McCoy S, Kim HW, Petty T, Wilsey J. Plasma adiponectin response to acute exercise in healthy subjects. Eur J Appl Physiol. 2004;91:324-329.
11. Bobbert T, Wegewitz U, Brechtel L, Freudenberg M, Mai K, Möhlig M, Diederich S, Ristow M, Rochlitz H, Pfeiffer AF, Spranger J. Adiponectin oligomers in human serum during acute and chronic exercise: relation to lipid metabolism and insulin sensitivity. Int J Sports Med. 2007;28:1-8. 12. Martin SS, Qasim A, Reilly MP. Leptin resistance: a possible interface of
inflammation and metabolism in obesity-related cardiovasculardisease. J Am Coll Cardiol. 2008;52:1201-1210.
13. Zuo H, Shi Z, Yuan B, Dai Y, Wu G, Hussain A. Association between serum leptin concentrations and insulin resistance: a population-based study from China. PLoS One. 2013;8:e54615.
14. Bluher M, Bullen JW, Lee JH, Kralisch S, Fasshauer M, Klöting N, Niebauer J, Schön MR, Williams CJ, Mantzoros CS. Circulating adiponectin and expression of adiponectin receptors in human skeletal muscle: associations with metabolic parameters and insulin resistance and regulation by physical training. J Clin Endocrinol Metab. 2006;91:2310-2316.
15. Fatouros IG, Tournis S, Leontsini D, Jamurtas AZ, Sxina M, Thomakos P, Manousaki M, Douroudos I, Taxildaris K, Mitrakou A. Leptin and adiponectin responses in overweight inactive elderly following resistance training and detraining are intensity related. J Clin Endocrinol Metab. 2005;90:5970-5977.
16. Schram MT, Baan CA, Pouwer F. Depression and quality of life in patients with diabetes: a systematic review from the European depression in diabetes (EDID) research consortium. Curr Diabetes Rev. 2009;5:112-119. 17. Testa MA, Simonson DC. Health economic benefits and quality of life during
improved glycemic control in patients with type 2 diabetes mellitus: A randomized, controlled, double blind trial. JAMA. 1998;80:1490-1496. 18. Weinberger M, Kirkman MS, Samsa GP, Cowper PA, Shortliffe EA, Simel DL,
Feussner JR. The relationship between glycemic control and health-related quality of life in patients with non-insulin-dependent diabetes mellitus. Med Care. 1994;32:1173-1181.
19. Brazier JE, Harper R, Jones NM, O’Cathain A, Thomas KJ, Usherwood T, Westlake L. Validating the SF-36 health survey questionnaire: new outcome measure for primary care. BMJ. 1992;305:160-164.
20. Kocyigit H, Aydemir Ö, Fişek G, Ölmez N, Memiş A. Kısa form-36’nın Türkçe versiyonunun güvenilirliği ve geçerliliği. İlaç ve Tedavi Dergisi. 1999;12:102-116. 21. American Diabetes Association. Standards of Medical Care in
Diabetes-2009. Diabetes Care. 2009;32:13-61.
22. Kishida K, Kim KK, Funahashi T, Matsuzawa Y, Kang HC, Shimomura I. Relationships between circulating adiponectin levels and fat distribution in obese subjects. J Atheroscler Thromb. 2011;18:592-595.
23. Ryan AS. Insulin resistance with aging. Effects of diet and exercise. Sports Med. 2000;30:327-346.
24. Lapidus L, Bengtsson C, Larsson B, Pennert K, Rybo E, Sjöström L. Distribution of adipose tissue and risk of cardiovascular disease and death: a 12-year follow-up of participants in the population study of women in Gothenburg, Sweden. Br Med J. 1984;289:1257-1261.
25. Hotta K, Funahashi T, Arita Y, Takahashi M, Matsuda M, Okamoto Y, Iwahashi H, Kuriyama H, Ouchi N, Maeda K, Nishida M, Kihara S, Sakai N, Nakajima T, Hasegawa K, Muraguchi M, Ohmoto Y, Nakamura T, Yamashita S, Hanafusa T, Matsuzawa Y. Plasma concentrations of a novel, adipose-specific protein, adiponectin, in type 2 diabetic patients. Arterioscler Thromb Vasc Biol. 2000;20:1595-1599.
26. Vilarrasa N, Vendrell J, Maravall J, Broch M, Estepa A, Megia A, Soler J, Simon I, Richart C, Gomez JM. Distribution and determinants of adiponectin, resistin and ghrelin in a randomly selected healthy population. Clin Endocrinol (Oxf). 2005;63:329-335.
27. Oliveira CSV, Giuffrida FMA, Crispim F, Saddi-Rosa P, Reis AF. ADIPOQ and adiponectin: the common ground of hyperglycemia and coronary artery disease? Arq Bras Endocrinol Metab. 2011;55:446-454.
28. Gokbel H, Okudan N, Gul I, Belviranlı M, Gergerlioglu HS, Basarali MK. Effects of repeated bouts of supramaximal exercise on plasma adiponectin, inteleukin-6, and tumor necrosis factor-α levels in sedentary men. J Strength Cond Res. 2012;26:1675-1679.
29. Saunders TJ, Palombella A, McGuire KA, Janiszewski PM, Despres JP, Ross R. Acute exercise increases adiponectin levels in abdominally obese men. J Nutr Metab. 2012;2012:148729.
30. Hadjadj S, Aubert R, Fumeron F, Pean F, Tichet J, Roussel R, Marre M; SURGENE Study Group; DESIR Study Group. Increased plasma adiponectin concentrations are associated with microangiopathy in type 1 diabetic subjects. Diabetologia. 2005;48:1088-1092.
31. Dekker JM, Funahashi T, Nijpels G, Pilz S, Stehouwer CD, Snijder MB, Bouter LM, Matsuzawa Y, Shimomura I, Heine RJ. Prognostic value of adiponectin for cardiovascular disease and mortality. J Clin Endocrinol Metab. 2008;93:1489-1496.
32. Gomez-Merino D, Chennaoui M, Drogou C, Bonneau D, Guezennec CY. Decrease in serum leptin after prolonged physical activity in men. Med Sci Sports Exerc. 2002;34:1594-1599.
33. Ishii T, Yamakita T, Yamagami K, Yamamoto T, Miyamoto M, Kawasaki K, Hosoi M, Yoshioka K, Sato T, Tanaka S, Fujii S. Effect of exercise training on serum leptin levels in type 2 diabetic patients. Metabolism. 2001;50:1136-1140. 34. Considine RV, Sinha MK, Heiman ML, Kriauciunas A, Stephens TW, Nyce
MR, Ohannesian JP, Marco CC, McKee LJ, Bauer TL, Jose F, Caro MD. Serum immunoreactive leptin concentrations in normal weight and obese humans. N Engl J Med. 1996;334:292-295.
35. Maffei M, Halaas J, Ravussin E, Pratley RE, Lee GH, Zhang Y, Fei H, Kim S, Lallone R, Ranganathan S, Kern PA, Friedman JM. Leptin levels in human and rodent: measurement of plasma leptin and ob RNA in obese and weight-reduced subjects. Nat Med. 1995;1:1155-1161.
36. McGregor GP, Desaga JF, Ehlenz K, Fischer A, Heese F, Hegele A, Lammer C, Peiser C, Lang RE. Radioimmunological measurement of leptin in plasma of obese and diabetic human subjects. Endocrinology. 1996;137:1501-1504. 37. Farooqi IS, Jebb SA, Langmack G, Lawrence E, Cheetham CH, Prentice AM,
Hughes IA, McCamish MA, O’Rahilly S. Effects of recombinant leptin therapy in a child with congenital leptin deficiency. N Engl J Med. 1999;341:879-884. 38. Barbour KA, Blumenthal JA. Exercise training and depression in older
adults. Neurobiol Aging. 2005;26:S119-S123.
39. Fox KR. The influence of physical activity on mental well-being. Public Health Nutr. 1999;2:411-418.
40. Troisi A. Cholesterol in coronary heart disease and psychiatric disorders: same or opposite effects on morbidity risk? Neurosci Biobehav Rev. 2009;33:125-132.
41. Strandberg TE, Strandberg A, Rantanen K, Salomaa VV, Pitkälä K, Miettinen TA. Low cholesterol, mortality, and quality of life in old age during a 39-year follow-up. J Am Coll Cardiol. 2004;44:1002-1008.
42. van der Does FE, de Neeling JND, Snoek FJ, Kostense PJ, Grootenhuis PA, Bouter LM, Heine RJ. Symptoms and well-being in relation to glycemic control in type 2 diabetes. Diabetes Care. 1996;19:204-10.
43. Goddijn PP, Bilo HJ, Feskens EJ, Groeniert KH, van der Zee KI, Meyboom-de Jong B. Longitudinal study on glycemic control and quality of life in patients with Type 2 diabetes mellitus referred for intensified control. Diabet Med. 1999;16:23-30.