Tar. Bil. Der. Dergi web sayfası:
www.agri.ankara.edu.tr/dergi www.agri.ankara.edu.tr/journalJournal homepage:
TARIM BİLİMLERİ DERGİSİ
—
JOURNAL OF AGRICUL
TURAL SCIENCES
22 (2016) 99-108
Volatile Compounds, Chemical and Sensory Properties of Butters Sold
in Çanakkale
Aslı DEMİRKOLa, Onur GUNESERb, Yonca KARAGUL YUCEERa,
aÇanakkale Onsekiz Mart University, Faculty of Engineering, Department of Food Engineering, Terzioğlu Campus, 17020, Çanakkale, TURKEY bUşak University, Faculty of Engineering, Department of Food Engineering, 1 Eylül Campus, 64200, Uşak, TURKEY
ARTICLE INFO
Research Article
Corresponding: Yonca KARAGÜL YÜCEER, E-mail: [email protected], Tel: +90 (286) 218 00 18 Received: 08 October 2014, Received in Revised Form: 01 August 2015, Accepted: 01 August 2015
ABSTRACT
The aim of this study was to determine physical, chemical and sensory properties and volatile components of butter samples sold in Çanakkale. For this purpose, color, viscosity, refractive index, melting point, moisture (%), total acidity (%), acid degree value and fat content (%) of the samples were determined in eleven butter samples. Volatile compounds were identified by gas chromatography-mass spectrometry. Sensory properties of samples were determined by SpectrumTM method. There were significant differences among butter samples in terms of physical, chemical and
sensory properties. Viscosity, refractive index, melting point, moisture, total acidity and fat content of the samples ranged between 45.40-62.0 cP, 1.3331-1.4672, 32.50-37.50 ˚C, 15.03-19.06%, 0.24-0.42%, 82-89%, respectively. Diacetyl, acetoin, acetic acid, hexanoic acid, butyric acid and δ-decalactone were major volatiles in butter samples. In addition, cooked, creamy, rancid and margarine-like were the characteristic terms developed by the panelists.
Keywords: Butter; Volatiles; Sensory; Chemical properties
Çanakkale’de Satılan Tereyağlarının Uçucu Bileşenleri, Kimyasal ve
Duyusal Özellikleri
ESER BİLGİSİ
Araştırma Makalesi
Sorumlu Yazar: Yonca KARAGÜL YÜCEER, E-posta: [email protected], Tel: +90 (286) 218 00 18 Geliş Tarihi: 08 Ekim 2014, Düzeltmelerin Gelişi: 01 Ağustos 2015, Kabul: 01 Ağustos 2015
ÖZET
Bu çalışmanın amacı Çanakkale’de satılan tereyağı örneklerinin fiziksel, kimyasal ve duyusal özelliklerinin belirlenmesidir. Bu amaçla onbir tereyağı örneğinin, renk, viskozite, refraktif indeks, erime noktası, nem (%), toplam asitlik (%), asit değeri ve yağ içeriği belirlenmiştir. Uçucu bileşenler gaz kromatografisi-kütle spektrometresi kullanılarak belirlenmiştir. Örneklerin duyusal özellikleri SpectrumTM metodu ile ortaya konmuştur. Fiziksel, kimyasal ve duyusal
özellikler bakımından örnekler arasında önemli farklar olduğu bulunmuştur. Örneklerin viskozite, refraktif indeks, erime noktası, nem, toplam asitlik ve yağ içeriği sırasıyla 45.40-62.0 cP, 1.3331-1.4672, 32.50-37.50 ˚C, % 15.03-19.06,
1. Introduction
Butter has 80-90% of milk fat, 10-20% of water, 0.5-0.8% of lactose and lactic acid, 0.6-0.7% of milk proteins and 0.14% of mineral substances (Üçüncü 2010). It is used in processed foods as well as pastries and meals because of its high nutritional value and flavor make it acceptable by consumers (Hocalar 2011). Packaging materials and storage conditions affect physical, chemical and sensory properties of the butter (Krasue et al 2007). Many studies aimed to investigate physical, chemical and textural properties of butter in processing conditions during storage (Senel 2006; Altun et al 2011; Arslan et al 2011; Ronholt et al 2012). Sensory characteristics of the products as well as physical and chemical properties are important properties for consumers. For example, lactones generally give fruity, creamy and buttery odors that are desired characteristics for butter. However, hexanal was described to have an oxidized odour and contributed to undesirable flavour to butter (Mallia et al 2008). There were several researches also carried out on physical, chemical and sensory properties of butter during processing and storage period (Abdel-Mageed & Fadel 1994; Widder & Grosch 1997; Krause et al 2007; Krause et al 2008; Mallia et al 2009). Nevertheless, specifically differences in sensory properties and volatile profiles of butters manufactured by different producers had been discussed in limited studies (Atamer et al 2007; Arslan et al 2011; Şenel et al 2011). The main objective of this study was to investigate and reveal differences in some physical, chemical and sensory properties and volatile profiles of some butter samples provided from the local producers in Canakkale.
2. Material and Methods
2.1. Butter samples
Total eleven commercial butters were evaluated in this study. All samples were provided from local market in September 2012 in Canakkale-Turkey. Samples were packaged in plastic or aluminum foil and samples were approximately 250-350 g. Until analysis, all samples were stored in a freezer and analyzed as duplicate.
2.2. Physical and chemical analysis
L, a, and b values of butter samples were determined
by using Minolta Chroma Meter CR-400 model colorimeter (Minolta Inc., Japan). Viscosity was measured by Brookfield viscometer (Model DV II+ Pro, Brookfield Engineering Laboratories, Inc., MA, USA) integrated with circulating water bath (GFL, Grossburgwedel, Germany) according to Arslan et al (2011). Melting point was measured by capillary tube method according to Nas et al (2001) with minor modification. Refractive index was measured by Abbe 5 Refractometer (Bellingham-Stanly Co., Great Britain) at 40 oC. Moisture (%),
fat (%) and total acidity (lactic acid %) of butters were determined according to Bradley et al (1992). The acid value (AV, mg KOH g-1 oil) of butters was
determined according to Nas et al (2001).
2.3. Analysis of volatile compounds
Representative six samples were chosen by trained panelists for volatile analysis. Volatile compounds from butters were isolated by SPME technique (Pawliszyn 2012) according to Guneser & Karagul-Yuceer (2011). Volatiles were identified and quantified by gas chromatography-mass spectrometry (HP 6890 GC and 7895 C mass selective detector, Agilent Technologies,
% 0.24-0.42, % 82-89 arasında değişmektedir. Diasetil, asetoin, asetik asit, hekzanoik asit, butirik asit ve δ-dekalakton tereyağı örneklerinin önemli uçucu bileşenleridir. Ayrıca, pişmiş, kremamsı, ransit ve margarin benzeri panelistler tarafından geliştirilmiş karakteristik terimlerdir.
Anahtar Kelimeler: Tereyağı; Uçucular; Duyusal; Kimyasal özellikler
Wilmington, DE, USA). Nonpolar HP5 MS column (J & W Scientific, Folsom, CA) was used for separation of volatile compounds. The GC oven temperature was programmed from 40 to 230 oC
at a rate of 10 oC min-1 with initial hold of 5 min
and final hold time of 20 min. Helium was used as a carrier gas at 1.2 mL min-1. Identification of volatiles
was based on the comparison of the mass spectra of unknown compounds with those in the National Institute of Standards and Technology (NIST) and Wiley Registry of Mass Spectral Data, 7th Edition (Wiley). Amount of the compounds was calculated from relative abundances of flavor compounds according to Avsar et al (2004).
2.4. Sensory analysis
SpectrumTM method was used to determine the
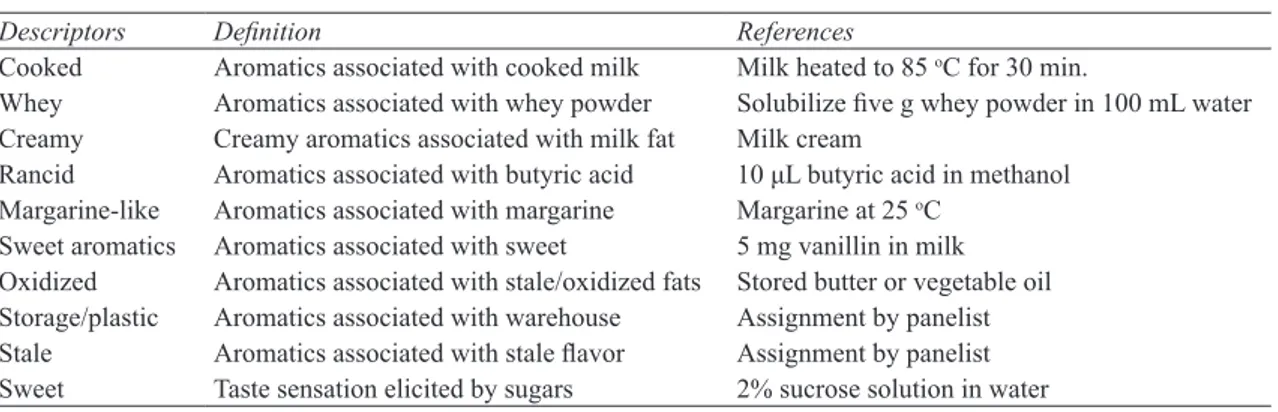
sensory attributes of the butters (Meilgaard et al 1999). Sensory evaluation was conducted by seven panelists. Panel members were staff and graduate students in the Department of Food Engineering at Canakkale Onsekiz Mart University; four were females and three were males and ages ranged from 27 to 45 years. The panel had approximately 200 h-experience on generation and definition of descriptive terms for dairy foods. The terms used to define taste and flavor of butter were shown in Table 1 (Meilgaard et al 1999; Bradley & Smukowski 2009). Duplicate samples were served in the different sessions.
2.5. Statistical analysis
Analysis of variance (one way ANOVA) was conducted to determine the differences among the butter samples with respect to physical, chemical and sensory properties. Welch test that is a non-parametric test was used for some data which did not meet the prerequisites (homogeneity of variance and equality of variance) for ANOVA. Least Significant Difference (LSD) test was used for separating means in data. Multidimensional Scaling Analysis (MDS, ALSCAL approach) was also conducted to reveal differences or similarities in butters in terms of volatile properties (Sheskin 2004). SPSS for Windows (version 17.0, SPSS Institute Inc., Chicago, IL, USA) (SPSS 2008) and Minitab 16.1 (Minitab Inc., State College, PA, USA) (Minitab 2010) were used for all statistical analyses.
3. Results and Discussion
3.1. Physical and chemical properties
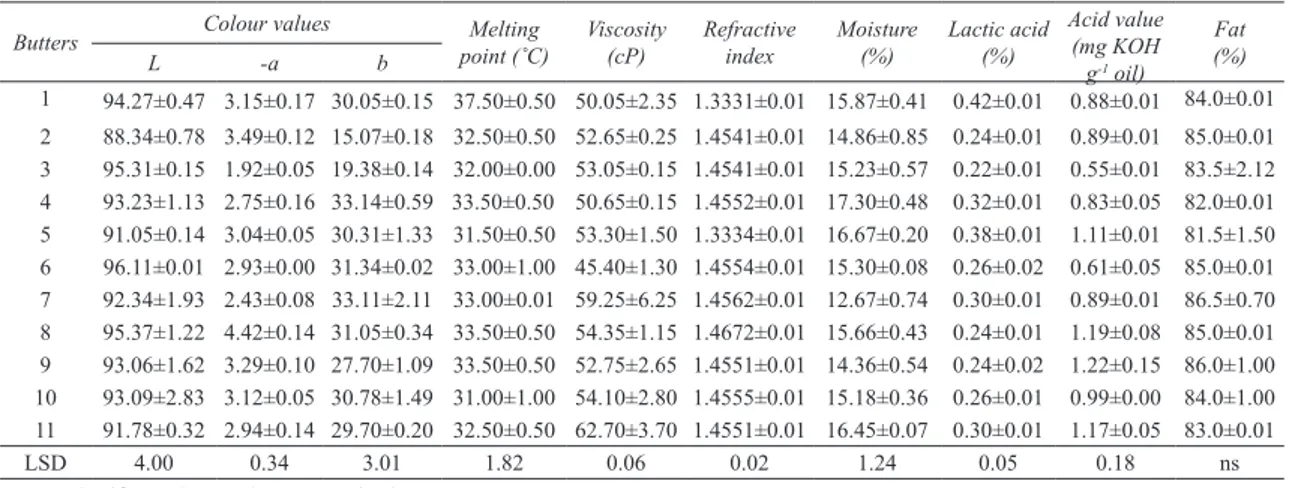
Physical and chemical properties of butter samples were shown in Table 2. L, -a and b values of the samples were significantly different (P≤0.05). L, -a and b values ranged between 88.34-96.11, 1.92-4.42 and 15.07-33.11, respectively. Sample 2 had the lowest L and b values, meanwhile the lowest -a value was observed in the sample 3. Hence, the highest -a value was observed in sample 8. Similar results were reported by other studies (Shukla et al 1994; Table 1- Descriptive terms used for sensory evaluation of butters
Çizelge 1- Tereyağlarının duyusal değerlendirmesinde kullanılan tanımlayıcı terimler
Descriptors Definition References
Cooked Aromatics associated with cooked milk Milk heated to 85 oC for 30 min.
Whey Aromatics associated with whey powder Solubilize five g whey powder in 100 mL water Creamy Creamy aromatics associated with milk fat Milk cream
Rancid Aromatics associated with butyric acid 10 μL butyric acid in methanol Margarine-like Aromatics associated with margarine Margarine at 25 oC
Sweet aromatics Aromatics associated with sweet 5 mg vanillin in milk Oxidized Aromatics associated with stale/oxidized fats Stored butter or vegetable oil Storage/plastic Aromatics associated with warehouse Assignment by panelist Stale Aromatics associated with stale flavor Assignment by panelist Sweet Taste sensation elicited by sugars 2% sucrose solution in water
Jinjarak et al 2006). L, a and b values of butters were determined as 88.67, -1.07 and 24.12, respectively by Shukla et al (1994). Moreover, Jinjarak et al (2006) revealed that no significant differences in L, a and b values of sweet cream, whey and cultured butter. It was found that L values of sweet cream, whey and cultured butter were 82.62, 85.89 and 85.14, while
b values were 20.04, 20.96 and 22.46, respectively.
The color of butter is the most important sensory quality parameter in terms of consumer preference. The color changes depending on many processing factors such as seasonal variations in milk content, microbial quality and storage conditions. It was emphasized that more yellowish color in butter associated with natural and “easier to spread” by consumer. Moreover, lack of color uniformity and mottled color in butter occurred by mixed churnings and an uneven distribution of moisture respectively (Krasue et al 2007; Bradley & Smukowski 2009). In the present study, samples 4 and 7 had the higher b values than other butters.
There were significant differences in terms of viscosity, refractive index and melting points of butter samples. Viscosities of butters ranged between 45.4-62.7 cP. Sample 11 had the highest viscosity while the lowest viscosity was observed in sample 6. Melting points of butters ranged between
31-37.5 oC. While sample 4 had the highest melting
point (37.50 oC), the lowest melting points were
observed in sample 10 and 5. The lowest refractive indexes were observed in samples 1 and 5 (Table 2). Sagdıc et al (2004) determined the melting points of traditional yayik butters produced from goat’s, ewe’s and cow’s milk. The melting points were found to be 31.75 oC, 33.05 oC and 32.05 oC for
goat’s, ewe’s and cow’s milk butters, respectively. Fatouh et al (2003) investigated the melting point of the various buffalo butter oil fractions obtained by multi-step dry fractionation. They determined that the slip melting points were ranged between 24.2-45.0 oC for liquid and solid fraction of butter oil
that obtained at different temperatures (15-40 oC).
Glibowski et al (2008) investigated the rheological and textural properties of some table fats. They indicated that apparent viscosities of butter (82% milk fat) and sweet cream butter (74% milk fat) were 457 and 427 Pa at 20 oC, respectively. Nikolova et al
(2007) investigated the refractive indexes of total 11 butter and margarine samples by using a specially designed laser refractometer. Refractive indexes of butter samples ranged between 1.4347-1.4491 at 40
oC. This range was in agreement with our findings in
the present study. Body and textural characteristics of butter were also important for acceptability Table 2- Physical and chemical properties of butter samples (n= 2, ±SE)
Çizelge 2- Tereyağı örneklerinin fiziksel ve kimyasal özellikleri (n= 2, ±SE)
Butters Colour values point (˚C)Melting Viscosity (cP) Refractive index Moisture (%) Lactic acid (%) Acid value (mg KOH g-1 oil) Fat (%) L -a b 1 94.27±0.47 3.15±0.17 30.05±0.15 37.50±0.50 50.05±2.35 1.3331±0.01 15.87±0.41 0.42±0.01 0.88±0.01 84.0±0.01 2 88.34±0.78 3.49±0.12 15.07±0.18 32.50±0.50 52.65±0.25 1.4541±0.01 14.86±0.85 0.24±0.01 0.89±0.01 85.0±0.01 3 95.31±0.15 1.92±0.05 19.38±0.14 32.00±0.00 53.05±0.15 1.4541±0.01 15.23±0.57 0.22±0.01 0.55±0.01 83.5±2.12 4 93.23±1.13 2.75±0.16 33.14±0.59 33.50±0.50 50.65±0.15 1.4552±0.01 17.30±0.48 0.32±0.01 0.83±0.05 82.0±0.01 5 91.05±0.14 3.04±0.05 30.31±1.33 31.50±0.50 53.30±1.50 1.3334±0.01 16.67±0.20 0.38±0.01 1.11±0.01 81.5±1.50 6 96.11±0.01 2.93±0.00 31.34±0.02 33.00±1.00 45.40±1.30 1.4554±0.01 15.30±0.08 0.26±0.02 0.61±0.05 85.0±0.01 7 92.34±1.93 2.43±0.08 33.11±2.11 33.00±0.01 59.25±6.25 1.4562±0.01 12.67±0.74 0.30±0.01 0.89±0.01 86.5±0.70 8 95.37±1.22 4.42±0.14 31.05±0.34 33.50±0.50 54.35±1.15 1.4672±0.01 15.66±0.43 0.24±0.01 1.19±0.08 85.0±0.01 9 93.06±1.62 3.29±0.10 27.70±1.09 33.50±0.50 52.75±2.65 1.4551±0.01 14.36±0.54 0.24±0.02 1.22±0.15 86.0±1.00 10 93.09±2.83 3.12±0.05 30.78±1.49 31.00±1.00 54.10±2.80 1.4555±0.01 15.18±0.36 0.26±0.01 0.99±0.00 84.0±1.00 11 91.78±0.32 2.94±0.14 29.70±0.20 32.50±0.50 62.70±3.70 1.4551±0.01 16.45±0.07 0.30±0.01 1.17±0.05 83.0±0.01 LSD 4.00 0.34 3.01 1.82 0.06 0.02 1.24 0.05 0.18 ns
by consumer. Body and textural characteristics of butter was effected by water content, chemical composition, fatty acid composition, polymorphism and structure of milk fat crystal network and also processing steps especially churning and tempering. For example, present of globular water in small droplets in the butter may cause an increase in viscosity or an increase in unsaturated fatty acids level in milk fat fraction may lead to decrease in melting point (Wright et al 2001). It was indicated that high quality butter should melt evenly and disappeared slowly. Moreover, body of high quality butter should be firm and show a distinct waxy and close-knit texture (Bradley & Smukowski 2009). In the present study, samples 5 and 10 had lowest melting points. Viscosities of the samples 2, 3, 5, 7-11 were higher than other samples. Significant differences were observed in moisture contents, total acidities and acid values (mg KOH g-1 oil) of
the butters (P≤0.05) while there were no differences among the samples in terms of fat content (%) (Table 2). Moisture (%), total acidity and fat (%) contents ranged between 12.67-17.30%, 0.22-0.42 and 81.5-86.5%, respectively. The highest moisture (17.30%) and the lowest fat content (81.5%) were observed in the samples 4 and 5, respectively. Sample 7 had the highest fat content (86.5%) (Table 2).
Samples 2 and 9 had the lowest moisture contents (14.86% and 14.36%). Our results are in agreement with the findings of other studies (Hayaloglu 1999; Sancak et al 2002; Arslan et al 2011). Turkish Food Codex (Anonymous 2005) for butter, milk fat based spreadable products and anhydrous milk fat require up to 16% moisture and at least 80% milk fat in butter. Moisture contents of samples 4, 5 and 11 did not comply with the Codex. Moreover, Arslan et al (2011) showed that total acidities of traditional butters were ranged between 0.51-3.44%. Differences among the butter samples in terms of acidity and acid value may also be due to the changes in the production steps, storage periods and microbial quality. The acid values of butter samples ranged between 0.55-1.22 mg KOH g-1 oil in the
present study. The lowest acid value was found in the samples 3 and 6. Atamer et al (2007) determined
that acid values of churn butter samples which were produced by the traditional methods ranged between 1.06-2.67 mg KOH g-1 oil. The amount of
lactic acid obtained from butter was related to the composition of raw materials and washing process used in the butter production (Atamer et al 2007). Acid value is associated with excess of free fatty acid due to hydrolysis of triglycerides in fat and oil. Adequate hydrolysis of triglyceride can be favorable for flavor formation. However, higher acid value is an indicator of undesirable processing and storage conditions such as high temperature and relative humidity in storage, high lipase activity in the butter due to insufficient thermal processing (Wilbey 2009). Low acid value and high acidity in butter indicate low quality butter and bad preservation condition (Bendixen 1940; Koczon et al 2008). Both parameters effect the consumption rate of butters. While, high acid value shows oxidation and rancidity in butters, high total acidity (% lactic acid) can be associated undesirable microflora and/or using of low quality milk for the production of butter.
3.2. Analysis of volatile compounds
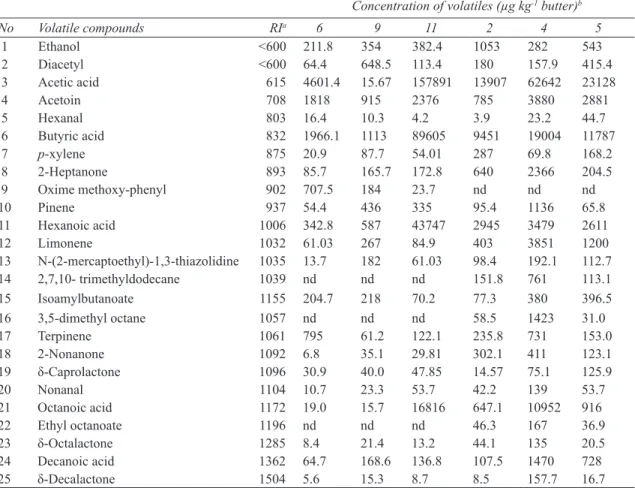
The major volatile compounds determined in butter samples were acids, aldehydes, ketones and lactones (Table 3). It was found that the amount of diacetyl in the butter samples ranged between 64.40-648.50 µg kg-1 butter. Diacetyl is one of the most important
aroma compounds in butter. It is also responsible for sweet and creamy flavor of other dairy products such as cheese, milk and fermented milks. In general, diacetyl was formed by lactose and citrate metabolism of lactic acid bacteria, especially
Lactococcus lactis ssp. Lactis biovar. diacetylactis
and Leuconostoc spp. (Jay et al 2005). Other aroma compounds that determined in butter samples at high levels were acetic acid (except sample 9), butyric acid and acetoin. They ranged between 15.67-62642 µg kg-1, 1113-89605 µg kg-1 and 785-3880 µg kg-1,
respectively. Butyric acid is formed by hydrolysis of free fatty acid and frequently identified in many cheese types (Parliament & McGorrin 2000; Curioni & Bosset 2002), while acetic acid is produced by lactose metabolism of hetero fermantative lactic
Table 3- Some volatile compounds determined in butter samples
Çizelge 3- Tereyağı örneklerinde belirlenen bazı uçucu bileşenler
Concentration of volatiles (µg kg-1 butter)b
No Volatile compounds RIa 6 9 11 2 4 5 1 Ethanol <600 211.8 354 382.4 1053 282 543 2 Diacetyl <600 64.4 648.5 113.4 180 157.9 415.4 3 Acetic acid 615 4601.4 15.67 157891 13907 62642 23128 4 Acetoin 708 1818 915 2376 785 3880 2881 5 Hexanal 803 16.4 10.3 4.2 3.9 23.2 44.7 6 Butyric acid 832 1966.1 1113 89605 9451 19004 11787 7 p-xylene 875 20.9 87.7 54.01 287 69.8 168.2 8 2-Heptanone 893 85.7 165.7 172.8 640 2366 204.5 9 Oxime methoxy-phenyl 902 707.5 184 23.7 nd nd nd 10 Pinene 937 54.4 436 335 95.4 1136 65.8 11 Hexanoic acid 1006 342.8 587 43747 2945 3479 2611 12 Limonene 1032 61.03 267 84.9 403 3851 1200 13 N-(2-mercaptoethyl)-1,3-thiazolidine 1035 13.7 182 61.03 98.4 192.1 112.7 14 2,7,10- trimethyldodecane 1039 nd nd nd 151.8 761 113.1 15 Isoamylbutanoate 1155 204.7 218 70.2 77.3 380 396.5 16 3,5-dimethyl octane 1057 nd nd nd 58.5 1423 31.0 17 Terpinene 1061 795 61.2 122.1 235.8 731 153.0 18 2-Nonanone 1092 6.8 35.1 29.81 302.1 411 123.1 19 δ-Caprolactone 1096 30.9 40.0 47.85 14.57 75.1 125.9 20 Nonanal 1104 10.7 23.3 53.7 42.2 139 53.7 21 Octanoic acid 1172 19.0 15.7 16816 647.1 10952 916 22 Ethyl octanoate 1196 nd nd nd 46.3 167 36.9 23 δ-Octalactone 1285 8.4 21.4 13.2 44.1 135 20.5 24 Decanoic acid 1362 64.7 168.6 136.8 107.5 1470 728 25 δ-Decalactone 1504 5.6 15.3 8.7 8.5 157.7 16.7
a, retention index on HP 5 MS column; b, relative abundances of flavor compounds; nd, not determined
acid bacteria and/or citric acid metabolism of homo and hetero fermentative lactic acid bacteria (Mayo et al 2010). Similar to diacetyl, acetoin is produced by lactic acid bacteria by using α-acetolactate synthase and α-acetolactate decarboxylase enzymes in lactose or citrate metabolism (Hickey et al 1983). The amount of butyric acid and diacetyl in butter were found 3600 µg kg-1, 340 µg kg-1, respectively
(Schieberle et al 1993). Samples 2, 4 and 5 and sample 11 had very high amount of butyric acid which is incompatible with Schieberle et al (1993). This difference may be related to types of butters, their age or storage conditions and extraction methods of volatile compounds.
Hexanoic, octanoic and decanoic acids were also determined in all samples. They ranged between 342.8-43747 µg kg-1, 15.7-16816 µg kg-1
and 64.7-168.6 µg kg-1, respectively. Sample 11 had
higher amount of hexanoic and octanoic acids than the other samples. Peterson & Reineccius (2003) determined twenty aroma active compounds in fresh sweet cream butter by using static headspace extraction methods with GC-MS and GC/O analysis. The researchers stated that the amount of diacetyl, butyric acid and hexanoic acid in fresh sweet cream were 6.6 µg kg-1, 192 µg kg-1 and 732
Aldehydes including hexanal and nonanal were also detected in the butters. These compounds are formed by decarboxylation of branched-chain keto acids by the Strecker metabolic pathways of lactic acid bacteria and can also be formed by secondary oxidation of fatty acids. Hexanal is well known secondary oxidation product of linoleic acid and nonanal can be formed by β-oxidation of oleic acid. Both compounds cause off-flavor in milk and dairy products (Kochhar 1996; Guneser & Karagul-Yuceer 2011).
Limonene, pinene and terpinene were determined at high concentrations in butters (Table 4). Terpenes and sesquiterpenes were found in plants as secondary metabolites. Therefore, these compounds might be transferred directly from forage to dairy products (Mariaca et al 1997; Viallon et al 2000). Similar to our results, Rae-Lee et al (1991) identified limonene and p-cymene at low levels in unsalted butter heated at different temperatures (100-150 oC).
The other important contributors of volatiles in butter were lactones formed by hydrolysis and cyclisation of hydroxy-fatty acid triglycerides (Nursten 1997; Sarrazin et al 2011). δ-caprolactone, δ-octalactone and δ-decalactone were identified in butter samples (Table 3). δ-caprolactone was found at the highest concentration in sample 5 (125.9
µg kg-1 butter) while sample 4 had the highest
concentration of δ-octalactone (135 µg kg-1 butter)
and δ-decalactone (157.7 µg kg-1 butter). In a study
conducted by Schieberle et al (1993) on different kinds of butters, the amount of δ-decalactone and (Z)-6-dodeceno-γ-lactone were determined between 2150-5000 µg kg-1 butter and 57-260 µg kg-1 butter,
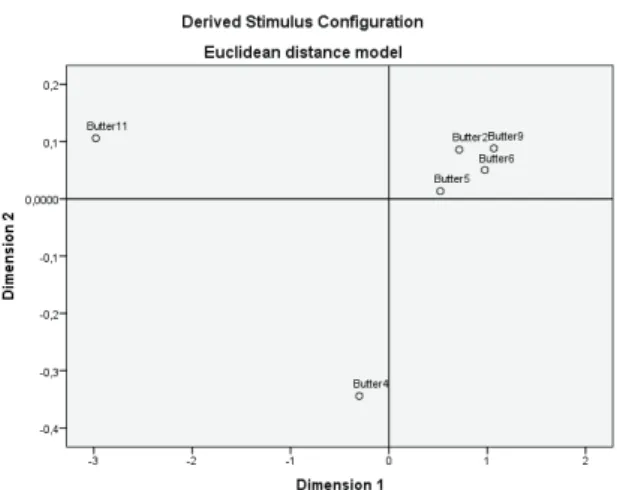
respectively. Lozano et al (2007) investigated the effect of cold storage and packaging material on commercial butter. The researchers identified δ-hexalactone, δ-octalactone, δ-decalactone, δ-dodecalactone and γ-nonalactone in sweet cream butter wrapped with foil and wax parchment paper. Researcher also observed an increase in these lactones for both butter samples during 6 and 12 months of storage at 4 oC and -20 oC. Figure 1
shows geometric representation of butters in terms of all volatile compounds. Butters 2, 5, 6 and 9 had similar flavor characteristics whereas butters 4 and 11 had quite different flavor profile than others in terms of volatile compositions.
3.3. Sensory analysis
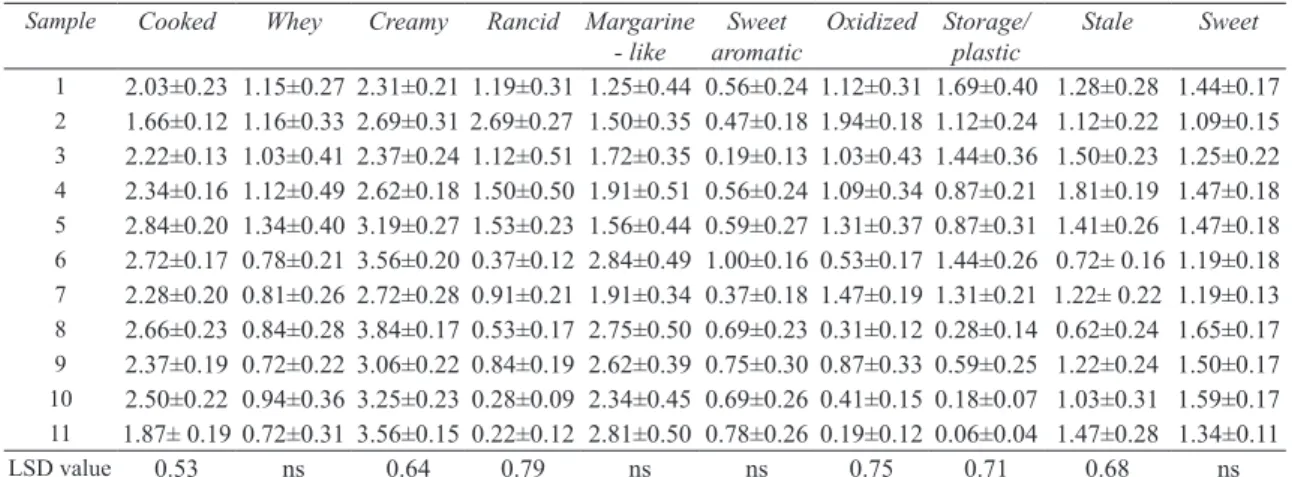
Creamy, cooked and margarine were characteristic attributes in butter samples (Table 4). There were no significant differences in whey, margarine-like, sweet aromatic and sweet attributes among Table 4- Sensory properties of butter samples (n= 2, ±SE)
Çizelge 4- Tereyağı örneklerinin duyusal özellikleri (n= 2, ±SE)
Sample Cooked Whey Creamy Rancid Margarine
- like aromaticSweet Oxidized Storage/ plastic Stale Sweet
1 2.03±0.23 1.15±0.27 2.31±0.21 1.19±0.31 1.25±0.44 0.56±0.24 1.12±0.31 1.69±0.40 1.28±0.28 1.44±0.17 2 1.66±0.12 1.16±0.33 2.69±0.31 2.69±0.27 1.50±0.35 0.47±0.18 1.94±0.18 1.12±0.24 1.12±0.22 1.09±0.15 3 2.22±0.13 1.03±0.41 2.37±0.24 1.12±0.51 1.72±0.35 0.19±0.13 1.03±0.43 1.44±0.36 1.50±0.23 1.25±0.22 4 2.34±0.16 1.12±0.49 2.62±0.18 1.50±0.50 1.91±0.51 0.56±0.24 1.09±0.34 0.87±0.21 1.81±0.19 1.47±0.18 5 2.84±0.20 1.34±0.40 3.19±0.27 1.53±0.23 1.56±0.44 0.59±0.27 1.31±0.37 0.87±0.31 1.41±0.26 1.47±0.18 6 2.72±0.17 0.78±0.21 3.56±0.20 0.37±0.12 2.84±0.49 1.00±0.16 0.53±0.17 1.44±0.26 0.72± 0.16 1.19±0.18 7 2.28±0.20 0.81±0.26 2.72±0.28 0.91±0.21 1.91±0.34 0.37±0.18 1.47±0.19 1.31±0.21 1.22± 0.22 1.19±0.13 8 2.66±0.23 0.84±0.28 3.84±0.17 0.53±0.17 2.75±0.50 0.69±0.23 0.31±0.12 0.28±0.14 0.62±0.24 1.65±0.17 9 2.37±0.19 0.72±0.22 3.06±0.22 0.84±0.19 2.62±0.39 0.75±0.30 0.87±0.33 0.59±0.25 1.22±0.24 1.50±0.17 10 2.50±0.22 0.94±0.36 3.25±0.23 0.28±0.09 2.34±0.45 0.69±0.26 0.41±0.15 0.18±0.07 1.03±0.31 1.59±0.17 11 1.87± 0.19 0.72±0.31 3.56±0.15 0.22±0.12 2.81±0.50 0.78±0.26 0.19±0.12 0.06±0.04 1.47±0.28 1.34±0.11 LSD value 0.53 ns 0.64 0.79 ns ns 0.75 0.71 0.68 ns
the butters. Moreover, significant differences were observed among the butters in terms of cooked, creamy, rancid, oxidized, storage/plastic and stale (P<0.05). Whey and rancid were more intense attributes for the samples 1-5 than the other samples (Table 4). Sample 5 had the highest cooked aroma meanwhile sample 8 had the highest creamy attribute. Creamy and margarine-like attributes were higher in the samples 6-11 than others. However some undesirable flavors including rancid, storage/plastic, oxidized and stale were also determined in some samples. It was also performed a multidimensional scale analysis (MDS chart and MDS data were not shown) for volatile compounds and sensory attributes to reveal the relationship of between sensory attributes and characterization of volatile compounds. It was found that cooked, whey and creamy intensities of butter samples were related to diacetyl, 2-heptanone, octalactone, decalactone and caprolactone. Moreover, octalactone closely related with cooked and creamy flavors while the same relationship was observed between whey, rancid flavor and decalactone.
Unsuitable processing and storage conditions, packaging materials and using low quality milk in the production of butter may lead to increase
in these undesirable attributes. Krause et al (2008) determined an increase in refrigerated/stale flavor and a decrease in milk fat and cooked/nutty flavor in stick and bulk butters stored at 5 oC and -20 oC
for 24 months. Sensory language for 27 commercial butters was developed by Krause et al (2007). They found that diacetyl, cooked, grassy, milk fat flavors and salty taste were key characteristics for butters. Jinjarak et al (2006) characterized sensory attributes of sweet cream, whey and cultured butter. Significant differences were found in yellow, shiny, acidic odor, melt rate, porous, hard, spreadable, cheese odor, mouth coating, nutty, cardboard odors, acidic, nutty, diacetyl and grassy flavors of butters. They revealed that whey butter had more nutty and cardboard odor than sweet and cultured butters. Hence, cultured butter had more acidic odor and flavor, and grassy flavor than sweet and whey butter.
4. Conclusions
Some physical, chemical and sensory properties of butter samples collected from local market in Canakkale were investigated in this study. Significant differences among the samples in terms of physical, chemical and sensory characteristics were determined. Color measurements, melting points, acidities and viscosities of the samples varied. In general, samples had similar refractive indexes. On the basis of high concentrations of diacetyl, acetic acid, acetoin, δ-caprolactone, δ-octalactone and δ-decalactone played important roles in flavor of butter samples. All butter samples had similar sensory characteristics in terms of whey, margarine-like, sweet aromatic and sweet taste. Further studies are needed to determine the effects of textural properties, storage conditions, packaging types and processing conditions on butters.
References
Abdel-Mageed M & Fadel H H M (1994). Effect of freeze storage on the volatiles of butter. Journal of Islamic Academy of Sciences 7: 185-188
Altun I, Andıc S, Tuncturk Y, Cecen A & Findik O (2011). Some chemical characteristics of butters obtained Figure 1- Multidimensional scaling map of butter
samples in terms of volatile compounds
Şekil 1- Uçucu bileşenler açısından tereyağı örneklerine ait çok boyutlu ölçeklendirme haritası
from Van market. Kafkas Universitesi Veteriner Fakültesi Dergisi 17: 645-648
Anonymous (2005). Turkish food codex for butter, milk fat based spreadable products and anhydrous milk fat. Codex number: 2005/19
Arslan N, Guneser O & Karagul-Yuceer Y (2011). Geleneksel ve endüstriyel tereyağlarının bazı kalite özellikleri (Some quality characteristics of traditional and industrial butters). Hasad Gıda 26: 16-21 Atamer M, Senel E & Oztekin S (2007). Farklı tür
sütlerden üretilen yayık tereyağlarının bazı nitelikleri (Some characteristics of churning butter produced from different types of milk). TUBITAK, Project no: 105O157, Ankara
Avsar Y K, Karagul-Yuceer Y, Drake M A, Singh T K, Yoon Y & Cadwallader K R (2004). Characterization of nutty flavor in Cheddar cheese. Journal of Dairy Science 87: 1999-2010
Bendixen H A (1940). Acid values and acid ratios as related to the keeping quality of salted butter. Journal of Dairy Science 23: 275-284
Bradley J R L, Arnold J E, Barbano D M, Semerad R G, Smith D E & Vines B K (1992). Chemical and physical methods. In: R T Marshal (Ed), Standard methods for the examination of dairy products, American Public Health Association, Washington, DC, pp. 363-532 Bradley J R L & Smukowski M (2009). Butter. In: S Clark,
M Costello, M A Drake & F Bodyfelt (Eds), Sensory Evaluation of Dairy Products, Springer Science + Business Media, New York, pp. 135-167
Curioni P M G & Bosset J O (2002). Key odorants in various cheese types as determined by gas chromatography-olfactometry. International Dairy Journal 12: 959-984
Fatouh A E, Singh R K, Koehler P E, Mahran G A, El-Ghandour M A & Metwally A E (2003). Chemical and thermal characteristics of buffalo butter oil fractions obtained by multi-step dry fractionation. LWT-Food Science and Technology 36: 483-496
Glibowski P, Zarzycki P & Krzepkowska M (2008). The rheological and instrumental textural properties of selected table fats. International Journal of Food Properties 11: 678-686
Guneser O & Karagül-Yüceer Y (2011). Characterization of aroma-active compounds, chemical and sensory properties of acid-coagulated cheese: Circassian cheese. International Journal of Dairy Technology
64: 517-525
Hayaloglu A A (1999). A comparative study on physicochemical, microbiological and organoleptic
qualities of butter produced from cream and yoghurt in Malatya region. M.Sc. Thesis, Çukurova University, Institute of Natural and Applied Sciences, Adana, Turkey
Hickey M, Hillier W A J & Jago G R (1983). Metabolism of pyruvate and citrate in lactobacilli. Australian Journal of Biological Sciences 36: 487-496
Hocalar B T (2011). Tereyağı Teknolojisi (Technology of Butter). Izmir: Ege Universitesi Yayınları, Ege Meslek Yüksek Okulu Yayın No: 22
Jay J M, Loessner M J & Golden D (2005). Milk, fermentation, and fermented and nonfermented dairy products. In: J M Jay, M J Loessner & D Golden (Eds), Modern Food Microbiology, Springer Science, NY, USA, pp. 149-175
Jinjarak S, Walker J H, Olabi A & Jimenez-Flores R (2006). Sensory, functional, and analytical comparisons of whey butter with other butters. Journal of Dairy Science 89: 2428-2440
Kochhar S P (1996). Oxidative pathways to the formation of off-flavours. In: M J Saxby (Ed), Food Taints and Off-flavors,Blackie Academic & professional, Chapman & Hall., Wester Cleddens Road, Bishopbriggs, Glasgow-UK, pp. 168-225
Koczon P, Gruczynska E, Kowalski (2008). Changes in the acid value of butter during storage at different temperatures as assessed by standard methods or by FT-IR Spectroscopy. American Journal of Food Technology 3: 154-163
Krause A J, Lopetcharat K & Drake M A (2007). Identification of the characteristics that drive consumer liking of butter. Journal of Dairy Science
90: 2091-2102
Krause A J, Miracle R E, Sanders T H, Dean L L & Drake M A (2008). The effect of refrigerated and frozen storage on butter flavor and texture. Journal of Dairy Science 91: 455-465
Lozano L P, Miracle R E, Krause A J, Drake M & Cadwallader K R (2007). Effect of cold storage and packaging material on the major aroma components of sweet cream butter. Journal of Agriculture and Food Chemistry 55: 7840-7846
Mallia S, Escher F & Schlichtherle-Cerny H (2008). Aroma-active compounds of butter: A review. European Food Research and Technology 226: 315-325
Mallia S, Escher F, Schieberle P, Dubois S & Schlichtherle-Cerny H (2009). Characterization and quantification of odor-active compounds in unsaturated fatty acid/ conjugated linoleic acid (UFA/CLA)-enriched butter and in conventional butter during storage and induced
oxidation. Journal of Agriculture and Food Chemistry
57: 7464-7472
Mariaca R G, Berger T F H, Gauch R, Imhof M I, Jeangros B & Bosset J O (1997). Occurrence of volatile mono- and sesquiterpenoids in highland and lowland plant species as possible precursors for flavor compounds in milk and dairy products. Journal of Agriculture and Food Chemistry 45: 4423-4434
Mayo B, Aleksandrzak-Piekrczyk T, Fernandez M, Kowalezyk M, Alvarez-MartinP & Bardowski J (2010). Updates in the metabolism of lactic acid bacteria. In M. Fernanda, R R Raya & G M Vignolo (Eds), Biotechnology of Lactic Acid Bacteria: Novel Applications, Blackwell Publishing, State Avenue, Ames, Iowa, USA, pp. 3-35
Meilgaard M, Civille G V & Carr B T (1999). Descriptive analysis techniques. In M. Meilgaard, G V Civille & B T Carr (Eds) Sensory Evaluation Techniques, CRC Press, FL: Boca Raton
Minitab 16.1 (2010). PA, USA, Minitab Inc. State College Nas S, Gokalp H S & Unsal M (2001). Bitkisel yağ
teknolojisi (Technology of vegetable oils), Pamukkale Üniversitesi Ders Kitapları, Yayın No: 005, Denizli, Turkey
Nikolova K, Panchev I & Sainov S (2007). Refractometric investigation of butter and margarine. European Food Research and Technology 225:139-143
Nursten H E (1997). The flavour of milk and dairy products: I. milk of different kinds, milk powder, butter and cream. International Journal of Dairy Technology 50: 48-56
Parliament T H & McGorrin R J (2000). Critical flavor compounds in dairy products. In: S J, Risch & C T Ho (Eds), Flavor Chemistry. ACS Symposium Series 756, ACS Books, Washington, D.C
Pawliszyn J (2012). Theory of solid phase micro extraction. In: J Pawliszyn (Ed), Handbook of solid phase microextraction, Elsevier Inc., Waltham, MA, USA, pp. 13-57
Peterson D G & Reineccius G A (2003). Determination of the aroma impact compounds in heated sweet cream butter. Flavour and Fragrance Journal 18: 320-324 Rae Lee S, Macku C & Shibamoto T (1991). Isolation
and identification of headspace Volatiles Formed in Heated Butter. Journal of Agriculture and Food Chemistry 39: 1972-1975
Ronholt S, Kirkensgaard J J K, Pedersen T B, Mortensen K & Knudsen J C (2012). Polymorphism, microstructure and rheology of butter: Effects of cream heat treatment. Food Chemistry 135: 1730-1739
Sagdıc O, Donmez M & Demirci M. (2004). Comparison of characteristics and fatty acid profiles of traditional Turkish yayik butters produced from goats’, ewes’ or cows’ milk. Food Control 6: 485-490
Sancak C Y, Işleyici O, Alişarlı M, Akkaya L & Elibol C (2002). Van’da tüketime sunulan kahvaltılık tereyağlarının mikrobiyolojik ve kimyasal nitelikleri. Yüzüncü Yıl Üniversitesi Veteriner Fakültesi Dergisi
13: 108-113
Sarrazin E, Frerot E, Bagnoud A, Aeberhardt K & Rubin M (2011). Discovery of new lactones in sweet cream butter oil. Journal of Agriculture and Food Chemistry
59: 6657-6666
Schieberle P, Gassenmeier K, Guth H, Sen A & Grosch W (1993). Character impact odour compounds of different kinds of butter. LWT-Food Science and Technology 26: 347-356
Sheskin D J (2004). Handbook of parametric and nonparametric statistical procedures, Chapman and Hall / CRC press, New York
Shukla A, Bhaskar A R, Rizvi S S H, & Mulvaney S J (1994). Physicochemical and rheological properties of butter made from supercritically fractionated milk fat. Journal of Dairy Science 1: 45-54
SPSS (2008). SPSS Professional Statistics 17.0, Chicago, IL SPSS Inc
Senel E (2006). Bazı üretim parametrelerinin yoğurttan üretilen yayık tereyağının nitelikleri üzerine etkisi (The effect of some production parameters on yayık butter produced from yoghurt), Ph.D. Thesis, Ankara University Department of Dairy Technology, Institute of Natural and Applied Sciences, Turkey
Şenel E, Atamer M & Oztekin F S (2011). The oxidative and lipolytic stability of Yayık butter produced from different species of mammals milk (cow, sheep, goat) yoghurt. Food Chemistry 127: 333-339
Üçüncü M (2010). Süt ve Mamülleri Teknolojisi. Sidas Yayıncılık, İzmir
Viallon C, Martin B, Verdier-Metz I, Pradel P, Garel J P & Coulon J B (2000). Transfer of monoterpenes and sesquiterpenes from forages into milk fat. Le Lait 80: 635-641
Widder S & Grosch W (1997). Precursors of 2-nonenals causing the cardboard off-flavour in butter oil. Nahrung 41: 42-45
Wilbey R A (2009). Butter. In: A Tamime (Ed), Dairy fat and related products, Wiley-Blackwell Publishing, Ames Iowa, USA, pp. 86-106.
Wright A J, Scanlon M G, Hartel R W & Marangoni A G (2001). Rheological properties of milkfat and butter. Journal of Food Science 66: 1056-1071