Tarım Bilimleri Dergisi
Tar. Bil. Der. Dergi web sayfası: www.agri.ankara.edu.tr/dergi
Journal of Agricultural Sciences
Journal homepage:www.agri.ankara.edu.tr/journal
TARIM BİLİMLERİ DERGİSİ
—
JOURNAL OF AGRICUL
TURAL SCIENCES
21 (2015) 382-393
The Relationship Between Flag Leaf Senescence and Grain Yield of
Some Durum Wheat Varieties under Drought Stress During Grain
Filling Period
Murat TİRYAKİOĞLUa
aMustafa Kemal University, Agricultural Faculty, Field Crops Department, Hatay,TURKEY
ARTICLE INFO
Research Article
Corresponding Author: Murat TİRYAKİOĞLU, E-mail: [email protected], Tel: +90 (532) 522 08 68 Received: 09 May 2014, Received in Revised Form: 15 September 2014, Accepted: 16 September 2014
ABSTRACT
This study aimed at investigating genotypic differences in the leaf area duration of durum wheat genotypes during grain filling periods and their relation to grain yield under two different irrigation conditions. The experiments were designed randomized complete block design for four replication in 2009/2010 and 2010/2011. Irrigation levels in main plots, cultivars were included in the sub plots. The study gathered data of six genotypes with similar anthesis times in Antakya/Hatay-Turkey. During the growth period, the two groups of plants received general management techniques and 60 kg ha-1 phosphorus and 80 kg ha-1 nitrogen (ammonium sulphate) fertilizer. Two different irrigation regimes were
applied; the control group received full irrigation until reaching physiological maturity, while the experiment group was not irrigated after anthesis but instead received rainfall characteristic of WANA (West Asia North Africa). Results showed that flag leaf area (FLA) and lower leaf area (LLA) were not significantly related to spike grain yield (SGY) under control conditions. Flag leaf area duration (FLAD) was not related to grain yield, while the increase in lower leaf area duration (LLAD) reduced grain yield. Meanwhile, a positive relation was observed between FLA and SGY under experimental conditions, since SGY significantly increased according to the increase of FLAD. Moreover, high FLAD positively contributed to grain filling under both the conditions, while high LLAD partly contributed only under control conditions. These results suggest that the genotypes with low leaf number or short plant height and low tillering capacity should receive significant irrigation, while genotypes with middling plant height should be planted during conditions of drought stress. Under both the sets of conditions genotypes must have high FLAD.
Keywords: Flag leaf area; Lower leaf area; Leaf area duration; Drought stress; Grain yield; Wheat
Bazı Makarnalık Buğday Genotiplerinde Dane Dolum Dönemindeki
Kuraklık Stresinde Bayrak Yaprak Yaşlanması ile Tane Verimi İlişkisi
ESER BİLGİSİ
Araştırma Makalesi
Sorumlu Yazar: Murat TİRYAKİOĞLU, E-posta: [email protected], Tel: +90 (532) 522 08 68 Geliş Tarihi: 09 Mayıs 2014, Düzeltmelerin Gelişi: 15 Eylül 2014, Kabul: 16 Eylül 2014
383
Ta r ı m B i l i m l e r i D e r g i s i – J o u r n a l o f A g r i c u l t u r a l S c i e n c e s 21 (2015) 382-393
1. Introduction
During the period of wheat spike growth, the important moment of assimilation that supplies carbon for the grain depends on the amount and quality of light on the surface of the green area after anthesis. This assimilation area normally decreases due to natural senescence and various stresses. At this time, the growing grain requires more carbon, and assimilation becomes essential for the survival of the plant (Blum 1998).
The leaf water potential decreased earlier (Royo et al 2004; Guóth et al 2009) and at a higher rate in the sensitive than in the tolerant cultivars (Entz & Fowler 1990; Yang et al 2001; Guóth et al 2009). Drought stress substantially increasd absisic acid (ABA) but reduced zeatin (Z) + zeatin riboside (ZR) concentrations in leaves (Yang et al 2003). In leaf tissue increased depending on the concentration of ABA is nitrogen and non structure carbohydrates is carried out transport of grains (Yang et al 2003). It also begins to decrease in chlorophyll content and photosynthesis rate drops (Yang et al 2001).
The contribution of dry matter (DM) to both the flag leaf (FL) and lower leaves (LL) allow the
areas to either remain green for a definite period or continue to change according to the rate of senescence (Fischer & Kohn 1966; Borrell et al 2000; Blake et al 2007). However, data of only the size of the leaf area and its stay-green period cannot sufficiently determine the total efficiency of photosynthesis. In this situation, the leaf green area and its green period have a special function that increases the importance of green area duration (Mohiuddin & Croy 1980; Blake et al 2007), thus these factors affect the weight of the grain and its productivity. As a result, it is clear that this effect varies according to many factors, such as drought stress during grain filling (Yang et al 2001).
The grain DM accumulated in the share of LL is lower than its share from the FL. In fact, some stress conditions (e. g., droght stress) or cultural practices, such as excessive plant density, were not important contributors. LL contributes to the impotence of grain DM, while stress factors linked to premature aging (Finnan et al 1998; Öztürk 1999; Gelang et al 2000; Sahahand & Paulsen 2003; Valentinuz & Tollenaar 2004) or non-sparse planting (Borras et al 2003) are due to shadowing by the FL.
ÖZET
Çalışmada, bazı makarnalık buğday çeşitlerinde dane dolum dönemindeki kuraklık stresinde yaprak alan sürekliliği ile dane verimi arasındaki ilişki incelenerek, çeşitler arasında bu unsurlar yönünden herhangi bir farklılığın olup olmadığı araştırılmıştır. Çalışma, çiçeklenmesi aynı zamanda gerçekleşmiş altı adet çeşitle Antakya/Hatay koşullarında 2009/2010 ve 2010/2011 yetiştirme sezonunda yürütülmüştür. Deneme her iki yıl tesadüf bloklarında bölünmüş parseller deneme desenine göre dört tekrarlamalı kurulmuştur. Uygulamada sulama seviyeleri ana, çeşitler alt parsellerde yer almıştır. Fosforun tamamı ekimle birlikte (60 kg P2O5 ha-1) tiriple süper fosfat şeklinde toprağa uygulanmıştır. Azot ise amonyum
sülfat formunda ve ekim, kardeşlenme ve sapa kalkma dönemlerinde (30+30+20 kg N ha-1) verilmiştir. Sulama
uygulaması, fizyolojik oluma kadar sulama (I1: tam sulama-konrtol) ve çiçeklenmeye kadar sulama (I2: WANA: (West
Asia North Africa) yağış rejimi) olarak iki farklı şekilde gerçekleştirilmiştir. Çalışma sonucunda; I1 koşularında bayrak yaprak alanı (BYA), ile başak dane verimi (BDV) arasında önemli ilişki tespit edilememiştir. Benzer sonuç bayrak yaprak
alan sürekliği (BYAS) ile dane verimi arasında da gözlenmiştir. I2 koşullarında BYA ile BDV arasındaki ilişki, olumlu
olmuştur. Sonuç olarak yüksek BYAS’ye sahip olma, her iki sulama koşulunda da danede madde birikimine olumlu etki yapmıştır. Bu sonuçlara göre, kuraklık stresi olmayan koşullarda bitkide yaprak sayısı daha az olan dolayısıyla kısa boylu ve az kardeşlenen, su tresi olan koşullarda ise orta boylu genotip modeli önerilebilir. Ancak her iki koşulda da bitki, bayrak yaprak alanı sürekliliği yönünden yüksek değere sahip olmalıdır.
Anahtar Kelimeler: Bayrak yaprak alanı; Alt yaprak alanı; Yaprak alan sürekliliği; Kuraklık stresi; Dane verimi; Buğday © Ankara Üniversitesi Ziraat Fakültesi
Bazı Makarnalık Buğday Genotiplerinde Dane Dolum Dönemindeki Kuraklık Stresinde Bayrak Yaprak Yaşlanması..., Tiryakioğlu
384
Ta r ı m B i l i m l e r i D e r g i s i – J o u r n a l o f A g r i c u l t u r a l S c i e n c e s 21 (2015) 382-393Therefore, a positive and significant relationship exists between leaf area and leaf area duration. According to Dokuyucu et al (1996), a positive and significant relationship also exists between FLA and FLAD. However, the size during flag leaf duration is also associated with a low yellowing rate. During leaf area duration, there is the large leaf area on the one hand, while on the other hand there is also what should be considered a late yellowing property.
This study thus aimed at determining changes of aging in leaves and the elements of aging during the period of grain development in order to examine both the relationship between grain yields and whether there were any differences among the genotypes under conditions of drought stress.
2. Material and Methods
A study investigate 2 years was conducted at Antakya/Hatay (36ͦ 15΄ N, 36 13΄ E; D 80 m) in
2009/2010 and 2010/2011. This region is called WANA (West Asia North Africa).
The soil in the study region consists of clay and mainly alluvium material and forms either flat or lightly sloping land. It has low organic matter with light alkali character. Before planting, total nitrate in the 600 mm profile was 0.86 mg during the
first year and 0.76 mg during the second year. The experiments were designed randomized complete block design with four replications in first and second year. Irrigation levels in main plots, cultivars were included in the sub plots. The study was performed on six cultivars (i. e. of CIMMYT origin; Amanos-97, Ceylan-95, Fırat-93, Gediz-75, Harran-95, and Zenit (Italian origin) whose anthesis occurred on the same day (Koç et al 2002). These cultivars were sown on 27 November during the first year and on 10 December during the second year. Sowing was performed in eight lines of 6 × 1.2 m, each 0.2 m apart. The seeds were sown with a planter at 450 seeds m-2.
Whole phosphorus (60 kg P2O5 ha-1) was mixed with
the soil as triple superphosphate, while nitrogen in the form of ammonium sulphate was given during planting, tillering and stem elongation (30 + 30 + 20 kg N ha-1). To germination properly after planting,
45.3 mm (20.3 + 25.0) and 50.5 mm (24.7 + 25.8) of water were given via a sprinkler irrigation system during the first and second years, respectively. After germination, the time and the amount of water were considered, as well as the PAN evaporating values and amount of rain. When the amount of water in the soil reached 50% field capacity, a decreased amount of water was added to the soil by irrigation (Table 1). The irrigation activities were performed in one of two ways; the control group received irrigation until
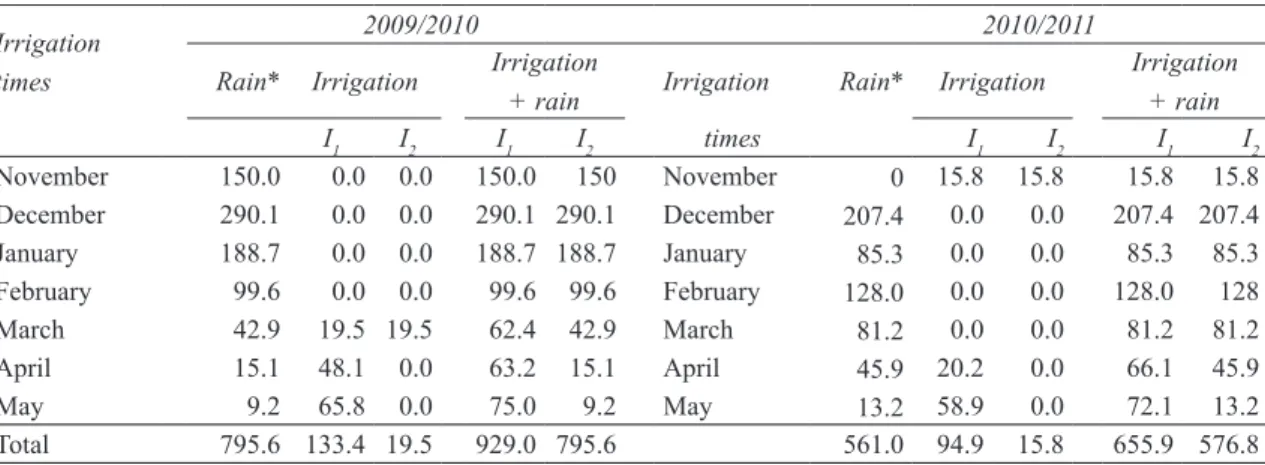
Table 1- Rainfall occurred in both vegetation (first and second year) period and the amount of irrigation at I1 and I2 (mm)
Çizelge 1- Birinci ve ikinci yıldaki yağış ve her iki koşulda (I1 ve I2) yapılan ilave sulama miktarları (mm)
Irrigation times
2009/2010 2010/2011
Rain* Irrigation Irrigation
+ rain Irrigation Rain* Irrigation
Irrigation + rain I1 I2 I1 I2 times I1 I2 I1 I2 November 150.0 0.0 0.0 150.0 150 November 0 15.8 15.8 15.8 15.8 December 290.1 0.0 0.0 290.1 290.1 December 207.4 0.0 0.0 207.4 207.4 January 188.7 0.0 0.0 188.7 188.7 January 85.3 0.0 0.0 85.3 85.3 February 99.6 0.0 0.0 99.6 99.6 February 128.0 0.0 0.0 128.0 128 March 42.9 19.5 19.5 62.4 42.9 March 81.2 0.0 0.0 81.2 81.2 April 15.1 48.1 0.0 63.2 15.1 April 45.9 20.2 0.0 66.1 45.9 May 9.2 65.8 0.0 75.0 9.2 May 13.2 58.9 0.0 72.1 13.2 Total 795.6 133.4 19.5 929.0 795.6 561.0 94.9 15.8 655.9 576.8
385
Ta r ı m B i l i m l e r i D e r g i s i – J o u r n a l o f A g r i c u l t u r a l S c i e n c e s 21 (2015) 382-393
physiological maturity (I1: No drought stress), while
the experiment group received irrigation only until anthesis (I2: Drought stress after heading).
During the period from anthesis to maturity, the thermal period [i. e. growth degree day [GDD]] was calculated with the following formula (1):
GDD = ΣTd; Td = (Tmax+ Tmin) / 2 – Tb (1) Where; Td, signifies average daily temperature; Tmax, signifies the highest temperature recorded during the day; Tmin, signifies the lowest temperature recorded during the day and Tb signifies the lowest temperature at beginning of growth. In this study, Tb= 0 was assumed (Bauer et al 1985). Anthesis for 50% of the plants during the first growing season began on April 12 and during the second growing season on April 19.
Figure 1(a) shows the change in the thermal period (oC day) and the slope lines during the first
and the second growing seasons, while Figure 1(b) shows those changes from anthesis to maturity. During anthesis, 200 plants (mean stem) were marked in each plot. While analysing the first sample according to Zadoks Growing Scale (ZGS) (Zadoks et al 1974) and considering the grain development period of varieties, samples with ZGS of 65, 71, 80, 85, 88, and 91 were taken during both the years. For each sample, 20 main stems (ms) were cut at soil level, and leaf areas were measured by leaf area meter (Li-3100, LI-COR Biosciences, Lincoln, NE, USA). During the grain maturity period, the amount of grains in each spike, the spike grains number (SGN), single grain weight (SGW), and the spike grain yields (SGY) were calculated.
4
Figure 1- Change of the thermal period (◦C day) and the slope lines during first and second growing
season (a) and from anthesis to maturity (b) in the experiment years.
Şekil 1- Her ikidenemeyılındaekimden tam oluma (a) veçiçeklenmeden tam oluma (b) kadarkisüreçtetermalperiyottaki(oC day)değişimveeğimçizgileri
2.1. Statistical analysis
Data collected from the samples were subjected to separate or combined variance analysis using SPSS (SPSS Inc., Chicago, IL, USA) according to the randomized complete block design. During grain filling, the leaf area was measured at different time points. First, the graphical bent function of the flag and lower leaves was used depending on the course of time to determine the decrease in the green area. This process was practised for testing according to different functional equations (i. e. direct, cubic and quadratic). At the end of the tests, the senescence functional bent was determined by way of a cubic model (f(x) = ax3+
bx2+ cx + d). With this equation, the following parameters of leaf senescence were calculated.
Green Area Duration (GAD): These data were calculated by considering the anthesis (t1) and the time
that the green area became spoiled (t3) according to the bent function for the flag and lower leaves. The
integral of the time interval between them was found by calculating as under: 𝑓𝑓 𝑥𝑥 𝑑𝑑𝑥𝑥 = 𝐹𝐹 𝑐𝑐 − 𝐹𝐹 𝑎𝑎 𝑎𝑎𝑛𝑛𝑑𝑑𝑡𝑡2
𝑡𝑡1 (𝑡𝑡1= 0) → 𝐹𝐹 𝑥𝑥 = 𝐹𝐹(𝑡𝑡3) (2)
𝐹𝐹 𝑥𝑥 = 3𝑎𝑎𝑥𝑥44+ 2𝑏𝑏𝑥𝑥33+ 𝑐𝑐𝑥𝑥22+ 𝑑𝑑𝑥𝑥 (3)
Senescence Period (SP):The senescence period (SP) was calculated according to the number of days from anthesis (t1) to the time when the green area was non-existent (t3).
SP = t3- t1=>SP = t3(t1= 0) (4)
The data obtained were subjected to the variance analysis and means were compared by LSD tests. Additionally, correlation coefficients were determined among the characters studied..
3. Results and Discussion
3.1. The flag and lower leaves areasBoth flag leaf area (FLA) and lower leavesarea (LLA) were found to differ by year. In both the leaf areas, higher values were measured during the first year than in the second year (Table 2) (Figure2). Droughts during the grain filling period in the I2 application did not cause differences in FLA and LLA values
compared to the I1 application.These results in the study of different irrigation practices have been
completed before the commencement of the development stemmed from plant leaves.
y1 = 0.78x + 5.38 R² = 0.52 y2 = 0.11x + 0.68 R² = 0.66 0 5 10 15 20 25 30 35 1 13 25 37 49 61 73 85 97 109 121 133 145 157 169 181 193
First year Second year
Te m peret ur e ( ◦C)
The days from sowing to maturity (a) y1 = 0.18x + 18.09 R² = 0.53 y2 = 0.26x + 14.97 R² = 0.80 0 5 10 15 20 25 30 35 1 4 7 1013161922252831343740434649
First year Second year
Te m per at ure ( ◦C)
The days after anthesis (b)
days
Figure 1- Change of the thermal period (◦C day) and the slope lines during first and second growing season (a) and from anthesis to maturity (b) in the experiment years
Şekil 1- Her iki deneme yılında ekimden tam oluma (a) ve çiçeklenmeden tam oluma (b) kadarki süreçte termal periyottaki (oC day) değişim ve eğim çizgileri
2.1. Statistical analysis
Data collected from the samples were subjected to separate or combined variance analysis using SPSS (SPSS Inc., Chicago, IL, USA) according to the randomized complete block design. During grain filling, the leaf area was measured at different time points. First, the graphical bent function of the flag and lower leaves was used depending on the course of time to determine the decrease in the green area.
This process was practised for testing according to different functional equations (i. e. direct, cubic and quadratic). At the end of the tests, the senescence functional bent was determined by way of a cubic model (f(x) = ax3 + bx2 + cx + d). With this equation, the following parameters of leaf senescence were calculated.
Green Area Duration (GAD): These data were calculated by considering the anthesis (t1) and
Bazı Makarnalık Buğday Genotiplerinde Dane Dolum Dönemindeki Kuraklık Stresinde Bayrak Yaprak Yaşlanması..., Tiryakioğlu
386
Ta r ı m B i l i m l e r i D e r g i s i – J o u r n a l o f A g r i c u l t u r a l S c i e n c e s 21 (2015) 382-393the time that the green area became spoiled (t3) according to the bent function for the flag and lower leaves. The integral of the time interval between them was found by calculating as under:
4
Figure 1- Change of the thermal period (◦C day) and the slope lines during first and second growing
season (a) and from anthesis to maturity (b) in the experiment years.
Şekil 1- Her ikidenemeyılındaekimden tam oluma (a) veçiçeklenmeden tam oluma (b) kadarkisüreçtetermalperiyottaki(oC day)değişimveeğimçizgileri
2.1. Statistical analysis
Data collected from the samples were subjected to separate or combined variance analysis using SPSS (SPSS Inc., Chicago, IL, USA) according to the randomized complete block design. During grain filling, the leaf area was measured at different time points. First, the graphical bent function of the flag and lower leaves was used depending on the course of time to determine the decrease in the green area. This process was practised for testing according to different functional equations (i. e. direct, cubic and quadratic). At the end of the tests, the senescence functional bent was determined by way of a cubic model (f(x) = ax3+
bx2+ cx + d). With this equation, the following parameters of leaf senescence were calculated.
Green Area Duration (GAD): These data were calculated by considering the anthesis (t1) and the time
that the green area became spoiled (t3) according to the bent function for the flag and lower leaves. The
integral of the time interval between them was found by calculating as under: 𝑓𝑓 𝑥𝑥 𝑑𝑑𝑥𝑥 = 𝐹𝐹 𝑐𝑐 − 𝐹𝐹 𝑎𝑎 𝑎𝑎𝑛𝑛𝑑𝑑𝑡𝑡2
𝑡𝑡1 (𝑡𝑡1= 0) → 𝐹𝐹 𝑥𝑥 = 𝐹𝐹(𝑡𝑡3) (2)
𝐹𝐹 𝑥𝑥 = 3𝑎𝑎𝑥𝑥44+ 2𝑏𝑏𝑥𝑥33+ 𝑐𝑐𝑥𝑥22+ 𝑑𝑑𝑥𝑥 (3) Senescence Period (SP):The senescence period (SP) was calculated according to the number of days from anthesis (t1) to the time when the green area was non-existent (t3).
SP = t3- t1=>SP = t3(t1= 0) (4)
The data obtained were subjected to the variance analysis and means were compared by LSD tests. Additionally, correlation coefficients were determined among the characters studied..
3. Results and Discussion
3.1. The flag and lower leaves areas
Both flag leaf area (FLA) and lower leavesarea (LLA) were found to differ by year. In both the leaf areas, higher values were measured during the first year than in the second year (Table 2) (Figure2). Droughts during the grain filling period in the I2 application did not cause differences in FLA and LLA values
compared to the I1 application.These results in the study of different irrigation practices have been
completed before the commencement of the development stemmed from plant leaves.
y1 = 0.78x + 5.38 R² = 0.52 y2 = 0.11x + 0.68 R² = 0.66 0 5 10 15 20 25 30 35 1 13 25 37 49 61 73 85 97 109 121 133 145 157 169 181 193
First year Second year
Te m peret ur e ( ◦C)
The days from sowing to maturity (a) y1 = 0.18x + 18.09 R² = 0.53 y2 = 0.26x + 14.97 R² = 0.80 0 5 10 15 20 25 30 35 1 4 7 1013161922252831343740434649
First year Second year
Te m per at ure ( ◦C)
The days after anthesis (b)
(2)
4
Figure 1- Change of the thermal period (◦C day) and the slope lines during first and second growing
season (a) and from anthesis to maturity (b) in the experiment years.
Şekil 1- Her ikidenemeyılındaekimden tam oluma (a) veçiçeklenmeden tam oluma (b) kadarkisüreçtetermalperiyottaki(oC day)değişimveeğimçizgileri
2.1. Statistical analysis
Data collected from the samples were subjected to separate or combined variance analysis using SPSS (SPSS Inc., Chicago, IL, USA) according to the randomized complete block design. During grain filling, the leaf area was measured at different time points. First, the graphical bent function of the flag and lower leaves was used depending on the course of time to determine the decrease in the green area. This process was practised for testing according to different functional equations (i. e. direct, cubic and quadratic). At the end of the tests, the senescence functional bent was determined by way of a cubic model (f(x) = ax3+
bx2+ cx + d). With this equation, the following parameters of leaf senescence were calculated.
Green Area Duration (GAD): These data were calculated by considering the anthesis (t1) and the time
that the green area became spoiled (t3) according to the bent function for the flag and lower leaves. The
integral of the time interval between them was found by calculating as under: 𝑓𝑓 𝑥𝑥 𝑑𝑑𝑥𝑥 = 𝐹𝐹 𝑐𝑐 − 𝐹𝐹 𝑎𝑎 𝑎𝑎𝑛𝑛𝑑𝑑𝑡𝑡2
𝑡𝑡1 (𝑡𝑡1= 0) → 𝐹𝐹 𝑥𝑥 = 𝐹𝐹(𝑡𝑡3) (2)
𝐹𝐹 𝑥𝑥 = 3𝑎𝑎𝑥𝑥44+ 2𝑏𝑏𝑥𝑥33+ 𝑐𝑐𝑥𝑥22+ 𝑑𝑑𝑥𝑥 (3)
Senescence Period (SP):The senescence period (SP) was calculated according to the number of days from anthesis (t1) to the time when the green area was non-existent (t3).
SP = t3- t1=>SP = t3(t1= 0) (4)
The data obtained were subjected to the variance analysis and means were compared by LSD tests. Additionally, correlation coefficients were determined among the characters studied..
3. Results and Discussion
3.1. The flag and lower leaves areasBoth flag leaf area (FLA) and lower leavesarea (LLA) were found to differ by year. In both the leaf areas, higher values were measured during the first year than in the second year (Table 2) (Figure2). Droughts during the grain filling period in the I2 application did not cause differences in FLA and LLA values
compared to the I1 application.These results in the study of different irrigation practices have been
completed before the commencement of the development stemmed from plant leaves.
y1 = 0.78x + 5.38 R² = 0.52 y2 = 0.11x + 0.68 R² = 0.66 0 5 10 15 20 25 30 35 1 13 25 37 49 61 73 85 97 109 121 133 145 157 169 181 193
First year Second year
Te m peret ur e ( ◦C)
The days from sowing to maturity (a) y1 = 0.18x + 18.09 R² = 0.53 y2 = 0.26x + 14.97 R² = 0.80 0 5 10 15 20 25 30 35 1 4 7 1013161922252831343740434649
First year Second year
Te m per at ure ( ◦C)
The days after anthesis (b)
(3) Senescence Period (SP): The senescence period (SP) was calculated according to the number of days from anthesis (t1) to the time when the green area was non-existent (t3).
4
Figure 1- Change of the thermal period (◦C day) and the slope lines during first and second growing
season (a) and from anthesis to maturity (b) in the experiment years.
Şekil 1- Her ikidenemeyılındaekimden tam oluma (a) veçiçeklenmeden tam oluma (b) kadarkisüreçtetermalperiyottaki(oC day)değişimveeğimçizgileri
2.1. Statistical analysis
Data collected from the samples were subjected to separate or combined variance analysis using SPSS (SPSS Inc., Chicago, IL, USA) according to the randomized complete block design. During grain filling, the leaf area was measured at different time points. First, the graphical bent function of the flag and lower leaves was used depending on the course of time to determine the decrease in the green area. This process was practised for testing according to different functional equations (i. e. direct, cubic and quadratic). At the end of the tests, the senescence functional bent was determined by way of a cubic model (f(x) = ax3+
bx2+ cx + d). With this equation, the following parameters of leaf senescence were calculated.
Green Area Duration (GAD): These data were calculated by considering the anthesis (t1) and the time
that the green area became spoiled (t3) according to the bent function for the flag and lower leaves. The
integral of the time interval between them was found by calculating as under: 𝑓𝑓 𝑥𝑥 𝑑𝑑𝑥𝑥 = 𝐹𝐹 𝑐𝑐 − 𝐹𝐹 𝑎𝑎 𝑎𝑎𝑛𝑛𝑑𝑑𝑡𝑡2
𝑡𝑡1 (𝑡𝑡1= 0) → 𝐹𝐹 𝑥𝑥 = 𝐹𝐹(𝑡𝑡3) (2)
𝐹𝐹 𝑥𝑥 = 3𝑎𝑎𝑥𝑥44+ 2𝑏𝑏𝑥𝑥33+ 𝑐𝑐𝑥𝑥22+ 𝑑𝑑𝑥𝑥 (3)
Senescence Period (SP):The senescence period (SP) was calculated according to the number of days from anthesis (t1) to the time when the green area was non-existent (t3).
SP = t3- t1=>SP = t3(t1= 0) (4)
The data obtained were subjected to the variance analysis and means were compared by LSD tests. Additionally, correlation coefficients were determined among the characters studied..
3. Results and Discussion
3.1. The flag and lower leaves areasBoth flag leaf area (FLA) and lower leavesarea (LLA) were found to differ by year. In both the leaf areas, higher values were measured during the first year than in the second year (Table 2) (Figure2). Droughts during the grain filling period in the I2 application did not cause differences in FLA and LLA values
compared to the I1 application.These results in the study of different irrigation practices have been
completed before the commencement of the development stemmed from plant leaves.
y1 = 0.78x + 5.38 R² = 0.52 y2 = 0.11x + 0.68 R² = 0.66 0 5 10 15 20 25 30 35 1 13 25 37 49 61 73 85 97 109 121 133 145 157 169 181 193
First year Second year
Te m peret ur e ( ◦C)
The days from sowing to maturity (a) y1 = 0.18x + 18.09 R² = 0.53 y2 = 0.26x + 14.97 R² = 0.80 0 5 10 15 20 25 30 35 1 4 7 1013161922252831343740434649
First year Second year
Te m per at ure ( ◦C)
The days after anthesis (b)
(4) The data obtained were subjected to the variance analysis and means were compared by LSD tests. Additionally, correlation coefficients were determined among the characters studied..
3. Results and Discussion
3.1. The flag and lower leaves areasBoth flag leaf area (FLA) and lower leaves area (LLA) were found to differ by year. In both the leaf areas, higher values were measured during the first year than in the second year (Table 2) (Figure 2). Droughts during the grain filling period in the I2 application did not cause differences in FLA and
LLA values compared to the I1 application. These results in the study of different irrigation practices have been completed before the commencement of the development stemmed from plant leaves.
For FLA values, no statistical difference was determined among irrigation activities between years (Table 2), which could derive from maximum FLA, for when FLA took its final form, a different watering technique was not being used and thus all plants grew under similar conditions.
0 10 20 30 Flag lea f a re a (c m 2)
Amanos-97 Ceylan-95 Fırat-93 Gediz-75 Harran-95 Zenit
Amanos-97 Ceylan-95 Fırat-93 Gediz-75 Harran-95 Zenit
a b 0 50 100 150 0 65 15070 27975 40485 47786 54987 63588 650 15071 27981 86.5404 47788 88.5549 63589 Lo w er le av es ar ea ( cm 2) Termal Time (◦C d)
ZGS (Zadoks Growth Scale)
c d
Figure 2- Six durum wheat cultivars grown under two different irrigation regime (I1 and I2), the change of flag leaf area (a- b) and lower leaves area (c-d) senescence from anthesis to maturity in first (a and c) and second (b and d) year
Şekil 2- İki farklı sulama rejminde (I1 ve I2) altı makarnalık buğday çeşidinin çiçeklenmeden oluma kadarki dönemde bayrak yaprak (a-b) ve alt yaprak alanlarındaki (c-d) birinci (a-c) ve ikinci (b-d) yıl değişim seyri
387
Ta r ı m B i l i m l e r i D e r g i s i – J o u r n a l o f A g r i c u l t u r a l S c i e n c e s 21 (2015) 382-393
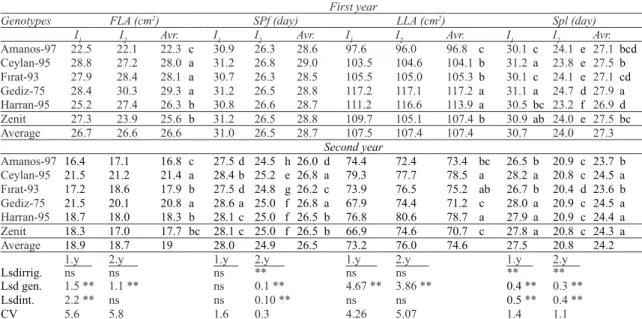
Although the FLA developed differently among the species, three groups could be distinguished over the study period of two years. Ceylan-95 (28.0-21.4 cm2 ms-1) and Gediz-75 (29.3-20.8 cm2 ms-1) had the
highest FLA during both the years, while Amanos-97 (22.3-16.8 cm2 ms-1) had the lowest FLA. The FLA
of Fırat-93 (28.1-17.9 cm2 ms-1) became noticeable
as the cultivar whose FLA fluctuated most.
Genotypic differences similar to FLA were significant regarding LLA, while irrigation and interaction were insignificant (Table 2). LLA values changed from 117.2-96.8 cm2 ms-1 during the
first year to 78.7-70.7 cm2 ms-1 during the second
year. The highest LLA value was obtained from Gediz-75 and Harran-95 during the first year and from Harran-95 and Ceylan-95 during the second year. The lowest LLA value appeared in Amanos-97 (96.8 cm2 ms-1) during the first year and in Zenit
and Gediz-75 during the second year. No significant differences occurred among irrigation regimes, for they ceased after LLA had reached its maximum. 3.2. Senescence period in the flag and lower leaves The flag leaf senescence period (SPf) lasted longer during the first year (28.7 days) than during the second year (26.5 days) (Table 2). The difference between the years varied according to drought stress (I1) and the non-existence of drought stress (I2). The senescence period for the I2 group decreased during
both the years compared to the I1 group. During the
first year, the decrease occurred at a rate of 14.5%, while it decreased during the second year at 11.1%.
SPf occurred at nearly the same time in all
samples, though during the second year differences were statistically significant (Table 2).
Table 2- Six durum wheat cultivars grown under two different irrigation regime (I1 and I2) average values of the flag leaf area, lower leaves area and senescence period from anthesis to maturity in first and second year and according to the comparison groups of LSD test
Çizelge 2- İki farklı sulama rejminde (I1 ve I2) yetiştirilen altı adet makarnalık buğday çeşidinde çiçeklenmeden ölüme kadarki dönemde bayrak yaprak alanı, alt yapraklar alanı ve yaşlanma sürelerine ait ortalama değerler ve LDS karşılaştırma testine göre oluşan gruplar
First year
Genotypes FLA (cm2) SPf (day) LLA (cm2) Spl (day)
I1 I2 Avr. I1 I2 Avr. I1 I2 Avr. I1 I2 Avr.
Amanos-97 22.5 22.1 22.3 c 30.9 26.3 28.6 97.6 96.0 96.8 c 30.1 c 24.1 e 27.1bcd Ceylan-95 28.8 27.2 28.0 a 31.2 26.8 29.0 103.5 104.6 104.1b 31.2 a 23.8 e 27.5b Fırat-93 27.9 28.4 28.1 a 30.7 26.3 28.5 105.5 105.0 105.3b 30.1 c 24.1 e 27.1cd Gediz-75 28.4 30.3 29.3 a 31.2 26.5 28.8 117.2 117.1 117.2a 31.1 a 24.7 d 27.9a Harran-95 25.2 27.4 26.3 b 30.8 26.6 28.7 111.2 116.6 113.9a 30.5 bc 23.2 f 26.9d Zenit 27.3 23.9 25.6 b 31.2 26.5 28.8 109.7 105.1 107.4b 30.9 ab 24.0 e 27.5bc Average 26.7 26.6 26.6 31.0 26.5 28.7 107.5 107.4 107.4 30.7 24.0 27.3 Second year Amanos-97 16.4 17.1 16.8 c 27.5 d 24.5 h 26.0 d 74.4 72.4 73.4 bc 26.5 b 20.9 c 23.7 b Ceylan-95 21.5 21.2 21.4 a 28.4 b 25.2 e 26.8 a 79.3 77.7 78.5 a 28.2 a 20.8 c 24.5 a Fırat-93 17.2 18.6 17.9 b 27.5 d 24.8 g 26.2 c 73.9 76.5 75.2 ab 26.7 b 20.4 d 23.6 b Gediz-75 21.5 20.1 20.8 a 28.6 a 25.0 f 26.8 a 67.9 74.4 71.2 c 28.0 a 20.9 c 24.5 a Harran-95 18.7 18.0 18.3 b 28.1 c 25.0 f 26.5 b 76.8 80.6 78.7 a 27.9 a 20.9 c 24.4 a Zenit 18.3 17.0 17.7 bc 28.1 c 25.0 f 26.5 b 66.9 74.6 70.7 c 27.8 a 20.8 c 24.3 a Average 18.9 18.7 19 28.0 24.9 26.5 73.2 76.0 74.6 27.5 20.8 24.2
1.y 2.y 1.y 2.y 1.y 2.y 1.y 2.y
Lsdirrig. ns ns ns ** ns ns ** **
Lsd gen. 1.5 ** 1.1 ** ns 0.1 ** 4.67 ** 3.86 ** 0.4 ** 0.3 **
Lsdint. 2.2 ** ns ns 0.10 ** ns ns 0.5 ** 0.4 **
CV 5.6 5.8 1.6 0.3 4.26 5.07 1.4 1.1
**, P<0.01; *, P<0.05; ns, non significiant; FLA, flag leaf area (cm2 ms-1); LLA, lower leaves area (cm2 ms-1); SP
f, senescence period of flag leaf (day); SPl, senescence period of lower leaves (day).
Bazı Makarnalık Buğday Genotiplerinde Dane Dolum Dönemindeki Kuraklık Stresinde Bayrak Yaprak Yaşlanması..., Tiryakioğlu
388
Ta r ı m B i l i m l e r i D e r g i s i – J o u r n a l o f A g r i c u l t u r a l S c i e n c e s 21 (2015) 382-393SP for the lower leaves (SPl) was negatively
affected due to drought stress that occurred after anthesis and decreased at the rate of 21.8% during the first year and 24.4% during the second year, depending on the severity of drought stress. Although the decrease in SPf occurred at similar
rates during both the years, in SPl the decrease
occurred at a higher rate during the first year than during the second. This difference may have been caused by early higher temperatures during GFD (Figure 1). It was noticeable that the lower leaves had been negatively affected regarding flag leaf after high temperatures occurred during the first year.
The response of the genotypes to SPl was different
for each year. During the first year, the highest value was obtained from Gediz-75 (27.9 days), while the
lowest was obtained from Harran-95 (26.9 days). Gediz-75 and Ceylan-95 had the highest value and Fırat-93 the lowest during the second year.
3.3. Flag and lower leaves area duration
The flag leaf area duration (FLAD) and lower leaves area duration (LLAD) both resulted from the areas being continually photosynthetically active. FLAD and LLAD were studied in three phases of 10 days each from the beginning of anthesis, though the third phase was generally shorter than 10 days.
During the first year, under I1 conditions FL
senescence ranged from 31.0 to 30.7 days, hence, the change in the FLAD and its relation to grain yield (Table 3).
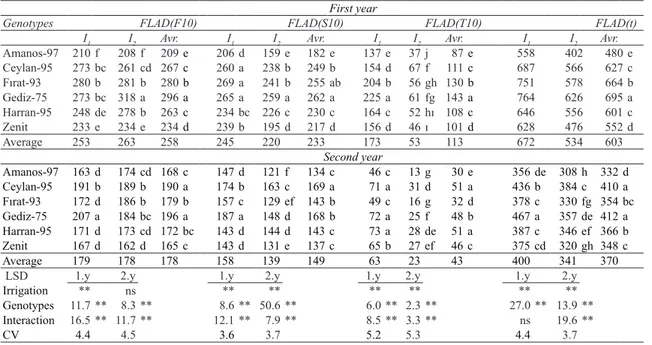
Table 3- Average values six durum wheat cultivars grown under two different irrigation regime (I1 and I2) for the flag leaf area duration from anthesis to maturity in first and second year and according to the comparison groups of LSD test (FLAD(F10), over this period is the first ten days of flag leaf area duration;
FLAD(S10), over this period is the second ten days of flag leaf area duration; FLAD(T10), over this period is the
third ten days of flag leaf area duration; FLAD(t), total flag leaf area duration (cm2 d))
Çizelge 3- İki farklı sulama rejminde (I1 ve I2) yetiştirilen altı adet makarnalık buğday çeşidinde çiçeklenmeden ölüme kadarki dönemde her iki yıldaki bayrak yaprak alan sürekliliği ve LSD karşılaştırma testine göre oluşan gruplar
First year
Genotypes FLAD(F10) FLAD(S10) FLAD(T10) FLAD(t)
I1 I2 Avr. I1 I2 Avr. I1 I2 Avr. I1 I2 Avr.
Amanos-97 210 f 208 f 209e 206 d 159 e 182 e 137 e 37 j 87e 558 402 480 e Ceylan-95 273 bc 261 cd 267c 260 a 238 b 249 b 154 d 67 f 111c 687 566 627 c Fırat-93 280 b 281 b 280b 269 a 241 b 255 ab 204 b 56 gh 130b 751 578 664 b Gediz-75 273 bc 318 a 296a 265 a 259 a 262 a 225 a 61 fg 143a 764 626 695 a Harran-95 248 de 278 b 263c 234 bc 226 c 230 c 164 c 52 hı 108c 646 556 601 c Zenit 233 e 234 e 234d 239 b 195 d 217 d 156 d 46 ı 101d 628 476 552 d Average 253 263 258 245 220 233 173 53 113 672 534 603 Second year Amanos-97 163 d 174 cd 168 c 147 d 121 f 134 c 46 c 13 g 30 e 356 de 308 h 332 d Ceylan-95 191 b 189 b 190 a 174 b 163 c 169 a 71 a 31 d 51 a 436 b 384 c 410 a Fırat-93 172 d 186 b 179 b 157 c 129 ef 143 b 49 c 16 g 32 d 378 c 330 fg 354 bc Gediz-75 207 a 184 bc 196 a 187 a 148 d 168 b 72 a 25 f 48 b 467 a 357 de 412 a Harran-95 171 d 173 cd 172 bc 143 d 144 d 143 c 73 a 28 de 51 a 387 c 346 ef 366 b Zenit 167 d 162 d 165 c 143 d 131 e 137 c 65 b 27 ef 46 c 375 cd 320 gh 348 c Average 179 178 178 158 139 149 63 23 43 400 341 370
LSD 1.y 2.y 1.y 2.y 1.y 2.y 1.y 2.y
Irrigation ** ns ** ** ** ** ** **
Genotypes 11.7 ** 8.3 ** 8.6 ** 50.6 ** 6.0 ** 2.3 ** 27.0 ** 13.9 **
Interaction 16.5 ** 11.7 ** 12.1 ** 7.9 ** 8.5 ** 3.3 ** ns 19.6 **
CV 4.4 4.5 3.6 3.7 5.2 5.3 4.4 3.7
389
Ta r ı m B i l i m l e r i D e r g i s i – J o u r n a l o f A g r i c u l t u r a l S c i e n c e s 21 (2015) 382-393
FLAD values and their interactions in both I1
and I2 irrigated conditions (except during 10 days
during the second year) were statistically significant (Table 3).
Among the cultivars, the highest value of total flag leaf area duration (FLAD(t)) occurred in Gediz-75 (695 cm2 ms-1) during the first year and
in Gediz-75 (412 cm2 ms-1) and Ceylan-95 (40 cm2
ms-1) during the second year. The lowest value for
both years occurred in Amanos-97 (480 - 332 cm2
ms-1) (Table 3). The FLA values of the cultivars
were more often determinants on FLAD(t) than their
senescence.
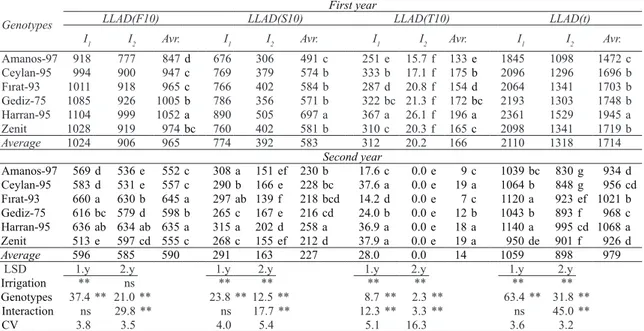
The difference between I1 LLAD and I2 LLAD
values increased from anthesis to maturity and differed in value depending on I1 and I2 conditions.
The values of I2 conditions compared to I1 conditions
decreased at the rate of 7.90, 47.84, and 94.12% for first, second and third period, respectively, and the total decrease was 27.97% (Table 4).
Cultivar Harran-95 showed the highest total lower leaves area duration (LLAD(t)) during both the years, while Amanos-97 showed the lowest value during the first year and both Zenit and Amanos-97 during the second. Drought stress occurring during GFD similarly and negatively affected the LLAD of all genotypes in both the years (Table 4).
FLAD and LLAD were mainly mediated by the size of LA and was independent to change in irrigation types (Tables 3 and 4). The relations between LA and LAD were mainly determined by senescence.
Table 4- Six durum wheat cultivars grown under two different irrigation regime (I1 and I2) average values of the lower leaves area duration from anthesis to maturity in first and second year and according to the comparison groups of LSD test (LLAD(F10), over this period is the first ten days of lower leaves area duration; LLAD(S10), over this period is the second ten days of lower leaves area duration; LLAD(T10), over this period is the third ten days of lower leaves area duration; LLAD(t), total lower leaves area duration (cm2 day-1))
Çizelge 4- İki farklı sulama rejminde (I1 ve I2) yetiştirilen altı adet makarnalık buğday çeşidinde çiçeklenmeden ölüme kadarki dönemde her iki yıldaki alt yaprak alan sürekliliği ve LSD karşılaştırma testine göre oluşan gruplar
Genotypes
First year
LLAD(F10) LLAD(S10) LLAD(T10) LLAD(t)
I1 I2 Avr. I1 I2 Avr. I1 I2 Avr. I1 I2 Avr.
Amanos-97 918 777 847d 676 306 491 c 251 e 15.7 f 133e 1845 1098 1472 c Ceylan-95 994 900 947c 769 379 574 b 333 b 17.1 f 175b 2096 1296 1696 b Fırat-93 1011 918 965c 766 402 584 b 287 d 20.8 f 154d 2064 1341 1703 b Gediz-75 1085 926 1005b 786 356 571 b 322 bc 21.3 f 172bc 2193 1303 1748 b Harran-95 1104 999 1052a 890 505 697 a 367 a 26.1 f 196a 2361 1529 1945 a Zenit 1028 919 974bc 760 402 581 b 310 c 20.3 f 165c 2098 1341 1719 b Average 1024 906 965 774 392 583 312 20.2 166 2110 1318 1714 Second year Amanos-97 569 d 536 e 552 c 308 a 151 ef 230 b 17.6 c 0.0 e 9 c 1039 bc 830 g 934 d Ceylan-95 583 d 531 e 557 c 290 b 166 e 228 bc 37.6 a 0.0 e 19 a 1064 b 848 g 956 cd Fırat-93 660 a 630 b 645 a 297 ab 139 f 218 bcd 14.2 d 0.0 e 7 c 1120 a 923 ef 1021 b Gediz-75 616 bc 579 d 598 b 265 c 167 e 216 cd 24.0 b 0.0 e 12 b 1043 b 893 f 968 c Harran-95 636 ab 634 ab 635 a 315 a 202 d 258 a 36.9 a 0.0 e 18 a 1140 a 995 cd 1068 a Zenit 513 e 597 cd 555 c 268 c 155 ef 212 d 37.9 a 0.0 e 19 a 950 de 901 f 926 d Average 596 585 590 291 163 227 28.0 0.0 14 1059 898 979
LSD 1.y 2.y 1.y 2.y 1.y 2.y 1.y 2.y
Irrigation ** ns ** ** ** ** ** **
Genotypes 37.4 ** 21.0 ** 23.8 ** 12.5 ** 8.7 ** 2.3 ** 63.4 ** 31.8 **
Interaction ns 29.8 ** ns 17.7 ** 12.3 ** 3.3 ** ns 45.0 **
CV 3.8 3.5 4.0 5.4 5.1 16.3 3.6 3.2
Bazı Makarnalık Buğday Genotiplerinde Dane Dolum Dönemindeki Kuraklık Stresinde Bayrak Yaprak Yaşlanması..., Tiryakioğlu
390
Ta r ı m B i l i m l e r i D e r g i s i – J o u r n a l o f A g r i c u l t u r a l S c i e n c e s 21 (2015) 382-393Flag leaf senescence has started immediately after anthesis in grain filling duration. However, in the course of senescence, particularly in controlled conditions, startup has been very slow, after the twentieth day of the period of grain filling was accelerated. In drought conditions, especially in the first year, mainly from anthesis leaf senescence has developed faster than control. Guóth et al (2009) in their study of wheat, the early drought reduces leaf water potential and that this reduction occurs faster than those who reported that tolerant. Borerell et al (2000) in their study sorghum, grain filling period of drought control in the leaves have reported accelerated aging. The findings from both studies, this study is associated with the findings. Leaf water potential is low, increases the concentrations of ABA in leaves (Yang et al 2003; Yang & Zhang 2006; Guóth et al 2009). Accordingly, a reduction in chlorophyll content (Calderini et al 2001; Yang et al 2001; Yang et al 2003; Yang & Zhang 2006) and consequently becomes fall occurs in photosynthetic activity (Shah & Poulsen 2003; Yang & Zhang 2006; Guóth et al 2009). Increased concentration of ABA in leaves to pieces TNC also leads to deflection of the leaf tissue (Yang et al 2003; Yang & Zhang
2006). Senescence is accelerated due to this process experienced (Yang & Zhang 2006).
Aging has developed faster than the flag leaf in lower leaves. One of the reasons that the lower leaves before the flag leaf is formed due to the older leaves. Another reason, the lower leaves obscured by the flag leaf and still compete in terms of lower leaves is the presence of light in themselves (Hopkins 1966).
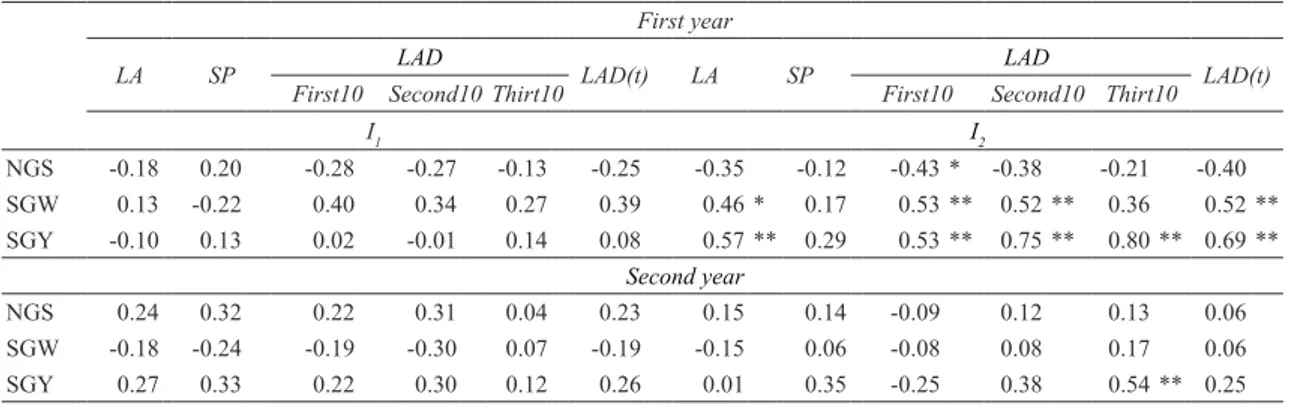
There were no significant relationships between FL and SGY under well-irrigated conditions. However, significant relationships were found during the first year in samples under water-stressed conditions, though during the second year slight relationships were observable only during the second phase (Table 5).
The relationship between FLADt and SGY was similar to the relationship between FLA and SGY. There was no significant relationship between FLAD and SGY during any of the 10-day phases under well-irrigated conditions, while significant relationships between FLAD and SGY emerged under water-stressed conditions and increased until late grain filling. Several studies have reported relationships between FLAD and grain yield, though
Table 5- Relationship between flag leaf area duration and the grain yield parameters of durum wheat cultivars grown under two different irrigation regime (I1 and I2), in first and second year (LA, Leaf area; SP, senescence period; LAD, flag leaf area duration; LAD(t), total lower leaves are duration; NGS, number grain in spike; SGW, single grain weight; SGY, spike grain yield; F10, first ten days; S10, second ten days; T10, third ten days)
Çizelge 5- İki farklı sulama rejminde (I1 ve I2) iki yıl süreyle yetiştirilen makarnalık buğdaylarda bayrak yaprak alan sürekliliği ile dane verimi ve parametreleri arasındaki ilişki
First year
LA SP LAD LAD(t) LA SP LAD LAD(t)
First10 Second10 Thirt10 First10 Second10 Thirt10
I1 I2 NGS -0.18 0.20 -0.28 -0.27 -0.13 -0.25 -0.35 -0.12 -0.43 * -0.38 -0.21 -0.40 SGW 0.13 -0.22 0.40 0.34 0.27 0.39 0.46 * 0.17 0.53 ** 0.52 ** 0.36 0.52 ** SGY -0.10 0.13 0.02 -0.01 0.14 0.08 0.57 ** 0.29 0.53 ** 0.75 ** 0.80 ** 0.69 ** Second year NGS 0.24 0.32 0.22 0.31 0.04 0.23 0.15 0.14 -0.09 0.12 0.13 0.06 SGW -0.18 -0.24 -0.19 -0.30 0.07 -0.19 -0.15 0.06 -0.08 0.08 0.17 0.06 SGY 0.27 0.33 0.22 0.30 0.12 0.26 0.01 0.35 -0.25 0.38 0.54 ** 0.25
391
Ta r ı m B i l i m l e r i D e r g i s i – J o u r n a l o f A g r i c u l t u r a l S c i e n c e s 21 (2015) 382-393
their results often differ. While some studies have reported a significant relationship between FLAD and grain yield (Fischer & Kohn 1966; Mohiuddin & Croy 1980; Gelang et al 2000; Blake et al 2007), other studies have found the relationships to be insignificant (Devendra et al 1983; Miralles & Slafer 1995). The relationships between FLAD values for each phase and SGY showed increases near the end of grain filling, though increases depended on a high R2 coefficient. In short, SGY increased with delayed
senescence.
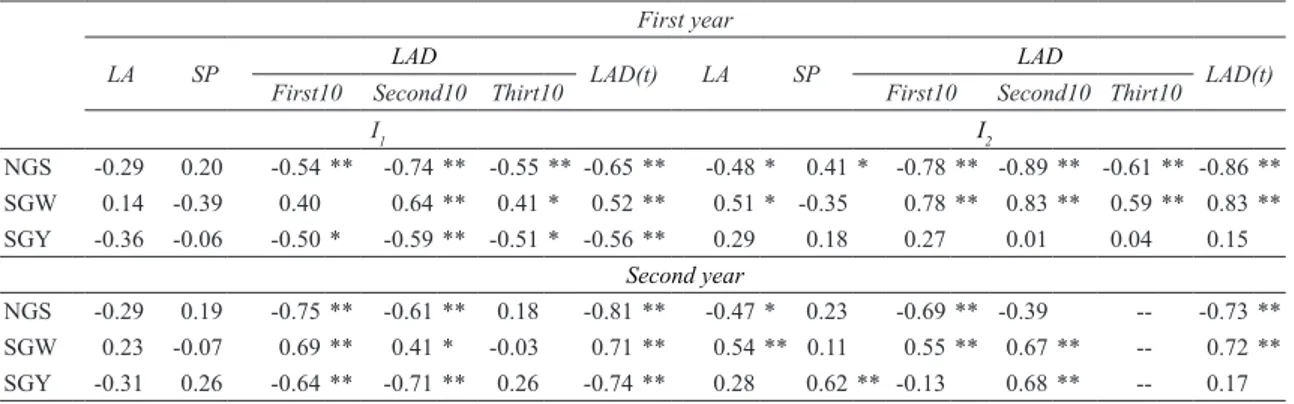
The increase at LLA negatively affected SGY under well-irrigated conditions, though a positive interaction existed under water-stressed conditions, suggesting a slight contribution of LLs to grain yield when grain filling occurred under water-stressed conditions (Table 6).
High LLADt under well-irrigated conditions
negatively impacted SGY, especially during the late grain filling period (Table 6). Slight relationships between LLADt and LLAD with SGY during each phase under water-stressed conditions suggested that the stay-green period of LLA could contribute to grain yield.
This study also observed that SGY was high in genotypes with high FLAD under water-stressed conditions. The genotypes of Gediz-75 and Ceylan-95 exhibited high FLDA and SGY, while Amanos-97 exhibited the lowest values for FLDA and SGY. Meanwhile, Harran-95 exhibited the highest SGY under water-stressed conditions during the second year-a finding supported by FLAD and high LLAD during the first 20 days after anthesis.
4. Conclusions
It was also observed that the effects of FLA and FLAD on SGY were positive but insignificant when drought stress was not a problem in WANA’s agro-climatic conditions, in which temperature rose and rainfall decreased between the heading and physiological maturity of wheat. However, SGY was negatively affected by increases in LLA and LLAD (Table 6). In the case of drought stress during grain filling, high FLA positively contributed to SGY, and moreover, long stay-green periods for FL showed a significant role on SGY, while LL showed no contribution. Furthermore, significant differences were observed among genotypes for
Table 6- Six durum wheat cultivars grown under two different irrigation regime (I1 and I2), the relationship between lower leaves area duration and the grain yield in first and second year (LA, Leaf area; SP, senescence period; LAD, lower leaves area duration; LAD(t), total lower leaves are duration; NGS, number grain in spike; SGW, single grain weight; SGY, spike grain yield; F10, first ten days; S10, second ten days; T10, third ten days)
Çizelge 6- İki farklı sulama rejminde (I1 ve I2) iki yıl süreyle yetiştirilen makarnalık buğdaylarda alt yaprak alan sürekliliği ile dane verimi ve parametreleri arasındaki ilişki
First year
LA SP LAD LAD(t) LA SP LAD LAD(t)
First10 Second10 Thirt10 First10 Second10 Thirt10
I1 I2 NGS -0.29 0.20 -0.54 ** -0.74 ** -0.55 ** -0.65 ** -0.48 * 0.41 * -0.78 ** -0.89 ** -0.61 ** -0.86 ** SGW 0.14 -0.39 0.40 0.64 ** 0.41 * 0.52 ** 0.51 * -0.35 0.78 ** 0.83 ** 0.59 ** 0.83 ** SGY -0.36 -0.06 -0.50 * -0.59 ** -0.51 * -0.56 ** 0.29 0.18 0.27 0.01 0.04 0.15 Second year NGS -0.29 0.19 -0.75 ** -0.61 ** 0.18 -0.81 ** -0.47 * 0.23 -0.69 ** -0.39 -- -0.73 ** SGW 0.23 -0.07 0.69 ** 0.41 * -0.03 0.71 ** 0.54 ** 0.11 0.55 ** 0.67 ** -- 0.72 ** SGY -0.31 0.26 -0.64 ** -0.71 ** 0.26 -0.74 ** 0.28 0.62 ** -0.13 0.68 ** -- 0.17 **, P<0.01; *, P<0.05
Bazı Makarnalık Buğday Genotiplerinde Dane Dolum Dönemindeki Kuraklık Stresinde Bayrak Yaprak Yaşlanması..., Tiryakioğlu
392
Ta r ı m B i l i m l e r i D e r g i s i – J o u r n a l o f A g r i c u l t u r a l S c i e n c e s 21 (2015) 382-393FLAD and LLAD; the genotypes with high FLAD were benefitted by high SGY. The contribution of LLAD to SGY changed according to year and was not as important as FLAD on genotypes. These results suggest that the genotypes with low leaf number or short plant height and low tillering capacity should receive significant irrigation, while genotypes with middling plant height should be planted during conditions of drought stress. Under both the sets of conditions genotypes must have high FLAD. FLAD must thus be taken into account when obtaining highly adapted genotypes (Gediz-75 and Ceylan-95) during the breeding process under WANA (West Asia North Africa)’s agro-climatic conditions.
References
Bauer A, Frank A B & Black A L (1985). Estimation of spring wheat grain dry matter assimilation from air temperature. Agronomy Journal 77: 743-752
Blake N K, Lanning S P, Martin J M, Sherman J D & Talbert L E (2007). Relationship of flag leaf characteristics to economically important traits in two spring wheat crosses. Crop Science 47: 491-496 Blum A (1998). Improving wheat grain filling under stress
by stem reserve mobilization. Euphytica 100: 77-83 Borras L, Maddonnı G A & Otegui M E (2003). Leaf
senescence in maize hybrids: Plant population, row spacing and kernel set effects. Field Crops Research 54: 1-14
Borrell A K, Hammer G L & Douglas C L (2000). Does maintaining green leaf area in sorghum improve yield under drought? I. Leaf growth and senescence. Crop
Science 40: 1026-1037
Calderini D F, Savin R, Abeledo L G, Reynolds M P & Slafer G A (2001). The importance of the period immediately anthesis for grain weight determination in wheat. Euphytica 199: 199-204
Devendra R, Urs Y S V, Kumar M U & Sastry K S K (1983). Leaf area duration and its relantionship to productivity in early cultivars of rice. Proceedings of
the National Academy of Sciences 49: 692-696
Dokuyucu T, Akkaya A, İspir B & Cesurer L (1996). Flag leaf area and duration, phonological stages and their relation to grain yield and some durum wheat (T.
Durum Desf.) varieties in Kahramanmaraş conditions.
5th International Wheat Conference, June 10-14,
Ankara,Turkey, pp. 1-18
Entz M H & Flowler D B (1990). Differantial agronomic response of winter wheat cultivars to parenthesis environmental stresses. Crop Science 30: 119-1123 Finnan J M, Jones M B & Burke J I (1998). A
time-concentration study on the effects of ozone on spring wheat (Triticum aestivum L.). 3. Effects on leaf and flag leaf senescence. Agricultural Ecosystem and
Environment 69: 27-35
Fischer R A & Khan G D (1966). The relationship of grain yied to vegetative growth and postflowering leaf area in the wheat crop under conditions of limited soil moisture. Australian Journal of Agricultural Research 17(3): 281-295
Gelang J, Pleıjel H, Sild E, Danıelsson H, Younis S & Sellden G (2000). Rate and duration of grain filling in relation to flag leaf senescence and grain yield in spring wheat (Triticum aestivum L.) exposed to different concentrations of ozone. Physiologia
Plantarum 110: 366-375
Guóth A, Tari I, Gallé Á, Csiszár J, Pécsváradi A, Cseuz L & Erdei L (2009). Comparison of the drought stress responses of tolerant and sensitive wheat cultivars during grain filling: changes in flag leaf photosynthetic activity, ABA levels, and grain yield. Journal of Plant
Growth Regulation 28(2): 167-176
Hopkins J M (1966). Studies on the expansion of the leaf surface: VI. Senescence and the usefulness of old leaves. Journal of Experimental Botany 17(4): 762-770
Koç M & Barutçular C (2000). Relationship between leaf area ındex at anthesis and yield in wheat under .ukurova conditions. Turkish Journal of Agriculture
and Forestry 24: 585-593
Koç M, Yazar A, Barutcular C, Tiryakioğlu M, Sezen & M Kılınç M (2002). Kaliteli makarnalık buğday üretiminin geliştirilmesinde GAP bölgesi
potansiyelini değerlendirebilme olanaklarının
araştırılması. TÜBİTAK Projesi Sonuç Raporu. Proje No: TOGTAV/TARP-1934
Miralles D J & Slafer G A (1995). Individual grain weight responses to genetic reduction in clum length in wheat as affected by source-sink manipulations. Field Crops
Research 43: 55-66
Mohiuddin S H & Croy L I (1980). Flag leaf and peduncle area duration in relation to winter wheat grain yield.
393
Ta r ı m B i l i m l e r i D e r g i s i – J o u r n a l o f A g r i c u l t u r a l S c i e n c e s 21 (2015) 382-393
Öztürk A (1999). The effect of drought on the growth and yield of winter wheat. Turkish Journal of Agriculture
and Forestry 23: 531-540
Royo C, Aparicio N, Blanco R & Villegas D (2004). Leaf green area development of durum wheat genotypes grown under Mediterranean conditions. European
Journal of Agronomy 20: 419-430
Sahah N H & Paulsen G M (2003). Interaction of drought and high temperature on photosnythesis and grain-filling of wheat. Plant and Soil 257: 219-26
Valentinuz O R & Tollenaar M (2004). Vertical profile of leaf senescence during the grain-filing period in older and newer maize hybrids. Crop Science 44: 827-34
Yang J C, Zhang H J, Wang Q, Zhu Q S & Wang W (2001). Remobilization of carbon reserves in response to water deficit during grain filling of rice. Field Crops
Resarch 71: 47-55
Yang J C, Zhang H J, Wang Q, Zhu Q S & Lıu L J (2003). Involvement of Abscisic Acid and Cytokinins in the senescence and remobilization of carbon reserves in wheat subjected to water stress during grain filling plant. Cell and Environment 26: 1621–1631
Zadoks J C, Chang T T & Konzak C F (1974). A decimal code for the growth stage of cereals. Weed Research 14: 415–421