Diagnostic value of diffusion weighted MRI and ADC in differential diagnosis of
cavernous hemangioma of the liver.
Ozlem Tokgoz1, Ebru Unlu2, Ilker Unal3, Ismail Serifoglu4, Ilker Oz4, Elif Aktas1, Emrah Caglar4
1. Ankara Oncology Training and Research Hospital, Department of Radiology, Ankara/Turkey 2. Afyon Kocatepe University, School of Medicine, Department of Radiology, Afyon,
3. Cukurova University, School of Medicine, Department of Biostatistics, Adana,
4. Bulent Ecevit University, School of Medicine, Department of Radiology, Zonguldak, Turkey Abstract
Aims: To investigate the use of diffusion weighted magnetic resonance imaging (DWI) and the apparent diffusion coeffi-cient (ADC) values in the diagnosis of hemangioma.
Materials and methods: The study population consisted of 72 patients with liver masses larger than 1 cm (72 focal lesions). DWI examination with a b value of 600 s/mm2 was carried out for all patients. After DWI examination, an ADC map was created and ADC values were measured for 72 liver masses and normal liver tissue (control group). The average ADC values of normal liver tissue and focal liver lesions, the “cut-off ” ADC values, and the diagnostic sensitivity and specificity of the ADC map in diagnosing hemangioma, benign and malignant lesions were researched.
Results: Of the 72 liver masses, 51 were benign and 21 were malignant. Benign lesions comprised 38 hemangiomas and 13 simple cysts. Malignant lesions comprised 9 hepatocellular carcinomas, and 12 metastases. The highest ADC values were measured for cysts (3.782±0.53×10⁻³ mm2/s) and hemangiomas (2.705±0.63×10⁻³ mm2/s). The average ADC value of he-mangiomas was significantly higher than malignant lesions and the normal control group (p<0.001). The average ADC value of cysts were significantly higher when compared to hemangiomas and normal control group (p<0.001). To distinguish hemangiomas from malignant liver lesions, the “cut-off ” ADC value of 1.800×10⁻³ mm2/s had a sensitivity of 97.4% and a specificity of 90.9%. To distinguish hemangioma from normal liver parenchyma the “cut-off ” value of 1.858×10⁻³ mm2/s had a sensitivity of 97.4% and a specificity of 95.7%. To distinguish benign liver lesions from malignant liver lesions the “cut-off ” value of 1.800×10⁻³ mm2/s had a sensitivity of 96.1% and a specificity of 90.0%.
Conclusion: DWI and quantitative measurement of ADC values can be used in differential diagnosis of benign and ma-lignant liver lesions and also in the diagnosis and differentiation of hemangiomas. When dynamic examination cannot dis-tinguish cases with vascular metastasis and lesions from hemangioma, DWI and ADC values can be useful in the primary diagnosis and differential diagnosis. The technique does not require contrast material, so it can safely be used in patients with renal failure .
Keywords: Liver, diffusion weighted magnetic resonance imaging, apparent diffusion coefficient, hemangioma. DOI: http://dx.doi.org/10.4314/ahs.v16i1.30
Cite as: Tokgoz O, Unlu E, Unal I, Serifoglu I, Oz I, Aktas E, Caglar E. Diagnostic value of diffusion weighted MRI and ADC in
dif-ferential diagnosis of cavernous hemangioma of the liver. Afri Health Sci. 2016;16(1): 227-233. http://dx.doi.org/10.4314/ahs.v16i1.30 Introduction
Diffusion weighted magnetic resonance imaging (DWI) measures the random movement of water molecules in the tissues. The amount of diffusion determines the diffusion coefficient. When measuring the diffusion
co-efficient, it can be affected by the heat of the tissue, mi-crocirculation, perfusion, magnetic susceptibility or any type of movement, so, in clinical practice to measure diffusion, the apparent diffusion coefficient (ADC) is used1,2. DWI is a technique that can be obtained within the time of a single held breath, without requiring con-trast material and was originally used in neuroradiology for early diagnosis of stroke3-5. In the literature, there have been published papers on the application of DWI to abdominal organs6-13.
These studies calculated the apparent diffusion coeffi-cient of tissue and lesions from diffusion weighted im-ages and have shown that the technique could be used Corresponding author:
Ozlem Tokgoz,
Ankara Oncology Training and Research Hospital,
Department of Radiology, Ankara/Turkey Tel: 0-312-2613129
for the differential diagnosis. Quantitative evaluations were made on images showing the amount of diffusion of water molecules called ADC maps. ADC combines the effects of capillary perfusion and water diffusion in extracellular and extravascular intervals14. As with solid lesions and abscess, while the cell density in the lesion increases, the diffusion becomes limited; so, cellular lesions on DWI with high b values (a factor indicat-ing MR gradient strength and duration) (b=400-1000 s/mm2) gain a hyperintense signal property; showing low numeric values on the ADC map. As cell density decreases, such as in cysts, hemangiomas and necrot-ic lesions, diffusion is fast and high ADC values were found. Using high “b” values, DWI only reflects dif-fusion, however, low “b” value DWI is comprised of both diffusion and perfusion components15.
The aim of this study was to research the use of DWI and ADC values in the diagnosis of hemangioma; the most frequently observed benign tumor of the liver, and in its differentiation from other benign and malig-nant lesions.
Materials and methods
This study was planned prospectively. Ethics committee approval was obtained. The study population comprised 72 patients with liver masses larger than 1 cm (focal lesions). Patients with chronic liver disease caused by pathological situations other than viral hepatitis, alcohol and steatosis, biliary obstruction and metabolic causes were excluded. Patients with poor general condition, patients over the age of 70, patients without respiratory cooperation, and cases with prosthesis, implants or car-diac pacemakers were not included in the study. In ad-dition, small-sized (less than 1 cm) lesions with difficult locations (proximity to subdiaphragmatic,subcapsular and falciform ligaments) were also excluded from the study because of difficulty in ADC measurements. Diagnosis of hemangioma and other benign liver le-sions were based on previous characteristic computer tomography and/or dynamic liver magnetic resonance imaging results. No changes in size during 6 months of follow up was regarded as hemangiomas or benign liv-er lesions. A typical hemangiomas wliv-ere not included in the study. Cases with malignant lesions or without char-acteristic imaging results were confirmed using biopsy and histopathological results.
A 1.5 Tesla superconducting MR scanner (Intera, Master Gyroscan, Philips Medical Systems, the
Neth-erlands) was used for imaging, which was performed without any need for sedation, in a supine position with a 4 channel sense body coil over the liver. Before DWI measurement, coronal localized and T2A axial imag-es were obtained. DWI imagimag-es directed at the upper abdomen were taken in all patients and control group subjects. As a control group, ADC measurements were done from normal liver parenchyma of 72 cases. The measurements were taken from parenchyma areas at least 1 cm away from the capsule and not crossing ma-jor vascular structures as far as possible. By selecting TR 1523 ms, TE 60 ms, FOV 375 mm, matrix 512×512, NEX 4 in the single shot, spin echo, echo planar (SS-SE-EP) DWI, images with b=0.600 s/mm2 values were obtained.
Diffusion weighted images with a “b” value of 600 s/mm2 were transferred to an independent work sta-tion (Extended MR Workspace, version 7.1.5.1, Philips Medical Systems) for processing and ADC maps were created. ADC values of lesions and normal liver pa-renchyma (control group) were measured by an expe-rienced radiologist from these maps. The study was planned as a uni-center study and all the measurements were done by the same radiologist (O.T.). The radiolo-gist (O.T.) who measured the ADC values was certainly blinded from the diagnosis of previous imaging of the patients. Circular Region of Interest (ROI) was used for the quantitative analysis of the ADC value of the normal hepatic parenchyma and lesion. The measured area of ROI was set at approximately 0.5 cm2. At least 3 measurements were made for every lesion and normal liver parenchyma and the average values were recorded. Using a water-filled phantom, the accuracy of the ADC measurements was tested. Average ADC values of nor-mal liver parenchyma and focal liver lesions, ADC “cut-off ” values, and the diagnostic sensitivity and specificity of the ADC map for hemangioma, benign and malig-nant lesions were investigated.
For statistical analysis of data SPSS 18.0 program was used. Age and ADC values were summarized as aver-age and standard deviation (if necessary, median and minimum-maximum). In situations with two or more groups (benign-malignant and control group, heman-gioma-cyst and control group), and in general com-parison of mean ages and ADC measurements, One Way Analysis of Variance was used. For significance of these two-way group comparisons, the Scheffe test was used. To distinguish mean ADC values of hemangio-ma, benign and malignant lesions and to determine a
cut-off point, ROC analysis was completed. For all tests the statistical level of significance was set as 0.05. Results
Of 72 focal liver masses, 51 were benign and 21 were malignant. The benign lesions were hemangiomas (n=38) and simple cysts (n=13). Malignant lesions were 9 hepatocellular carcinoma (n=9) and metasta-ses (n=12). The highest ADC values were measured in cysts (3.782±0.53×10⁻³ mm2/s) and hemangio-mas(2.705±0.63×10⁻³ mm2/s) (Table 1). The average ADC value was 2.912±0.73×10⁻³ mm2/s for benign
lesions, 1.250±0.74×10⁻³ mm2/s for malignant lesions and 1.631±1.11×10⁻³ mm2/s for normal liver parenchy-ma (Table 1). The average ADC value for heparenchy-mangioparenchy-ma was significantly higher than the averages for malignant lesions and the normal control group (p<0.001). The average ADC value for cysts was significantly higher than the value for hemangioma and the normal con-trol group (p<0.001). For benign lesions, the average ADC value was significantly higher when compared to malignant lesions and normal control group (p<0.001). For malignant lesions, the average ADC value was sig-nificantly lower than for benign lesions and the normal control group (p<0.001).
Table 1: ADC values of lesions that were measured using b value 600 s/ mm2
ADC values
(mm²/sec) Number of patients (n)
Normal liver parenchyma 1,631±1,11×10³ 72
Hemangioma 2,705±0,63×10³ 38
Cyst 3.782±0,53×10³ 13
Benign lesion 2,912±0,73 x10⁻³ 51
Malignant lesion 1,250±0,74 x10⁻³ 21
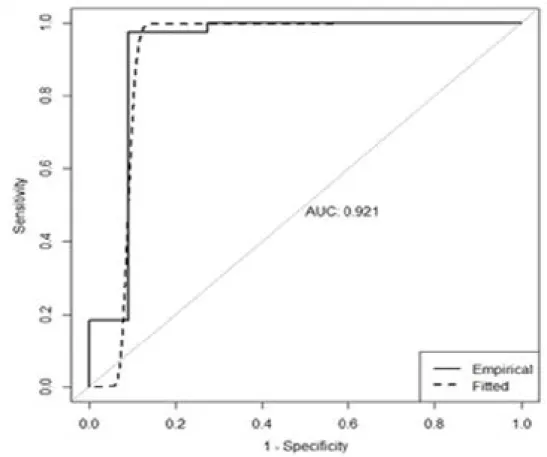
ADC: apparent diffusion coefficient To distinguish hemangioma from normal liver paren-chyma the “cut-off ” ADC value of 1.858×10⁻³ mm2/s had a sensitivity of 97.4% and a specificity of 95.7%. Distinguishing hemangioma from malignant liver le-sions, the “cut-off ” ADC value of 1.800×10⁻³ mm2/s had a sensitivity of 97.4% and a specificity of 90.9% (Table 2, Fig. 1). Table 2: Cut-off values for ADC with relevant sensitivity and specificity values Cut-off value for ADC (mm²/sec) Sensitivity (%) Specificity (%) Differentiation between hemangioma and malignant lesion 1,800 x10-3 97,4 90,9 Differentiation between hemangioma and normal liver parenchyma 1,858 x10-3 97,4 95,7 ADC: apparent diffusion coefficient ADC values (mm²/sec) Number of patients (n) Normal liver parenchyma 1.631±1.11×10³ 72
Hemangioma 2.705±0.63×10³ 38
Cyst 3.782±0.53×10³ 13
Benign lesion 2.912±0.73 x10⁻³ 51
Malignant lesion 1.250±0.74 x10⁻³ 21
Table 1: ADC values of lesions that were measured using b value 600 s/ mm2 ADC values (mm²/sec) Number of patients (n) Normal liver parenchyma 1,631±1,11×10³ 72
Hemangioma 2,705±0,63×10³ 38
Cyst 3.782±0,53×10³ 13
Benign lesion 2,912±0,73 x10⁻³ 51
Malignant lesion 1,250±0,74 x10⁻³ 21 ADC: apparent diffusion coefficient
Cut-off value for ADC (mm²/sec) Sensitivity (%) Specificity (%) Differentiation between hemangioma and malignant lesion 1.800 x10⁻³ 97.4 90.9 Differentiation between hemangioma and normal liver parenchyma
1.858 x10⁻³ 97.4 95.7 Table 2: Cut-off values for ADC with relevant sensitivity and specificity values
Cut-off value for ADC
(mm²/sec) Sensitivity (%) Specificity (%) Differentiation between
hemangioma and malignant lesion
1,800 x10-3 97,4 90,9
Differentiation between hemangioma and normal liver parenchyma
1,858 x10-3 97,4 95,7
To distinguish benign liver lesions from normal liver parenchyma the “cut-off ” ADC value of 1.844×10⁻³ mm2/s had a sensitivity of 96.1% and a specificity of 95.0% while the “cut-off ” ADC value of 1.504×10⁻³ mm2/s to distinguish malignant liver lesions from
nor-mal liver parenchyma had a sensitivity of 88.2% and a specificity of 81.8%. The ADC “cut-off ” value to distinguish benign liver lesions from malignant liver le-sions was 1.800×10⁻³ mm2/s which had a sensitivity of 96.1% and a specificity of 90.0% (Table 3).
Table 3: Cut-off values for ADC with relevant sensitivity and specificity values Cut-off value for
ADC (mm²/sec) Sensitivity(%) Specificity (%) Differentiation between
Benign lesion and normal liver parenchyma
1,844 x10-3 96,1 95,0
Differentiation between malignant lesion and normal liver parenchyma
1,507 x10-3 88,2 81,8
Differentiation between benign and malignant lesion
1,800 x10-3 96,1 90,9
ADC: apparent diffusion coefficient
Cut-off value for ADC (mm²/sec) Sensitivity (%) Specificity (%) Differentiation between
Benign lesion and normal liver parenchyma
1.844 x10⁻³ 96.1 95.0
Differentiation between malignant lesion and normal liver parenchyma
1.507 x10⁻³ 88.2 81.8
Differentiation between benign and malignant lesion
1.800 x10⁻³ 96.1 90.9
Table 3: Cut-off values for ADC with relevant sensitivity and specificity values Cut-off value for
ADC (mm²/sec) Sensitivity(%) Specificity (%) Differentiation between
Benign lesion and normal liver parenchyma
1,844 x10-3 96,1 95,0
Differentiation between malignant lesion and normal liver parenchyma
1,507 x10-3 88,2 81,8
Differentiation between benign and malignant lesion
1,800 x10-3 96,1 90,9
Discussion
Cavernous hemangioma is the most frequently ob-served benign liver tumor. Typical hemangioma appears hypointense on T1AG and hyperintense on T2AG. He-mangiomas have higher ADC values than solid lesions
in the liver and lower ADC values than cysts (Fig. 2). In addition, to distinguish cavernous hemangiomas from other pathologies, contrast dynamic examination is nec-essary. Mass characterization with magnetic resonance imaging (MRI) can evaluate the general lesion morphol-ogy, signal intensity and contrast pattern.
However even if all the results were evaluated togeth-er, there might still be an overlap between benign and malignant lesions. While dynamic contrast examination has become a component of routine abdominal scans, the contrast material used increases costs and carries the risk of side effects. Additionally, in some cases, dis-tinguishing vascular metastasis from hemangioma is not possible even with dynamic examination16. DWI is a technique which can be used within the duration of a held breath with no necessity for contrast material, and it helps to distinguish the “benign-malignant” nature of many focal lesions. This advantage, especially in renal failure patients due to the risk of “nephrogenic system-ic sclerosis”, is important as it reduces the need for IV gadolinium chelate compounds.
Diffusion is the name given to the randomized
mi-croscopic level, diffusion is known to be a sensitive parameter for tissue characterization. Today, the meas-urement of diffusion in vivo is possible using DWI and ADC measurements17. DWI queries and quantifies the movement of water molecules in tissues and thus the image is based on differences in movement in tissues which produces contrast. Tissue with high density of cell membranes, such as tumors, limits the diffusion of water protons. In contrast, water molecules move more freely in cystic or necrotic tissues and the water protons ADC is defined freely. As a result DWI provides infor-mation about cellularity and cellular membrane integri-ty, and even microcapillary perfusion. The presence of water diffusion means signal loss of DWI and corre-sponds with high ADC values. In contrast tumor cells have limited diffusion, producing DWI with high signal intensity and correspondingly low ADC values appear. Figure 2: Liver right lobe posterior hemangioma
(A)T2 weighted MR image showing hyper intense lesion
(B) Fat suppressed T1 weighted image after IV contrast showing compatible hemangioma
(C) b=600 s/mm2 diffusion weighted image showing hyper intense lesion
The development of echoplanar imaging (EPI), a type of fast MRI method, has shown that, diffusion weight-ed MRI can be usweight-ed to evaluate abdominal organs18,19. The diffusion properties of tissues are related to the in-terstitial free fluid and amount of permeability. In gen-eral, more limitation on diffusion is observed in cancer tissues. On DWI, the foci of liver tumors have limited diffusion and a reduction in ADC values20,21. In can-cer tissues, the normal structure of tissues is disrupted. This obstructs the macromolecular movement of wa-ter limiting diffusion in cancer cases and thus reduces measured ADC.
Our study supports previous studies in showing that ADC measurements are significantly different in benign and malignant liver masses21,22,7,23,24.
In our study, cysts and hemangiomas had the high-est ADC values while malignant lesions had lower ADC values. The average ADC value for cysts was 3.782±0.53×10⁻³ mm2/s while hemangiomas had an av-erage ADC value of 2.705±0.63×10⁻³ mm2/s. The av-erage ADC value of cysts were statistically significantly higher than hemangioma ADC values (p<0.001). All simple cysts had higher ADC values than the heman-gioma average ADC values21,22. In our study, the aver-age ADC value of benign lesions was 2.912±0.73×10⁻³ mm2/s, whereas the average ADC value of malignant lesions was 1.250±0.74×10⁻³ mm2/s.
For normal liver parenchyma, the average ADC value was 1.631±1.11×10⁻³ mm2/s. Our study supports pre-vious studies in finding that ADC values for hemangio-ma were statistically significantly higher than hemangio-malignant lesions and normal liver parenchyma (p<0.001)20,21. The “cut-off ” ADC value to distinguish hemangioma from normal liver parenchyma was 1.858×10⁻³ mm2/s with a sensitivity of 97.4% and a specificity of 95.7%. The “cut-off ” ADC value to distinguish hemangioma from malignant liver lesions was 1.800×10⁻³ mm2/s with a sensitivity of 97.4% and a specificity of 90.9%.
The limitations to our study should be considered. Firstly, our study population was relatively small when the study groups were divided into subgroups. Second-ly, another limitation was related with the technique. Diffusion weighted examination is made by sequences sensitive to respiratory, cardiac or peristaltic physiologi-cal movements which affect image quality and make the evaluation more difficult. Another limitation was the spatial resolution of the sequence which was too low for lesions less than 1 cm in size and these lesions were not included in the study. New studies using faster
par-allel imaging methods have developed image quality and reduced the artifacts due to EPI22. Recently, diffusion MR studies using 3 Tesla MR devices have improved image quality and new papers are available25.
On the other hand, diffusion weighted MRI sequence can be obtained within the duration of a single held breath (about 24 seconds), the technique itself requires no contrast material. The technique can aid differen-tial diagnosis of benign and malignant liver masses in cases where conventional sequences cannot be used. We think that, this MRI sequence is necessary to com-plete routine liver MR imaging protocols. We suspect the ADC values would be lower for complex cysts like abscesses and infestations. Because of the dense na-ture of the cysts, this is not surprising. In T2A images, hemangiomas and simple cysts were both seen as hy-perintense lesions. On diffusion weighted images (with high b values), hemangiomas were noticed as hyperin-tense; however, simple cysts were seen as hypointense lesions. After ADC mapping, cysts had higher ADC values, whereas hemangiomas had lower ADC values than cysts. Without using contrast material, this dif-ferentiation could be done easily with the aid of ADC measurement.
Conclusion
DWI and quantitative measurement of ADC values can be used in differential diagnosis of benign and malig-nant liver lesions. Conventional MR imaging with added DWI increases the accuracy of conventional MR meth-ods in characterizing benign and malignant lesions. He-mangiomas have higher ADC values than malignant lesions and normal parenchyma, but they have lower values ADC values than cysts. DWI and quantitative measurement of ADC values can be used in the diagno-sis and differentiation of hemangiomas. In case where dynamic examination cannot distinguish vascular me-tastasis and lesions from hemangioma, DWI and ADC values can be useful both in primary and differential di-agnosis. The technique does not require contrast mate-rial, so it can safely be used in patients with renal failure. References
1. Ichikawa T, Haradome H, Hachiya J, Nitatori T, Ar-aki T. Diffusion-weighted MR imaging with single-shot echo-planar imaging in the upper abdomen: preliminary clinical experience in 61 patients. Abdom Imaging 1999;
24:456-461.
2. Moteki T, Horikoshi H, Oya N, Aoki J, Endo K. Evaluation of hepatic lesions and hepatic
parenchy-ma using diffusion-weighted reordered turboFLASH magnetic resonance images. J Magn Reson Imaging 2002;
15:564-572.
3. Warach S, Chien D, Li W, Ronthal M, Edelman RR. Fast magnetic resonance diffusion-weighted imaging of acute human stroke. Neurology 1992; 42:1717–1723.
4. Back T, Hoehn-Berlage M, Kohno K, Hossmann KA. Diffusion nuclear magnetic resonance imaging in experimental stroke: correlation with cerebral metabo-lites.Stroke 1994; 25:494–500.
5. Lutsep HL, Albers GW, DeCrespigny A, Kamat GN, Marks MP, Moseley ME. Clinical utility of diffu-sion-weighted magnetic resonance imaging in the as-sessment of ischemic stroke. Ann Neurol 1997; 41:574–
580.
6. Kim T, Murakami T, Takahashi S, Hori M, Tsuda K, Nakamura H. Diffusion-weighted single-shot echopla-nar MR imaging for liver disease. AJR Am J Roentgenol
1999; 173:393–398.
7. Ichikawa T, Haradome H, Hachiya J, Nitatori T, Araki T. Diffusion-weighted MR imaging with a sin-gle-shot echoplanar sequence: detection and charac-terization of focal hepatic lesions. AJR Am J Roentgenol
1998;170:397–402.
8. Namimoto T, Yamashita Y, Sumi S, Tang Y, Taka-hashi M. Focal liver masses: characterization with diffu-sion-weighted echo-planar MR imaging. Radiology 1997;
204:739–744.
9. Stahlberg F, Brockstedt S, Thomsen C, Wirestam R. Single-shot diffusion-weighted echo-planar imaging of normal and cirrhotic livers using a phased-array multi-coil. Acta Radiol 1999; 40:339.
10. Amano Y, Kumazaki T, Ishihara M. Singleshot dif-fusion-weighted echo-planar imaging of normal and cirrhotic livers using a phased-array multicoil. Acta Ra-diol 1998; 39:440–442.
11. Moteki T, Ishizaka H, Horikoshi H, Matsumoto M. Differentiation between hemangiomas and hepatocel-lular carcinomas with the apparent diffusion coefficient calculated from turbo FLASH MR images. J Magn Reson Imaging 1995; 5: 187–191.
12. Ries M, Jones RA, Basseau F, Moonen CT, Grenier N. Diffusion tensor MRI of the human kidney. J Magn Reson Imaging 2001;14:42–49.
13. Namimoto T, Yamashita Y, Mitsuzaki K, Nakayama Y, Tang Y, Takahashi M. Measurement of the apparent diffusion coefficient in diffuse renal disease by diffu-sionweighted echo-planar MR imaging. J Magn Reson Im-aging 1999; 9:832–837.
14. Koike N, Cho A, Nasu K, Seto K, Nagaya S,
Ohshi-ma Y, Ohkohchi N. Role of diffusion-weighted Ohshi- mag-netic resonance imaging in the differential diagnosis of focal hepatic lesions. World J Gastroenterol
2009;15:5805-12.
15. Le Bihan D, Breton E, Lallemand D, Aubin ML, Vignaud J, Laval-Jeantet M. Separation of diffusion and perfusion in intravoxel incoherent motion MR imaging.
Radiology 1988; 168:497-505.
16. Semelka RC, Shoenut JP, Kroeker MA, Greenberg HM, Simm FC, Minuk GY, Kroeker RM, Micflikier AB. Focal liver disease: comparison of dynamic contrast-en-hanced CT and T2-weighted fatsuppressed, FLASH, and dynamic gadolinium-enhanced MR imaging at1.5 T. Radiology 1992; 184:687–694.
17. Le Bihan D, Turner R, Douek P, Patronas N. Diffu-sion MR imaging: clinical applications. AJR Am J Roent-genol 1992; 159: 591-9.
18. Muller MF, Prasad P, Siewert B, Nissenbaum MA, Raptopoulos V, Edelman RR. Abdominal diffusion mapping with use of a whole-body echo-planar system.
Radiology 1994; 190:475–483.
19. Reimer P, Saini S, Hahn PF, Brady TJ, Cohen MS. Clinical application of abdominal echoplanar imaging (EPI): optimization using a retrofitted EPI system. J Comput Assist Tomogr 1994; 18:673–679.
20. Naganawa S, Sato C, Nakamura T, Kumada H, Ishigaki T, Miura S, Maruyama K, Takizawa O. Diffu-sion-weighted images of the liver: comparison of tu-mor detection before and after contrast enhancement with superparamagnetic iron oxide. J Magn Reson Imaging
2005; 21:836-840.
21. Demir OI, , Sağol O, Dicle O. Contribution of dif-fusion-weighted MRI to the differential diagnosis of hepatic masses. Diagn Interv Radiol 2007;13:81-86.
22. Yoshikawa T, Kawamitsu H, Mitchell DG, Ohno Y, Ku Y, Seo Y. ADC measurement of abdominal organs and lesions using parallel imaging technique. AJR Am J Roentgenol 2006; 187: 1521-30.
23. Sandrasegaran K, Akisik FM, Lin C, Tahir B, Rajan J, Aisen AM. The value of diffusion-weighted imaging in characterizing focal liver masses. Acad Radiol 2009;
16: 1208-14.
24. Sun XJ, Quan XY, Huang FH, Xu YK. Quantitative evaluation of diffusion- weighted magnetic resonance imaging of focal hepatic lesions. World JGastroenterol
2005; 11: 6535-7.
25. Hunsche S, Moseley ME, Stoeter P, Hedehus M. Diffusion-tensor MR imaging at 1.5 and 3.0 T: initial observations. Radiology 2001; 221: 550-6.