TABLE OF CONTENTS
ABSTRACT . . . i ¨ OZET . . . ii ACKNOWLEDGEMENTS . . . iii LIST OF FIGURES . . . iv LIST OF SYMBOLS/ABBREVIATIONS . . . vi 1. INTRODUCTION . . . 12. MEIBOMIAN GLAND DYSFUNCTION . . . 3
2.1 Definition of MGD . . . 3
2.2 Metrics for Calculating MGD Level . . . 4
2.3 Diagnosis of MGD . . . 5
2.4 Treatment of MGD . . . 7
3. AUTOMATIC DETECTION OF MGD LEVEL . . . 8
3.1 Image Properties . . . 9
3.2 Image Processing . . . 11
3.3 Algorithm for Detection of MGD Level . . . 15
3.3.1 Determination of interest area . . . 16
3.3.2 Drawing line chart . . . 19
3.3.3 Finding local maximum, local minimum . . . 22
3.3.4 Collecting the frames . . . 25
3.3.5 Determination of mgd pixels from frames . . . 28
3.4 Revision on the Algorithm . . . 32
4. SOFTWARE OF THIS THESIS . . . 40
5. TESTING AND VALIDATION . . . 45
6. CONCLUSIONS . . . 60
REFERENCES . . . 62
CURRICULUM VITAE . . . 63
AUTOMATIC DETECTION OF MGD LEVEL (MEIBOMIAN GLAND DYSFUNCTION)
ABSTRACT
MGD is a common, clinical disease which is the major cause of dry eye. Meibography is a study in order to observe meibomian glands. A meibography image is the infrared photograph of the inner part of eyelids of the patient. Physicians are using meibography images to diagnose MGD. The important result from the infrared meibography image is the level of the disease. Using the level, the appropriate treatment is decided by the physician.
Aim of this thesis is to develop the automatic software to detect MGD level from meibography images. Current methods require manual processing takes a long time for detection of MGD level. Thus our aim is to develop an algorithm running in reasonable time and easier to use than the current methods.
To achieve our goal, image processing techniques supported by manual editing are used. In addition, some mathematical methods such as drawing line chart, finding local maximum, local minimum, processing image pixels, finding mean, ratio and other methods are used. Manual editing and automatic determination feature is provided to the user of the software. Physician can load a meibography image to the software and can get results in seconds. Result can also be changed.
A software using the algorithm described in this thesis is developed and tested. Development of the automatic software to process meibography images for MGD level detection is completed. For testing and valdiation, Unit tests on the code are done. In addition, Bland&Altman method is applied on the results of the software.
MGD SEV˙IYES˙IN˙IN OTOMASYON YOLUYLA TES¸H˙IS˙I
¨
OZET
MGD g¨oz kurulu˘gunun ba¸slıca nedeni olarak g¨or¨ul¨ur. Kronik ve klinik bir hastalıktır. Meibography, meibomian glandleri g¨ozlemlemek amacı ile geli¸stirilmi¸s bir ara¸stırmadır. Bir meibography foto˘grafı ise tedavi edilen ki¸sinin g¨oz kapa˘gının i¸c kısmının infrared foto˘grafıdır. Infrared meibography foto˘grafından alınabilecek ¨onemli bilgi hastalı˘gın seviyesidir. Meibography foto˘grafları MGD seviyesini tespit etmek amacıyla kul-lanılır ve hastalı˘gın seviyesine g¨ore bir tedavi uygulanır.
Tezin amacı, meibography foto˘graflarından MGD hastalı˘gının seviyesini tespit eden bir algoritma ile birlikte bir yazılım geli¸stirmektir. Mevcut y¨ontemler d¨u¸s¨un¨uld¨u˘g¨unde, doktorların zaman alıcı i¸slemler yapması nedeniyle ama¸c makul s¨ure i¸cinde ¸calı¸san bir algoritma ve mevcut y¨ontemlerden daha kolay kullanılan bir yazılım geli¸stirmektir.
Temel y¨ontem olarak, elle d¨uzenlemenin destekledi˘gi resim i¸sleme teknikleri kul-lanılmı¸stır. C¸ izgi grafi˘gi ¸cizmek, yerel en b¨uy¨uk, en k¨u¸c¨uk de˘ger tespiti, resim pixel i¸slemleri, oran bulma ve di˘ger matematiksel y¨ontemler kullanılmı¸stır. Ek olarak, tezde a¸cıklanan algoritmayı kullanan bir yazılım geli¸stirilmi¸stir. Doktor, geli¸stirilen yazılımı kullanarak bir meibography foto˘grafı y¨ukleyebilir ve sonucu saniyeler i¸cinde alabilir. Ek olarak, sonu¸c doktor tarafından d¨uzenlenebilir.
Tezde a¸cıklanan algoritma ve y¨ontemleri kullanan bir yazılım geli¸stirilmi¸s, testler uygulanmı¸s ve revizeler yapılmı¸stır. Bir meibography foto˘grafını i¸slemek amacıyla kullanılacak bir uygulamanın geli¸stirilmesi ve testleri tamamlanmı¸stır. Ek olarak, yazılımın sonu¸cları ¨uzerinde Bland&Altman testleri uygulanmı¸stır.
ACKNOWLEDGEMENTS
I thank Prof. Dr. Banu Bozkurt for allowing me to use undisclosed meibography images for testing and validating the software.
I thank Assoc. Prof. Dr. Tamer Da˘g for starting this thesis and giving the idea the thesis is based on. Also, Bland&Altman Excel document is shared by Tamer Da˘g.
LIST OF FIGURES
Figure 1.1 Example meibography images (Scaled to 25%) . . . 1
Figure 1.2 Interest area of meibography images (Scaled to 25%) . . . 2
Figure 2.1 Example images from the current method . . . 5
Figure 2.2 Example images from the method [1] . . . 6
Figure 3.1 Meibography images . . . 9
Figure 3.2 Example colors . . . 9
Figure 3.3 Line chart representation of 138. row of a meibography image . 12 Figure 3.4 Line chart representation of multiple rows of a meibography image 13 Figure 3.5 Line chart representation of 411. row. . . 13
Figure 3.6 Example images for drawing the interest area. . . 16
Figure 3.7 Input and Output images of the method . . . 18
Figure 3.8 Example of images that are inputs for final processing . . . 19
Figure 3.9 Line chart of 138. row of the example image . . . 20
Figure 3.10 Line chart of 138. row of another example image . . . 20
Figure 3.11 Example Line Chart . . . 21
Figure 3.12 Marked pixel sets on Example Line Chart . . . 21
Figure 3.13 Local Maximum and Local Minimum points on a line chart . . . 22
Figure 3.14 Output of Finding Local Maximum, local minimum method . . . 24
Figure 3.15 Local Maximum and Local Minimum . . . 26
Figure 3.16 Example of Local Maximum and Local Minimum . . . 26
Figure 3.17 Example of determination of MGD pixels . . . 31
Figure 3.18 Example output of the software . . . 32
Figure 3.19 Update result for a wide MGD channel . . . 35
Figure 3.20 Update result for gap inside a gland . . . 37
Figure 3.21 Brightness on a meibography image . . . 39
Figure 4.1 Flow Chart of the Application . . . 41
Figure 4.2 Drawing the Interest Area . . . 42
Figure 4.3 Output of the Software . . . 43
Figure 5.1 Validation of Number and Ratio . . . 45
Figure 5.2 Manual determination & Automated detection on day one . . . . 47
Figure 5.3 Manual determination & Automated detection on day one . . . . 47
Figure 5.4 Manual determination & Automated detection on day one . . . . 47
Figure 5.5 Manual determination and Automated detection on day one . . 48
Figure 5.6 Manual determination & Automated detection on day two . . . 49
Figure 5.7 Manual determination & Automated detection on day two . . . 49
Figure 5.8 Manual determination & Automated detection on day two . . . 49
Figure 5.9 Manual determination and Automated detection on day two . . 50
Figure 5.10 Manual determination & Automated detection by other user . . 51
Figure 5.11 Manual determination & Automated detection by other user . . 51
Figure 5.12 Manual determination & Automated detection by other user . . 51
Figure 5.13 Manual determination and Automated detection by other user . 52 Figure 5.14 Automated detection on day one & on day two . . . 53
Figure 5.15 Automated detection on day one & on day two . . . 53
Figure 5.16 Automated detection on day one & on day two . . . 53
Figure 5.17 Automated detection on day one and on day two . . . 54
Figure 5.18 Automated detection on day one & by other user . . . 55
Figure 5.19 Automated detection on day one & by other user . . . 55
Figure 5.20 Automated detection on day one & by other user . . . 55
Figure 5.21 Automated detection on day one and by other user . . . 56
Figure 5.22 Automated detection on day two & by other user . . . 57
Figure 5.23 Automated detection on day two & by other user . . . 57
Figure 5.24 Automated detection on day two & by other user . . . 57
Figure 5.25 Automated detection on day two and by other user . . . 58
LIST OF SYMBOLS/ABBREVIATIONS
MGD Meibomian Gland Dysfunction RGB Notation for Color Representation
R Red
G Green
B Blue
Greyscale Monochromatic IR Infrared
PHP Personal Home Page
JS Javascript Programming Language
NodeJS Server Side Javascript Programming Language AJAX Asynchronous JavaScript and XML
HTTP Hyper Text Transfer Protocol URL Uniform Resource Locator Pre-defined Built-in
B&A Bland-Altman
HTML Hypertext Markup Language GD GIF Draw / Graphic Draw
px Pixel
OS Oculus Sinister(Left eye) OD Oculus Dextrus(Right eye) OSDI Ocular Surface Disease Index
Non-Obvious MGD The condition that MGD can not be determined Frontend Visible part of the application
Backend Server side of the application jpeg Joint Photographic Expert Group gif Graphic Interchange Format bmp Bitmap
1.
INTRODUCTION
MGD is a disease which is common and clinical and the major cause of dry eye. MGD is the abnormal condition of meibomian glands and is known as chronic [1][2][3]. The superficial tear film is using lipids contributed by glands for tear production. Disfunction of meibomian glands is resulting in a disease called as MGD that causes dry eye [4]. Effects can be counted as discomfort, visual disturbance and contact lens intolerance [6]. Determination of MGD level is important for the treatment of the disease. Fortunately, meibography helps physicians to take infrared photographs of the inner part of the eyelid of the patient. This process is called as meibography which is a study developed for the purpose of observing meibomian glands [4]. Inner area of the eyelid is including signs of MGD. Disease can be observed by looking at the images but calculating the level is challenging.
The way for determination of the MGD level is using meibography, the imaging study developed for the purpose of observing meibomian glands [4]. Physician takes the infrared photograph of the inner part of the eyelid of the patient in order to observe. Using the image, the physician calculates the level of the disease. According to level, appropriate treatment for the patient is decided.
Following images are examples of meibography images
MGD level is calculated using the percentage of ”Area of Loss” in the interest area. In this thesis, interest area of a meibography image is the region indicating the focus area for the software. According to the output of the software, interest area have two types of pixels. One type is MGD pixel and the other is NO-MGD. Area of Loss is the percentage of NO-MGD pixels. From 0% to 100%, each percentage has a corresponding level according to the metric. There are different metrics for calculating the level of the disease. One of the metrics is three level using intervals with %33.3 length. Another is four level, intervals with %25 length.
Aim of this thesis is to automate the calculation of MGD level by calculating Area of Loss inside the interest area of the meibography image.
Figure 1.2 Interest area of meibography images (Scaled to 25%)
MGD can be observed by looking at the vertical channels inside the interest area of the image. Vertical light color channels are the indicators of MGD. Physicians are using meibography images not only for diagnosing the disease but also calculating the level for finding the appropriate treatment. There are multiple metrics for the level of the disease, finding the percentage of MGD pixels, thus finding the ”Area of Loss” will give the level of the disease according to one of the metrics.
In Chapter 1 (Introduction), the subject of thesis along with the organization is presented. Chapter 2 (Meibomian Gland Dysfunction) is about the definition, the metrics, diagnosis and treatment of MGD. In Chapter 3 (Automatic Detection of MGD Level), methods for automatic level detection are developed, pseudocode of methods are presented. Chapter 4 (Software of This Thesis) presents the software of this thesis. In Chapter 5 (Testing and Validation), Bland&Altman test is applied to results. In Chapter 6, conclusions of this thesis is presented.
2.
MEIBOMIAN GLAND DYSFUNCTION
2.1 Definition of MGD
”Meibomian gland dysfunction (MGD) is a chronic, diffuse abnormality of the mei-bomian glands, commonly characterized by terminal duct obstruction and/or quali-tative/quantitative changes in the glandular secretion. This may result in alteration of the tear film, symptoms of eye irritation, clinically apparent inflammation, and ocular srface disease.” This recommended definition is taken from the Report of the Definition and Classification Subcommittee on The International Workshop on Meibomian Gland Dysfunction.
MGD is a disease because of the abnormal condition of meibomian glands. MGD is known as common, clinicial and chronic. Tears are important for protecting the eye from unwanted conditions. Tears are produced by superficial tear film using the lipids contributed by meibomian glands. Abnormal condition of glands resulting in dysfunction and blocking tear production.
People who have MGD are seeing the effects of dry eye. These effects can be counted as discomfort, visual disturbance and contact lens intolerance. Treatment of MGD is possible. Patient gets a treatment from the physician according to level of disease.
MGD is diagnosed using infrared meibography image of the inner part of eyelids of patient. The image is processed by the physician in order to determine level of the disase. There are different metrics for determination of level and methods for processing the image. Aim of all methods and metrics is to determine the correct level and decide the appropriate treatment.
2.2 Metrics for Calculating MGD Level
Two metrics can be counted for calculating MGD level. One of the metrics is using four levels while another is using three levels. Metrics are using the value of area of loss from processed meibography images. According to value of area of loss, metrics are giving the level as output. Difference between metrics is that one of them is using four intervals with 25% length, other is using three intervals with 33.3% length.
Both metrics are using the value of ”Area of Loss” for level determination. Area of Loss is the percentage of pixels marked as NO-MGD in the interest area of the processed meibography image. Other set of pixels in the interest area is MGD pixels.
One metric is using following intervals:
0% <= Area of Loss <= 25% LEVEL 1 25% < Area of Loss <= 50% LEVEL 2 50% < Area of Loss <= 75% LEVEL 3 75% < Area of Loss <= 100% LEVEL 4
Other metric is using following intervals:
0% <= Area of Loss <= 33.3% LEVEL 1 33.3% < Area of Loss <= 66.6% LEVEL 2 66.6% < Area of Loss <= 100% LEVEL 3
Metrics are checking the value of ”Area of Loss”. Since there are only two types of pixels in the interest area, finding the ratio of MGD pixels is giving the ratio of NO-MGD pixels (Area of Loss). Algorithm of this thesis is trying to fing NO-MGD pixels in the interest area but the important value is Area of Loss which the algorithm calculates by substracting MGD pixel ratio from one hundred.
2.3 Diagnosis of MGD
There are current methods used by physicians for determination of the MGD level. One of the methods is putting pins around the glands and around the interest area, then giving the image to a software for level determination. This process is time taking and requiring effort because the number of pins are many. Another method is using image processing softwares to apply filters on the image in order to get MGD area and pixels. In this thesis, a different method is used. Meibography images are processed using increasing & decreasing color valuess and no filter applied to images.
One of the current methods is putting pins around glands and the interest area. In this technique, the physician takes the meibography image of inner part of eyelids of patient to check for existence of MGD and the level of the disease. The physician puts pins around glands and around the interest area. Then the image is processed by the software which draws MGD and NO-MGD pixels with different colors and returns level of the disease. Sofware uses four level metric for deciding the level.
Figure 2.1 Example images from the current method
Although the current method is giving a trusted result to the physician about the level of the disease, manually putting pins around glands and interest area is time taking. Another disadvantage is that there is no undo for a pin after a new pin.
This thesis is discussing the algorithm for developing a software in order to determine MGD level from meibography images. Comparing with the current method, the physician is going to draw only interest area of the image. After drawing, software of this thesis is designed to convert this area into a two-color structure and give level of the disease as output. Software will use four level metric for deciding the level. Also, the physician can control whole process and edit the results.
Another current method for determination of MGD level is using image filters. In this technique, MGD level is determined by applying filters on the image [1]
Figure 2.2 Example images from the method [1]
Although this technique determines MGD pixels as shown in Image F., along with other preparations applying filters mentioned in the following list will require time to run the algorithm.
Wallis Filter:
The Wallis Filter applies a contrast enhancement to the image in which there are significant areas of bright and dark tones. The Filter adjusts brightness in local areas so that the local mean and standard deviation match target values Labelling Process:
Grouping pixels on the image according to coordinate and color relation. Pixels are grouped to form a component that can be used independent from others. Edge Detection:
Determination of pixels that forms an edge between two components or regions. Spline Interpolation:
A different form of curve-fitting and is similar to linear interpolation. Gamma Correction:
Gamma functions are used for correcting the image’s brightness level(luminance). Mapping:
Mapping is transforming pixels of a image into new pixels. Thus transforming the image. Greyscale image can be converted to RGB image using mapping. Excluding Misdetermination:
2.4 Treatment of MGD
There are traditional methods used for treatment of the disease such as warm com-press, lid hygiene, antibiotics and anti-inflammatory agents [3]. There are other methods for the treatment of the disease. These methods [3] can be listed like,
Intraductal meibomian gland probing Emulsion eye drops containing lipids Thermal pulsation system
N-asetil-cysteine Topical Azithromycin Cyclosporine A
Treatment of the disease is still challenging. Although MGD can be determined by looking at the meibography images, there are some cases that the disease can not be determined. This type of condition is called as ”Non-obvious MGD”.
There is a case report that is taken from reference 2, A 42 years old female claimed dry eye. Symptoms were assessed by the OSDI (Ocular Surface Disease Index). OSDI score was 37.5. Lid margin and meibomian gland appeared to be normal. Meibomian glands were not expressible easily. Loss of meibomian glands was e-valuated by the portable non-contact infra-red (IR) meibograph and computerized grading and resulted in 37% (OD) loss of glands of the upper lid.
Condition of upper and lower eye lids before and after the treatment is listed in Table 1.2. Loss of glands (Area of Loss) is represented with percentages.
Upper Lid Lower Lid
Before Treatment OD: 37% OS: 42% OD: 45% OS: 51% After Treatment OD: 40% OS: 39% OD: 48% OS: 45%
3.
AUTOMATIC DETECTION OF MGD LEVEL
In the development of the software of this thesis, PHP programming language and GD image processing library are used in server. Javascript programming language is used for processing the image on the web browser and developing the software interface. The algorithm mentioned in this thesis is from the server side (PHP) code of the software. Algorithm is represented as pseudocode.
PHP is a popular, general-purpose scripting language that is especially suited to web development as php.net describing the language. For years, development with PHP became more popular. Object oriented programming support and the latest version of the language which is version 7 made the language more preferable. Gif Draw library of PHP programming language is the built-in image processing library which is used and tested by many developers. The library provides all needed functions to the developer. Documentation of PHP programming language and GIF Draw library is well prepared and has a lot of example of usage.
Javascript is a programming language which is object-oriented and used for making interactive effects within a web browser. Javascript code is running on the browser. The latest developments are making the language more powerful and preferable. NodeJS is a server side programming language based on Javascript. It would be fast and efficient to process images using NodeJS. In this thesis, PHP is preferred.
Processing with PHP has more advantages than processing with Javascript. PHP is running in the server while Javascript is on the web browser. PHP is using the content of the file while Javascript is using the canvas element for processing the image. For this reason, in this thesis, images are sent to server when possible.
3.1 Image Properties
A meibography image is the infrared photograph of the inner part of the eyelid of the patient. The output images from meibography are the inputs for the software of this thesis. Extension of files is ”jpeg”. PHP Gif Draw image processing library is able to open, read and understand the image files with a valid image file extension. Openning, reading and writing ”jpeg” files is possible.
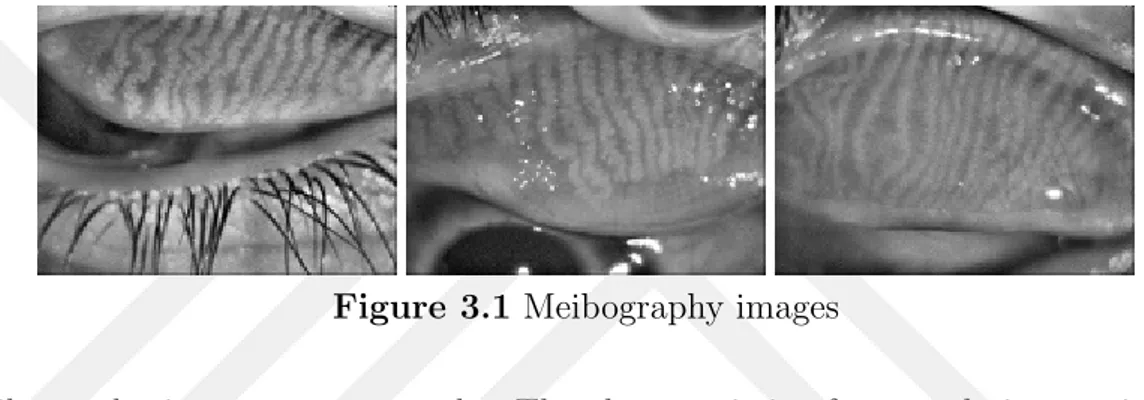
Images from meibography have ”640px” width and ”480px” height. Figure 3.1 is the example of meibography images which are scaled to 25%.
Figure 3.1 Meibography images
Meibography images are greyscale. The characteristic of greyscale images is that Red, Green and Blue values of each pixel of the image are equal.
Figure 3.2 Example colors
In Figure 2.3, there are six colors. Red and Green rectangles (First and Third) is not greyscale because of the different values of Red, Green and Blue colors. Black and grey rectangles (Second, fourth, fifth, sixth) are greyscale.
In software or web development, there are mainly two notations that are used in common. One of the notations is HEX. Another one is RGB. Both notations are used for representing a color. Development environments are providing some visual elements to the developer. Using the elements, developers compose a software or a website. There are many visual products that are developed until now. Each product is including visual elements in different colors. Element colors are selected using the interface of the environment or by writing some line of code. All programming environments accept both HEX and RGB notation.
HEX notation represents each of Red, Green and Blue values with two bytes in base sixteen. Length of HEX notation is six. First two bytes represent Red while the second two bytes is value of Green. In a similar way, the third two bytes represent Blue color. Developers put a number sign ”#” in front of the notation to tell the compiler or programming environment that the notation is a HEX notation. This notation is accepted by all programming languages and HTML. Examples of HEX notation are: #FF0000, #00FF00, #0000FF (Red, Green, Blue)
RGB notation represents Red, Green and Blue values of a color with three numbers from 0 to 255. First number is representing the value of Red. Second and the third numbers are representing Green and Blue color. Developers write RGB notation with using ”rgb” keyword to tell the type of notation. RGB like HEX is accepted and used by all programming languages. In addition to this, there is another notation which is called as RGBA. The fourth value (A) represents alpha channel of color. Alpha channels are between 0 and 1, used for making transparent color. Examples of RGB notation are: rgb(255,0,0), rgb(0,255,0), rgb(0,0,255) (Red, Green, Blue)
Meibography images are greyscale. In HEX notation, value of each two bytes are equal. In RGB notation, value of each three numbers are equal. While developing the software of this thesis, RGB notation is used when processing image pixels. Example HEX notation for a greyscale color: #8A8A8A
3.2 Image Processing
Image Processing is a set of activities in order to get information about or change a digital image. Image files have a unique code representation that describing the image to the computer. In addition to this, programming languages are able to read and understand this representation. For this reason, reading and changing the image without seeing the visual representation is possible. Following list is representing some of image processing functions of PHP programming language.
imagecreatefromstring:
Forming a ”GD image” object from base64 representation of the image. imagesx:
Returning the width of the image. imagesy:
Returning the height of the image. imagecolorat:
Return is the color value of pixel at given left and top coordinate. imagecolorallocate:
Function preparing a color for drawing a pixel. imagesetpixel:
Function that drawing a pixel with the color from imagecolorallocate imagepng:
Converting a ”GD image” object to a PNG Image
Programming languages are useful for image processing. Programs able to process images can be written. All popular programming languages have image processing libraries provided to developers. Pre-defined functions and classes of the language are helping developers open, read, write and save images. In this thesis, PHP and Javascript programming languages are used for image processing. A big percentage of the processing work is done by PHP in the server side. This is for the reason that the performance advantage of PHP programming language.
Images from meibography have ”jpeg” extension. Gif Draw image processing library is able to open, read and change ”jpeg” files. After openning the file, developer can write code for reading from or writing on the image. Pseudocode for traversing each pixel of the image can be written as following:
FOREACH ROW AS M:
FOREACH COLUMN AS C:
COLOR = GET_COLOR_AT(C, M);
The code is reading each pixel of the image. There will be (width * height) 640 * 460 = 307200 ”Get Color at” function call by methods. For this reason, performance of the methods must be considered and tested in this kind of condition.
Color of pixels of the image can be useful for image processing. Color of each column on a row can be drawn onto a line chart to understand the color relation.
FOREACH COLUMN AS C:
COLOR = GET_COLOR_AT(C, 138); DRAW_ON_CHART(COLOR, C, 138)
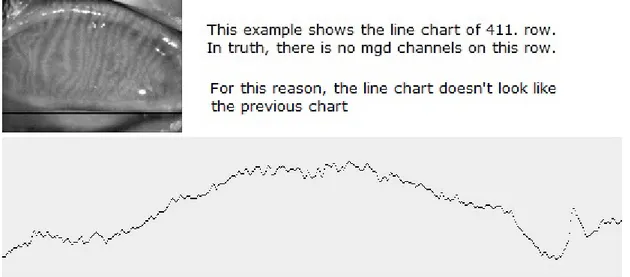
Figure 3.4 Line chart representation of multiple rows of a meibography image Figure 3.3 and Figure 3.4 are showing line chart representation of some rows of a meibography image. Horizontal line of the charts is representing the columns while the vertical line is representing color values. When the line chart of a row is drawn, potential MGD pixels can be seen by looking at the chart. If color values are increasing and then decreasing, the pixels can be thought as a potential MGD pixel set. Increasing and decreasing values mean that there is a brightness. For this thesis, brightness on a meibography image means a potential MGD pixel set.
There is one more example showing that in some rows, there may not be MGD pixel sets although there are increasing and decreasing color values on the row.
Line chart representations for some rows are telling that potential MGD pixels can be determined using line chart of the row. Potential MGD pixels are brightness on the image. At the same time, are inside increasing & decreasing pixel sets. By looking at the line chart, pixels between a local minimum and consecutive local minimum represent brightness and are potential MGD pixels.
In this thesis, Determination of MGD level using meibography images is based on line charts. Before ending this section, pseudocode showing that the meibography images are greyscale can be written as the following code block. The code doesn’t give error on meibography images.
FOREACH ROW AS M:
FOREACH COLUMN AS C:
COLOR = GET_COLOR_AT(C, M);
IF (COLOR["R"] == COLOR["G"] AND COLOR["R"] == COLOR["B"]): CONTINUE;
ELSE:
ERROR("IMAGE IS NOT GREYSCALE");
Pseudocode above is traversing each column of each row of the image using the FOREACH COLUMN inside FOREACH ROW. Color of each pixel of the image at the coordinate from (0, 0) to (640, 480) is checked. If Red value is equal to Green and Blue, the pixel can be a part of a greyscale image. Characteristic of a greyscale image is that Red, Green and Blue values of each pixel of the image are equal. For this reason, code does not give error and continue with the new pixel. If Red, Green and Blue values are not equal then the code give error. Because the pixel can not be a part of a greyscale image. If so, the image is not greyscale.
Code will run for each pixel if the image is greyscale. Code will give error whenever a not greyscale pixel is read. Using the code, program for checking images in terms of greyscale or not can be developed.
3.3 Algorithm for Detection of MGD Level
In this section, methods for automatic detection of MGD level is presented. From a meibography image to a processed image of which level is determined, all phases used are mentioned. The first phase is drawing the interest area. Phases end with determining MGD level and displaying the results to the physician.
Phases from drawing the interest area to the result can be listed as following:
Determination of Interest Area
Interest area is the region that the algorithm will be aplied. Interest area is drawn by the physician and determined by the software
Drawing Line Chart
Forming line chart representation of each row to determine potential MGD pixels. Line charts are imagined by the algorithm instead of drawing.
Finding Local Maximum, Local Minimum
Checking brightness on the image to find frames for potential MGD pixels. Pixels between consecutive local minimum points of the row are behaved as potential MGD pixels
Gathering Frames
Frames from all rows are gathered for processing. Each frame is containing potential MGD pixels between consecutive local minimum points
Deciding MGD Pixels from Frames
From the frames, MGD pixels are determined using the color distance of a pixel to local minimum and to local maximum.
After passing through these phases, the input image becomes the result image of which MGD pixels are determined. The algorithm focuses on the interest area and form the frames that have potential MGD pixels inside. The algorithm detects MGD pixels by using color distance. After detecting MGD pixels, Area of Loss is calculated using the ratio returned from the software. According to Area of Loss, level of the disease is calculated using the four level metric.
3.3.1 Determination of interest area
In this section, the method for determining the interest area in server is presented. Before that, feature of drawing the interest area is mentioned. Following images are examples of the feature.
Figure 3.6 Example images for drawing the interest area.
Workflow description of the application,can be usable to understand the feature of drawing the interest area, which can be listed as following.
A meibography image is uploaded:
After taking the IR photograph of the inner part of eyelid of the patient, output image is uploaded to the software.
Interest area is drawn:
After the image is uploaded, the interest area is drawn by the physician using the tool in the frontend of the software. The interest area means a closed area on the image which the algorithm will be applied on.
”Process” button is clicked:
Drawing the interest area is completed when the starting and the ending point of drawing line is connected. Then, the physician clicks to ”Process” button. Result is shown:
In about five seconds, the software is giving a result which shows MGD pixels and NO-MGD pixels, along with the number and ratio of the pixels.
Result is edited:
Result image is presented in the HTML document using a canvas element along with a tool that is enabling the editing operation on the image. The doctor can change MGD and NO-MGD pixels on the image using the editing tool.
When starting and ending point of drawing line is connected, ”Process” button becomes visible to the physician to send the image to server for determining the interest area. The area is determined using the following code.
FOREACH COLUMN AS C:
FOREACH ROW AS M FROM ROW0 TO ROW479: COLOR = GET_COLOR_AT(C,M);
IF (GREYSCALE): PAINT_WITH_RED(C,M); ELSE: BREAK;
FOREACH ROW AS M FROM ROW479 TO ROW0: COLOR = GET_COLOR_AT(C,M);
IF (GREYSCALE): PAINT_WITH_RED(C,M); ELSE: BREAK;
FOREACH ROW AS M:
FOREACH COLUMN AS C FROM COLUMN0 TO COLUMN639: COLOR = GET_COLOR_AT(C,M);
IF (GREYSCALE): PAINT_WITH_RED(C,M); ELSEIF (CLARET_RED): CONTINUE;
ELSE: BREAK;
FOREACH COLUMN AS C FROM COLUMN639 TO COLUMN0: COLOR = GET_COLOR_AT(C,M);
IF (GREYSCALE): PAINT_WITH_RED(C,M); ELSEIF (CLARET_RED): CONTINUE;
ELSE: BREAK;
The method can be represented with the following list.
For each column of the image
– From Up to Bottom, check the color value of each column of the row * If color is greyscale, then paint with a color (Claret red)
* If color is not greyscale, then break the loop
– From Bottom to Up, check the color value of each column of the row * If color is greyscale, then paint with a color (Claret red)
* If color is not greyscale, then break the loop For each row of the image
– From Left to Right, check the color value of each column of the row * If color is greyscale, then paint with a color (Claret red)
* If color is claret red, then continue * If none of the above, then break the loop
– From Right to Left, check the color value of each column of the row * If color is greyscale, then paint with a color (Claret red)
* If color is claret red, then continue * If none of the above, then break the loop Output the method mentioned above is as following.
Figure 3.7 Input and Output images of the method
3.3.2 Drawing line chart
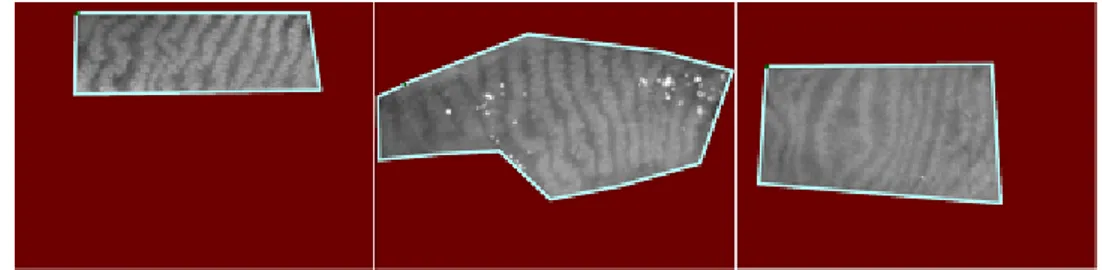
After the interest area of the image is determined, the output image from the method for determination of the interest area will be sent to server again for final processing. Images are in the following format.
Figure 3.8 Example of images that are inputs for final processing
After the image is sent to server, server starts to process the image. The method for this purpose starts from ROW 0 (First row) of the image, for each column of the row, color value of the column is calculated and drawn on the chart of the row. This process is repeated for each row of the image. This way, the line chart representations of each row are formed.
There will be 480 (height of image) line charts and each chart will represent a row from ROW0 to ROW479. The method can be presented with the following code.
FOREACH ROW AS M:
FOREACH COLUMN AS C:
COLOR = GET_COLOR_AT(C,M);
IF (COLOR["R"] == COLOR["G"] AND COLOR["R"] == COLOR["B"]): DRAW_ON_CHART(COLOR,C,M);
Method is traversing each column of each row of the image and drawing the color value of the current column on the line chart of the row. In addition, the method is checking the color value of the current column and if color is not greyscale then does not draw the column on the chart. This way, only the interest area of the image is processed and drawn on the line chart representation of the row.
Example output of this method is as following.
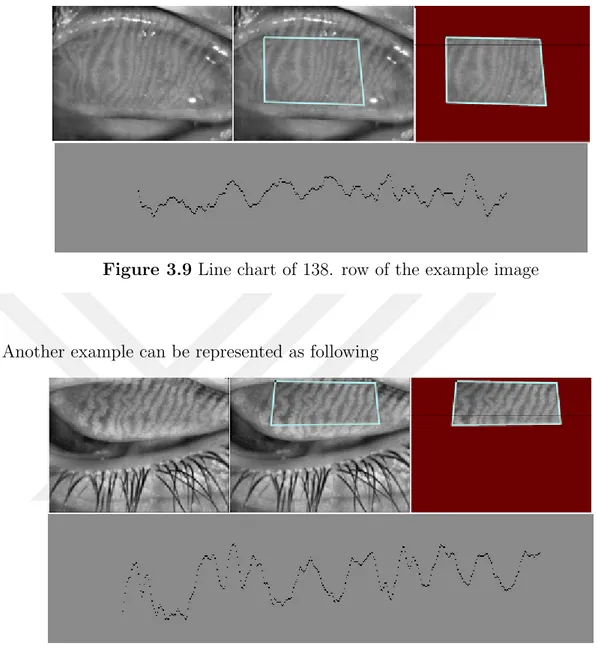
Figure 3.9 Line chart of 138. row of the example image
Another example can be represented as following
Figure 3.10 Line chart of 138. row of another example image
Figure 3.9 and Figure 3.10 are examples of ”Drawing Line chart” method running for 138. row of example images. MGD color sets can be seen by looking at the increasing and decreasing points on the line chart.
Purpose is getting increasing and decreasing pixels in the interest area, keeping in frames and deciding the MGD pixels.
The blank spaces on the left and on the right side of the chart are the areas colored by ”Claret Red”. The method is focusing on the interest area.
When the following line chart is considered
Figure 3.11 Example Line Chart
Pixels which will be used for MGD determination can be marked as following.
Figure 3.12 Marked pixel sets on Example Line Chart
Pixels (color value of a column) inside the red rectangles are potential MGD pixels. If the color values while going from left to right is increasing then decreasing, that means there is a brightness and the pixels are potential MGD pixels. Marking these pixels on the line chart is simple but for the software, method for getting potential MGD pixels and keeping in a frame is needed. The description for the development of this kind of a method is mentioned in following sections.
Determination of MGD pixels can be done by finding local maximum and local min-imum points on the line chart and keeping in a frame.
Frame word means the array containing three elements as following.
[ [min_value, index], [max_value,index], [min_value, index] ]
Local Minimum Minimum point of MGD pixel set (frame) on the left Local Maximum Maximum point of MGD pixel set (frame)
Local Minimum Minimum point of MGD pixel set (frame) on the right
3.3.3 Finding local maximum, local minimum
A local maximum can be described as a point on the graph of the function whose vertical coordinate is larger than all other vertical coordinates on the graph at points ”close to” the local maximum point. Local minimum is a point on the graph of the function whose vertical coordinate is less than all other vertical coordinates on the graph at points ”close to” the local minimum point[8].
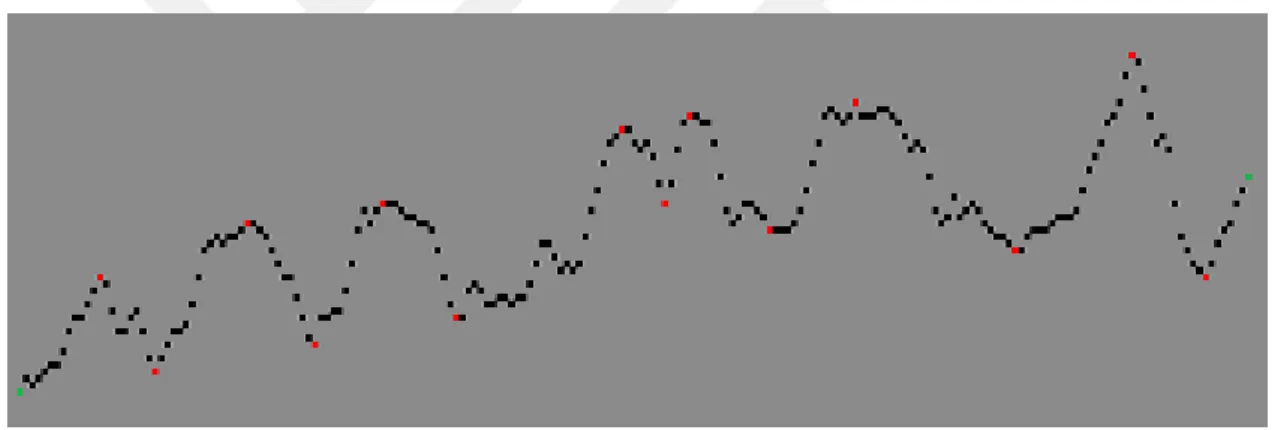
Example of local minimum and local maximum points on a graph can be presented as following figure. The graph is the line chart representation of a row of a meibography image. Software is not generating visual line chart representation of each row of the image. Instead, is behaving the pixels like drawing a line chart while traversing the image pixels.
Figure 3.13 Local Maximum and Local Minimum points on a line chart Local maximum & local minimum points are represented with red color, starting and ending points are represented with green color. While the method is traversing the column pixels of a row of the image, visual representation in Figure 2.13 is imagined by the method and local maximum & local minimum points are determined.
The workflow up to this time can be listed as:
Physician loaded the image and the interest area was drawn Image was processed in server for determining the interest area Image was sent back to browser for displaying
The method in the server side is getting a meibography image that the interest area is determined and is using the code presented as following pseudocode to determine MGD pixel sets (frames). The method is assumed to work on 138. row
ROW=138; VAR=10; LEFT_OK=0; RIGHT_OK=0; MINIMUM_UNTIL_NOW=[]; FOREACH COLUMN AS C:
CURRENT_COLOR = GET_COLOR_AT(C, 138);
IF (MINIMUM_TIL_NOW == [] OR CURRENT_COLOR < MINIMUM_TIL_NOW[0]): MINIMUM_TIL_NOW = [CURRENT_COLOR, C];
WHILE (THERE IS A PIXEL ON THE LEFT): GO_LEFT();
LEFT_CURRENT_COLOR = GET_COLOR_AT(CURRENT_PIXEL_ON_LEFT, 138); IF (CURRENT_COLOR - LEFT_CURRENT_COLOR > VAR):
LEFT_OK = 1; BREAK;
IF (CURRENT_COLOR < LEFT_CURRENT_COLOR): BREAK;
WHILE (THERE IS A PIXEL ON THE RIGHT): GO_RIGHT();
RIGHT_CURRENT_COLOR = GET_COLOR_AT(CURRENT_PIXEL_ON_RIGHT, 138); IF (CURRENT_COLOR - RIGHT_CURRENT_COLOR > VAR):
RIGHT_OK = 1; BREAK;
IF (CURRENT_COLOR < RIGHT_CURRENT_COLOR): BREAK;
IF (LEFT_OK == 1 AND RIGHT_OK == 1):
Method is traversing each column of each row. For each column of the current row, the method is checking the color value of pixels (columns) on the left and on the right of the current column. For columns on the left, if there is a color value that is less than the current color and the difference is more than ”VAR” variable(10), the method is breaking the loop and continue with the columns on the right. In a similar way, for columns on the right, if there is a color value that is less than the current color and the difference is more than ”VAR” variable(10), then the current point is accepted as local maximum point.
While the method is checking the color value of the previous and the next columns of the current column, at the same time, is keeping the minimum color value seen until that time. If RIGHT OK variable is 1 and LEFT OK variable is 1, then the column along with the minimum point are sent to ”ADD TO FRAME” function
Figure 3.14 Output of Finding Local Maximum, local minimum method
Line chart in Figure 3.14 is the example output of the method for finding local maximum & local minimum point. Red marking is showing local maximum and minimum point while the green marking is showing the starting and the ending point. The gap between the third and the fourth red point is telling that there is no local maximum between the third and the fourth point. This condition is because of the VAR(10) variable of the method. Value of the variable is set to ten by default. Value can be changed to set the precision of the algorithm and the software. If the value is less than ten, there will be more frames gathered, in a similar way, if the value is more than ten, there will be less frames. This condition is telling that VAR variable is setting the precision of the algorithm and the software.
3.3.4 Collecting the frames
Frame word is used for describing the array containing potential MGD pixels. When the framing function is called by local maximum & local minimum method, the minimum point and the maximum point are kept in the array which is called as a frame. In addition, the minimum value is added to the previous frame. This way, each frame will contain three values that are describing the left local minimum point, local maximum point and the right local minimum point.
In this thesis, a frame is independent from other frames. Left local minimum value is representing the starting point and the starting color value of the frame. Local maximum value is representing the maximum color point and the maximum color value of the frame. In a similar way, the right local minimum value is representing the ending point and the ending color value of the frame.
Expectation is to have three different point in a frame. Method for finding local maximum and local minimum point is checking each column and looking for a max-imum value using the VAR(10) variable and adding the maxmax-imum point to a new frame with the local minimum point until that time. The local minimum point is also added to the previous frame.
There are some conditions that a frame may not contain three points. Instead, there may be two points that are representing the starting and the ending point of the frame, at the same time, the line chart. This condition means that there is no local maximum point on the chart according to the method.
Line charts are showing that there are pixels between the starting point and the first left local minimum point and also there are pixels between the last right minimum point and the ending point. Although the expectation is a frame with three elements, some frames may have two elements. The frames with less than three elements will be determined in a different way. Because, a regular frame has three elements and one local maximum. Frame with two elements has no local maximum.
When the following figure is considered,
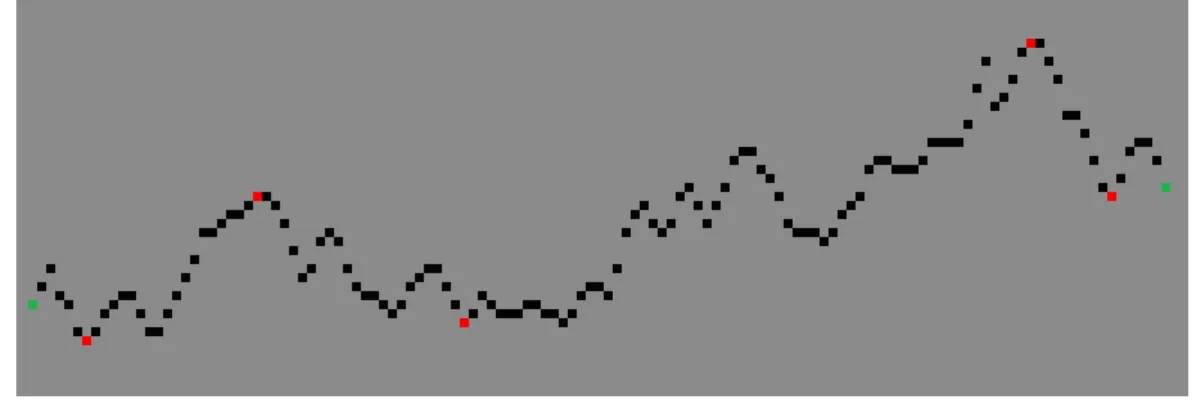
Figure 3.15 Local Maximum and Local Minimum
The local maximum and the local minimum points are marked with red color while the starting and the ending point is marked with a green color. There are seven local maximum, seven local minimum points on the example line chart. Each local maximum point has one local minimum on the left and one local minimum on the right. The starting point marked with green color is the left local minimum point of the first frame. However, the ending point is not the right local minimum point of the last frame. The starting and the ending points may or may not be local minimum points for a frame.
When following figure is considered,
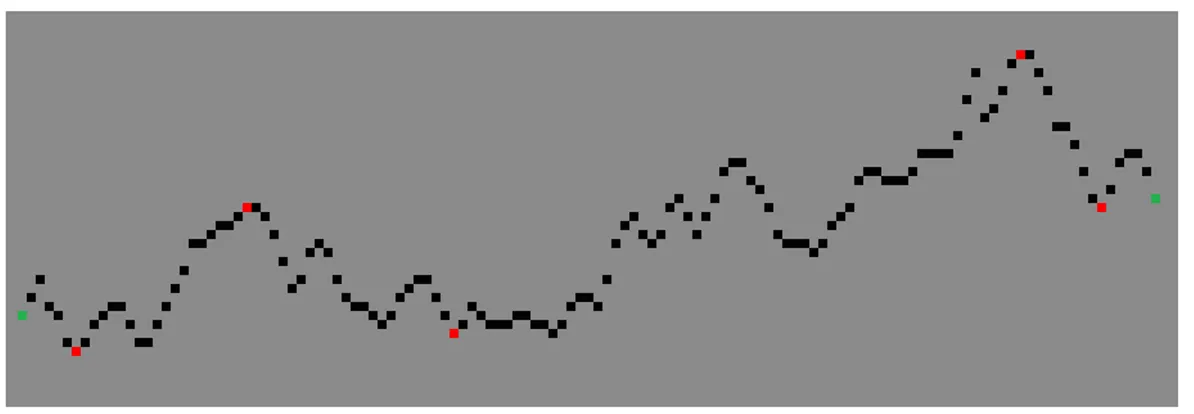
Figure 3.16 Example of Local Maximum and Local Minimum
Starting and ending points are not in the first or the last frame of the line chart. In this kind of condition, the remaining pixels between the starting point and left local minimum of the first frame and between right local minimum of the last frame and the ending point will be behaved different while deciding MGD pixels.
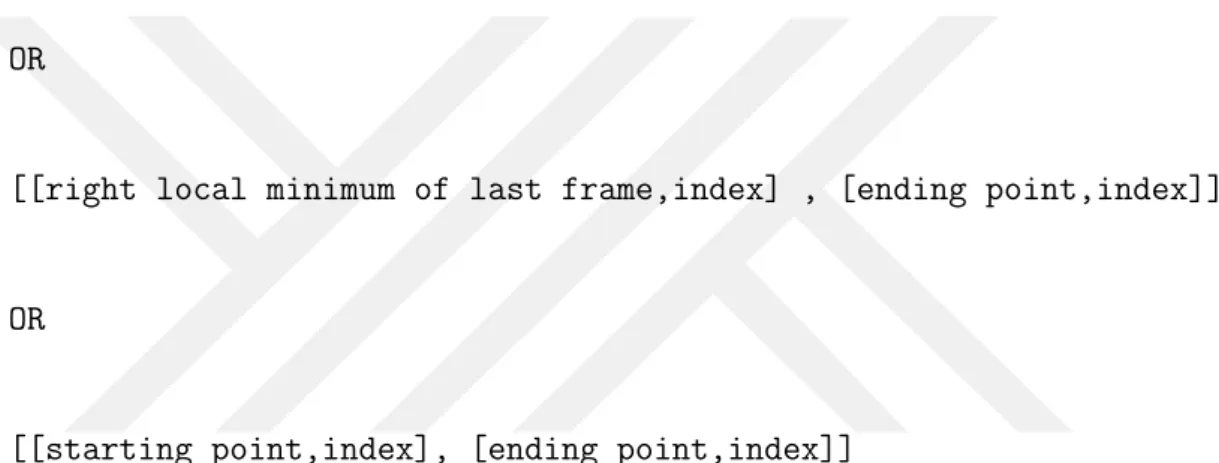
There are four types of frames in total. Combination of frames of a row is the total representation of the row. For this reason, each type of a frame of a row must be processed in order to check all pixels of the row.
[[left_minimum,index], [maximum,index], [right_minimum,index]]
OR
[[starting point,index], [left local minimum of first frame,index]]
OR
[[right local minimum of last frame,index] , [ending point,index]]
OR
[[starting point,index], [ending point,index]]
As a result, There may be different kind of frames that coming from the framing method. When a frame is thought in the abstract way, each frame is containing the corresponding column pixels of the row. According to the color value of pixels in the frame, the method in the following section will determine MGD pixels looking at the distance of color value of a column to the local minimum and local maximum for a regular frame. For another kind of a frame, a different method will be applied. Following table is describing a regular frame.
Local Minimum Minimum point of MGD pixel set (frame) on the left Local Maximum Maximum point of MGD pixel set (frame)
Local Minimum Minimum point of MGD pixel set (frame) on the right
3.3.5 Determination of mgd pixels from frames
After gathering frames, each row will have frames containing column pixels of the row according to local maximum and minimum rule. In the previous section, different kind of frames are mentioned. A regular frame looks like following,
[ [left_minimum, index], [maximum, index], [right_minimum, index] ]
The frame above is representing that there are three points in the frame: left mini-mum, local maximini-mum, right minimum. The purpose is traversing each pixel in this frame from left to right and decide if the pixel is MGD pixel.
From left minimum to the maximum, for each pixel, if color distance of the pixel to the left minimum is less than the distance to the local maximum, then the pixel is not representing MGD. If distance to left minimum is greater than the distance to the local maximum, then the pixel is representing MGD.
Following code is representing this method.
FOREACH COLUMN AS C FROM LEFT_MINUMUM TO LOCAL_MAXIMUM:
CURRENT_TO_MIN = CURRENT_COLUMN["COLOR"] - LEFT_MINIMUM["COLOR"] MAX_TO_CURRENT = LOCAL_MAXIMUM["COLOR"] - CURRENT_COLUMN["COLOR"] IF (CURRENT_TO_MIN > MAX_TO_CURRENT):
DRAW_WITH_GREEN_COLOR(C, {CURRENT_ROW})
FOREACH COLUMN AS C FROM LOCAL_MAXIMUM TO RIGHT_MINUMUM:
CURRENT_TO_MIN = CURRENT_COLUMN["COLOR"] - RIGHT_MINIMUM["COLOR"] MAX_TO_CURRENT = LOCAL_MAXIMUM["COLOR"] - CURRENT_COLUMN["COLOR"] IF (CURRENT_TO_MIN > MAX_TO_CURRENT):
Another kind of a frame can be like following,
[[starting point,index],[left local minimum of first frame,index]]
In this case, there are two elements inside the frame. One of the elements are representing the starting point of the line chart while the another is representing the left local minimum value of the first frame. The previous method is not applicable on this kind of frames because there is no local maximum value.
Following code is representing the method for processing this kind of a frame.
VAR = 10
MAXIMUM = {MAXIMUM OF THE FRAME} MINIMUM = {MINIMUM OF THE FRAME} FOREACH COLUMN AS C
FROM STARTING_POINT TO LEFT_LOCAL_MINIMUM_OF_FIRST_FRAME: CURRENT_TO_MIN = CURRENT_COLUMN["COLOR"] - MINIMUM MAX_TO_CURRENT = MAXIMUM - CURRENT_COLUMN["COLOR"] IF (CURRENT_TO_MIN > MAX_TO_CURRENT):
IF (CURRENT_TO_MIN > VAR):
DRAW_WITH_GREEN_COLOR(C, {CURRENT_ROW})
The method knows the maximum and the minimum value of the frame. There are pixels in the frame from starting point of the line chart to the left local minimum of the first frame. For each pixel in the frame, the method is checking the color distance of the pixel to the minimum and to the maximum. Method determines the pixel as MGD if color distance of the pixel to the maximum is less than to the minimum and if the distance to the minimum is more than VAR(10) variable.
Difference from the previous method is that the current method knows maximum and minimum values of the frame in advance.
As different from the previous, a frame can be as following.
[[right local minimum of last frame, index],[ending point, index]]
In this case, one of the elements of the frame represents the right local minimum of the last frame while the another represents the ending point of the line chart. The method for this kind of a frame is as following.
VAR = 10
MAXIMUM = {MAXIMUM OF THE FRAME} MINIMUM = {MINIMUM OF THE FRAME} FOREACH COLUMN AS C
FROM RIGHT_LOCAL_MINIMUM_OF_LAST_FRAME TO ENDING_POINT: CURRENT_TO_MIN = CURRENT_COLUMN["COLOR"] - MINIMUM MAX_TO_CURRENT = MAXIMUM - CURRENT_COLUMN["COLOR"] IF (CURRENT_TO_MIN > MAX_TO_CURRENT):
IF (CURRENT_TO_MIN > VAR):
DRAW_WITH_GREEN_COLOR(C, {CURRENT_ROW})
In addition to the previous kind of frames, a frame can be as following.
[ [starting point, index], [ending point, index] ]
This condition is telling that there is one frame in the row. In this case, the same method mentioned above can be used by changing,
FOREACH COLUMN AS C
FROM RIGHT_LOCAL_MINIMUM_OF_LAST_FRAME TO ENDING_POINT: with
After all frames from each row are gathered, frames are processed as independent from other frames by the methods mentioned above according to type of the frame. After processing, MGD pixels are determined and drawn with green color. Other pixels inside the interest area is ”Area of Loss”.
Example output of determination of MGD pixels method is as following.
Figure 3.17 Example of determination of MGD pixels
According to result, percentage of MGD pixels inside the interest area is 53.4%. Area of loss from the result is 46.6%. Using Area of loss, MGD level is calculated.
0 <= Level 1 < 25 25 <= Level 2 < 50 50 <= Level 3 < 75 75 <= Level 4 < 100
According to metric above, the result for the MGD level seems to be ”Level 2”. Four level metric for detection of MGD level is implemented to the software.
3.4 Revision on the Algorithm
In the previous sections, methods for determination of the interest area and MGD pixels are presented. The algorithm for determination of the MGD level focuses on the interest area of the meibography image and draw the line chart of each row. Drawing line chart, in this thesis, is the abstract operation done by the algorithm. Algorithm is imagining the line chart representation of the row while traversing the row and is marking local maximum and minimum points. After finding local maxi-mum and minimaxi-mum points, frames are formed. A regular frame is the array keeping one local minimum on the left, one local maximum and one local minimum on the right. Using the frames, the method for determination of MGD pixels is processing the frames and drawing MGD pixels with green color. Methods mentioned in this thesis is resulting with a software.
Following figure is the output of the software.
Figure 3.18 Example output of the software
Figure is showing that MGD pixels inside the interest area of the meibography image is determined by the software. The count and the ratio of MGD and NO-MGD pixels are returned from the software as the output. After results are taken, some revisions are needed on the algorithm to make results better. In following, methods for revisions will be developed and used.
Expected revisions on the MGD determination algorithm can be listed as:
Revision: Glands should be wide.
Revision: There should not be a gap inside a gland
Revision: NO-MGD area should not be determined as MGD.
Revision: Brightness on the infrared photograph should be considered.
In order to complete the first revision, method for determination of MGD pixels will be updated. The update should not change the main mechanism of the method. Instead, the update should change just a few line of the code.
For a regular frame, MGD pixels are determined using the following way
FOREACH COLUMN AS C FROM LEFT_MINUMUM TO LOCAL_MAXIMUM:
CURRENT_TO_MIN = CURRENT_COLUMN["COLOR"] - LEFT_MINIMUM["COLOR"] MAX_TO_CURRENT = LOCAL_MAXIMUM["COLOR"] - CURRENT_COLUMN["COLOR"] IF (CURRENT_TO_MIN > MAX_TO_CURRENT):
DRAW_WITH_GREEN_COLOR(C, {CURRENT_ROW})
FOREACH COLUMN AS C FROM LOCAL_MAXIMUM TO RIGHT_MINUMUM:
CURRENT_TO_MIN = CURRENT_COLUMN["COLOR"] - RIGHT_MINIMUM["COLOR"] MAX_TO_CURRENT = LOCAL_MAXIMUM["COLOR"] - CURRENT_COLUMN["COLOR"] IF (CURRENT_TO_MIN > MAX_TO_CURRENT):
DRAW_WITH_GREEN_COLOR(C, {CURRENT_ROW})
From left local minimum to local maximum and from local maximum to right local minimum, color distance of each pixel in the frame to the minimum and to the maximum is checked. If distance to the maximum is less than the distance to the minimum, then the algorithm is drawing the pixel with green color. This condition can be represented as if the distance to the maximum divided by the distance to the minimum is less than one, the pixel is drawn with green color.
In order to make a gland wide when compared to output of the current method, the following update is added to the code.
WIDE_VAR = 0.5
FOREACH COLUMN AS C FROM LEFT_MINUMUM TO LOCAL_MAXIMUM:
CURRENT_TO_MIN = CURRENT_COLUMN["COLOR"] - LEFT_MINIMUM["COLOR"] MAX_TO_CURRENT = LOCAL_MAXIMUM["COLOR"] - CURRENT_COLUMN["COLOR"] IF (CURRENT_TO_MIN > MAX_TO_CURRENT OR
CURRENT_TO_MIN / MAX_TO_CURRENT > WIDE_VAR): DRAW_WITH_GREEN_COLOR(C, {CURRENT_ROW})
FOREACH COLUMN AS C FROM LOCAL_MAXIMUM TO RIGHT_MINUMUM:
CURRENT_TO_MIN = CURRENT_COLUMN["COLOR"] - RIGHT_MINIMUM["COLOR"] MAX_TO_CURRENT = LOCAL_MAXIMUM["COLOR"] - CURRENT_COLUMN["COLOR"] IF (CURRENT_TO_MIN > MAX_TO_CURRENT OR
CURRENT_TO_MIN / MAX_TO_CURRENT > WIDE_VAR): DRAW_WITH_GREEN_COLOR(C, {CURRENT_ROW})
Update added a new variable to the code. Variable is assigned to the value of ”0.5”. New method again checks the color distance of the pixel to the minimum and to the maximum. If the distance to the minimum is more than the distance to the maximum, the method draws the pixel with green color. In addition, with the new update, algorithm checks the distance ratio of the pixel. For example, if the distance to the minimum is less than or equal to the distance to the maximum, algorithm checks the distance ratio. If the ratio is greater than the value of the variable ”0.5”, the method will determine the pixel as MGD and draw with green color.
The update mentioned above for a regular frame is also applied to other types of frames. For each frame, algorithm checks the distance ratio of the pixels of the frame to the minimum and to the maximum. According to ratio difference, the pixel is determined as MGD or NO-MGD.
The algorithm before the update was checking the distance. In fact, the algorithm was checking the ratio also but the ratio condition was one. New update added a new variable and assigned 0.5 as value. New algorithm after the update checks the distance ratio and determine the pixel as MGD if the distance ratio to local minimum over local maximum is less than one and more than WIDE VAR(0.5).
Figure 3.19 Update result for a wide MGD channel
Figure 3.19 represents the result of the update. There are three different output images. The first image is the output of the algorithm before the update. Another image is the output after the update with the variable value assigned to ”0.5”. The third result represents the result with the variable value assigned to ”0.3”.
Variable ”WIDE VAR” makes the determined glands wide when the value is less than one. Variable will make the glands less wide if the value is more than one. The value of the variable can be assigned to one in order to return to the previous algorithm before the update. The variable can be used for setting the precision of the software. Changing the value will result in the output which has glands with more or less width. Optimum value for the variable seems to be between ”0.3” and ”1” in order to make the results better.
Another revision requires: ”There should not be gap inside a gland.”
MGD determination algorithm draws the glands with green color. Algorithm checks local maximum and local minimum points to form frames in order to determine MGD pixels. In some rows, there may be a MGD pixel set and then a NO-MGD pixel set and again a MGD pixel set. In this case, if the width of NO-MGD pixel set is large than that means there are two glands. If the width is not large, five or ten pixels, it can be said that NO-MGD pixels are the part of the glands. For this reason, there is one gland.
In this thesis, frames are processed independent from other frames. A NO-MGD pixel set between two MGD pixel sets can be interpreted in different ways. As mentioned above, according to the width of the NO-MGD pixel set, glands can be behaved as one gland or two glands. As the original attitude of the algorithm, a NO-MGD pixel set between two glands are behaved as NO-MGD. The glands are behaved as two different glands even if the width of NO-MGD pixel set is not large. However, when each row is combined, NO-MGD pixels are forming a gap inside a gland. Current revision requires that there should not be a gap inside a gland.
Update will draw the gap inside a gland with green color. NO-MGD pixels which are not large inside a gland will be behaved as MGD and drawn with green color. The update will be applied on the result image which is shown to the physician and will be written in Javascript because will be applied to the frontend of the software.
Method for this update will group NO-MGD pixels on the result image. For each group, number of pixels will be counted. If the number of pixles is less than a value, like three hundred, the method will determine the pixels in the group as MGD and draw with green color. If the number of pixels is more than the value, pixels will be behaved as NO-MGD and will not be drawn with green color. This way, the method will determine the pixels less than three hundred which make a gap inside a gland as MGD and draw with green color.
The method for this update that will draw gaps which are not large inside the interest area to green color can be written as following
GROUP_NOT_MGD_PIXELS(); FOREACH GROUP AS C:
IF LENGTH(C) < 300:
DRAW_WITH_GREEN_COLOR(C)
Method checks each NO-MGD pixel on the result image. According to enclosing pixels, a NO-MGD pixel is added to a group. After groups are formed, the number of pixels in each group is counted. If the number of pixels is less than three hundred, pixels in the group are determined as MGD and drawn with green color.
Figure 3.20 Update result for gap inside a gland
Gap which is not large inside a gland is determined as MGD as shown in the figure. The needed revision is completed with this update. Glands are determined better because there is no gap inside.
The third revision requires that:
”NO-MGD area should not be determined as MGD”
Current algorithm uses increasing & decreasing colors of a row to form frames. Algorithm checks the color values of pixels in a frame to decide if the pixel is a MGD pixel. If the color distance of a pixel to local minimum is more than the distance to local maximum, the algorithm determines the pixel as MGD. In addition, This algorithm is revised in Revision 1 to make MGD glands wide.
On a meibography image, there may be some pixels that the algorithm determined as MGD but in fact, the pixels are not MGD. This condition is because of the mechanism of the algorithm. According to current algorithm, brightness on the image means a potential MGD pixel set. Feature of drawing the interest area helps the user of the software focus on the area including real MGD pixels. In fact, the interest area which will be drawn by the physician will be the whole inner part of eyelid of the patient. There will be some pixels determined as MGD by the software but in fact, the pixels are not MGD pixels
Feature of editing result image provides a tool to the user in order to edit the result image. Using the editing tool, new MGD or NO-MGD pixels can be drawn on the image. The user can mark the area will be changed. Using the buttons, new MGD pixels can be drawn on the area or some MGD pixels can be removed. In addition to this feature, following code is added as the update to the algorithm.
IF LENGTH(MGD_PIXEL_SET) > 5 AND LENGTH(MGD_PIXEL_SET) < 100: DRAW_WITH_GREEN_COLOR({COLUMN},{ROW})
The code represents the codition that is added to the algorithm. New algorithm checks the length of the pixel set. A potential MGD pixel set is determined as MGD if the length of the pixels is more than five and less than one hundred. For this reason, length of a gland will be between five and one hundred.
Remaining revision is about considering brightness on a meibography image. There are some cases that IR photograph is containing some unexpected bright area. The example of the case is represented in Figure 3.21
Figure 3.21 Brightness on a meibography image
Brightness on the image is marked with red circle. The reason of this condition is the device taking the IR photograph. Real condition of the pixels in terms of MGD or NO-MGD can be understanded by looking at the image. Algorithms can also determine the brightness on the image using the color values. Bright area pixels will have the higher color values compared to other pixels on the image. When all pixels of the image is gathered, outlier pixels can be determined using the formula:
IF (COLOR_VALUE_of_PIXEL < MEAN - (2*STANDARD_DEVIATION) OR COLOR_VALUE_of_PIXEL > MEAN + (2*STANDARD_DEVIATION)):
BRIGHTNESS()
However, the algorithm can not determine the real condition of bright pixels in terms of MGD or NO-MGD. Because according to current algorithm, frames are behaved independent from other frames. Following versions of the software can have ”Gland Following” algorithm to follow glands and decide if a bright pixel is representing MGD or NO-MGD. Fortunately, editing feature of the software provides a useful tool in order to edit the result image. The user can change bright pixels on the image to MGD or NO-MGD in seconds using the editing tool.
4.
SOFTWARE OF THIS THESIS
Software is designed as a web application and requires a localhost configuration or connection to The Internet. The software provides a drawing feature to the physician for drawing the interest area of a meibography image. After drawing, software is giving the result in about five seconds. After the result is shown, the result image can be edited. User can add or remove some MGD pixels on the result image. This thesis focuses on giving a result which requires minimal editing.
For the development of the software, PHP and Javascript programming languages are preferred. In the backend, a PHP server is processing the image and resulting to the frontend. In the frontend, a set of interactive tools is helping the physician do some browser related work and edit the result.
In the following list, functions and variables of the canvas element are listed. Canvas is the HTML element which allows users to draw on.
getImageData: Color value at specified index fillStyle: Drawing configuration
fillRect: A rectangle according to fillStyle lineTo: A line between two points
lineWidth: Length of the line will be drawn canvas.width: Width of the canvas
canvas.height: Height of the canvas
Frontend part of the software is using the functions and variables above. Frontend of the software includes features that help the user upload a meibography image, draw the interest area and edit the result.
Flow charts are useful for learning the general mechanism of a system. Flow chart is a diagram that represents how a system is operating. Following diagram is the flow chart representation of the software of this thesis
Figure 4.1 Flow Chart of the Application
Rectangles with green background represents the work done in server while the white rectangles are representation of the work done in the frontend. The image is sent to server for processing and sent back to frontend for displaying. Data is transmitted through AJAX calls from Javascript to PHP and PHP to Javascript.
When the software is visited using a web browser, a meibography image is waited to be uploaded. User can use the ”Choose File” button for uploading the image. Although the software is waiting for a meibography image, some other files are also allowed. File type checking algorithm is not applied to the software.
Determination of the interest area is important for the correctness of the result. Processing the whole image reuqires multiple algorithms to determine the interest area and give the correct result. Software of this thesis provides a tool for drawing the interest area. A rectangular can be drawn on the image in about ten seconds.
The user clicks on the image and starts drawing, following click draws a line be-tween the points. Each click adds a line bebe-tween the previous click. This way, a rectangular can be drawn with five click.
Figure 4.2 Drawing the Interest Area
Figure 4.2 represents the example of interest area drawing feature. When the start-ing and the endstart-ing point is connected, ”Process” button becomes visible to the user for processing the image. User clicks the ”Process” button and the image is sent to server for processing. After the result is shown, user can return back to interest area drawing feature and can send the image to server to process again.
One of the examples of output of the software is presented in Figure 4.3. Number of MGD and NO-MGD pixels along with the ratio is returned from the software.
Figure 4.3 Output of the Software
As presented in the following chapter (Chapter 5 Testing and Validation), number of pixels that are MGD or NO-MGD along with the ratio is calculated correct. In addition to this, the physician may need to edit the result like adding or removing MGD pixels to correct some area on the image. There is a tool in the software helping the user edit the result. Physician can mark the area which editing will be applied. Doctor can draw the marked area to MGD or NO-MGD.
Information returned from the software represents the count and the percentage of pixels in the interest area. According to the result,
Number of MGD pixels is: 31.921. Number of NO-MGD pixels is: 22.352. Percentage of MGD pixels (58.8%) Area of loss (41.2%).
After the result is returned from the software, the result image can be edited to cor-rect misdetermined areas. For this purpose, editing feature of the software is used. User checks the correction of the result. Using the editing tool, misdetermined areas can be marked and changed in seconds
Figure 4.4 Example of editing result
Figure 4.4 is the example of editing the result image. In each editing, pixel coun-t and percencoun-tage recoun-turned from coun-the sofcoun-tware seems coun-to be correccoun-t according coun-to resulcoun-ts
To edit the result image, user marks the area that editing will be applied. User sees the count of pixels inside the marked area. With the count, button for chang-ing the pixels becomes visible. User can draw the pixels inside the marked area with MGD or NO-MGD color.
5.
TESTING AND VALIDATION
For validation, knowing the correctness of the numbers and the percentages returned from the software is important. As the final product, a reliable software is expected. For this reason, numbers and percentages must be checked using a logical validation method. Following figure represents results from different methods in the backend and the frontend of the software. Result on the left is from server side while on the right is from frontend. Both method are giving the same result.
Figure 5.1 Validation of Number and Ratio
Calculation of percentages for the method in frontend is as following. According to percentages, software is giving a consistent output.
Percentage of Green = (36636 / (36636 + 24810)) * 100 = 59.6%
Percentage of Area of Loss = (24810 / (36636 + 24810)) * 100 = 40.4%
In addition to testing and validation, a formal method is needed for comparing the results of manual determination with the result of automated detection. As the method, correlation plot and Bland&Altman method are used. Using the Area of loss, needed variables are calculated and plot is drawn.