RESEARCH ARTICLE
Automated computer-aided diagnosis of splenic lesions due to abdominal trauma
Teomete U
1, Tulum G
2, Ergin T
3, Cuce F
3, Koksal M
5, Dandin
4O, Osman O
21Department of Radiology, Sparrow Health System, Michigan, USA
2Department of Electrical and Electronics Eng, Istanbul Arel University, Istanbul 3Department of Radiology
4Department of General Surgery Gulhane Research and Training Hospital
5Department of Radiology, Ankara Numune Training and Research Hospital Ankara, Turkey
Abstract:
Background: Computer-aided detection in the setting of trauma presents unique challenges due to variations in shape and attenuation of the injured organs based on the timing and severity of the injury. We developed and validated an automated computer-aided diagnosis algorithm to detect splenic lesions such as laceration, contusion, subcapsular he-matoma, perisplenic hehe-matoma, and active extravasation using computed tomography (CT) images in patients sustaining blunt or penetrating abdominal trauma.
Methods: We categorized the splenic pathologies into three groups: contusion/laceration, hematoma, and active ex-travasation. We first analyzed the spleen and perisplenic region by estimating the mean value and standard deviation of the spleen. We determined adaptive threshold values based on the histogram of the area and detected the lesions after morphological operations and volumetric comparisons.
Results: The overall performance of the three computer-aided diagnosis (CAD) algorithms is an accuracy of 0.80, sen-sitivity of 0.95, specificity of 0.67, and a diagnostic odds ratio (DOR) of 40 with a 95 % confidence interval (CI): 14 to 117. The CAD of perisplenic hematoma had the highest diagnosis rates with an accuracy of 0.90, a sensitivity of 0.95, specificity of 0.80, and DOR of 76 with a 95 % CI: 13 to 442.
Conclusions: We developed a new algorithm to detect post-traumatic splenic lesions automatically and with high ac-curacy. Our method could potentially lead to the automated diagnosis of all traumatic abdominal pathologies.
HIPPOKRATIA 2018, 22(2): 80-85
Keywords: Trauma, solid organ injuries, computer-aided diagnosis
Corresponding author: Uygar Teomete, Department of Radiology, Sparrow Health System, 1215 E Michigan Ave Lansing, MI 48912 USA, tel: +13052981617, e-mail: [email protected]
Introduction
Trauma is the most frequent cause of mortality and morbidity1,2 among all age groups and is the leading cause of death before the age of 403. Trauma poses a crucial universal health problem for all socioeconomic classes4,5. The abdomen ranks as the third most common site of in-jury following trauma. The spleen is the most commonly injured solid organ. Surgical exploration rate following abdominal trauma is 25 %6,7. The death rate following blunt or penetrating trauma varies between seven and ten per cent8,9. In a study of Hildebrand, severe intraperito-neal bleeding due to multi-organ trauma was found to be the most common reason for early deaths. They reported a mortality rate of 42 % due to blunt abdominal injury10. Although various diagnostic methods are used to detect intraperitoneal traumatic lesions, computed tomography (CT) is a more specific and sensitive diagnostic tool in
trauma patients compared to conventional radiography or ultrasonography11-15.
Computer-aided artificial intelligence systems have been evolving from experimental to clinical applications and implementations in radiology over the last decade. Especially rapidly improving the performance of the deep learning techniques will make them powerful tools for segmentation16,17, classification18,19, lesion/nodule detection20,21, and computer-aided diagnosis (CAD)22,23 systems. By taking advantage of these innovations, ra-diologists can increase diagnostic accuracy in their inter-pretations with fewer false positives and identify lesion/ nodule patterns that may easily evade from human eyes. Also, these computer-aided systems can aid the automat-ed detection of repetitive tasks such as nodule detection. The CAD has a powerful potential to streamline the radiologic diagnosis in the emergency department, where
a rapid and accurate diagnosis can be lifesaving. In busy emergency departments with high patient volume, issues with timely availability of the radiologist, and turnaround time for the radiologic diagnosis may significantly affect patient outcome. In our previous work, the only study in the literature using traumatized spleens, we introduced a new method for automated computer-aided segmentation of the injured spleen due to blunt or penetrating abdomi-nal trauma with high accuracy24. The proposed method efficiently overcame challenges such as shape and den-sity differences of the spleen on CT images.
We aim to develop and validate a robust method de-tecting traumatic splenic lesions such as laceration, con-tusion, perisplenic fluid, and active extravasation. Materials and Methods
Study population and assessment of the CT images Institutional Review Board (IRB) of the University of Ankara Numune Training and Research Hospital (IRB No E-16-1143/2016, 14/12/2016) approved this study and waived the requirement for informed consent due to the retrospective study design. We collected data of thir-ty-six patients presenting to the emergency department sustaining abdominal trauma between January 2017 and April 2018. We excluded four subjects younger than 18 years of age (motor vehicle accident) and two with image motion artifacts from this study. Our study group con-sisted of thirty subjects sustaining blunt and penetrating abdominal trauma who underwent abdominal CT scans.
We used a standardized CT scanning protocol for pa-tients with abdominal trauma. CT scans were acquired when the subjects were hemodynamically stable. The CT studies were performed on Toshiba Aquilion 64 mul-tidetector CT scanner (Toshiba America Medical Sys-tems, Tustin, CA, USA). One hundred mL of intravenous contrast was administered using a power injector (Ulrich GmbH & Co., Ulm, Germany) in the arterial followed by portal venous phases using 3 mm slice thickness. Or-gan Injury Scale standardized by the American Associa-tion for the Surgery of Trauma (1994) was used to grade splenic injury using CT.
Three radiologists with over ten years of experience (Cuce F, Ergin T, Koksal M) had access to the patients’ history and status on initial admission but were blinded to the surgical report, follow up and outcome details as well as official CT report. They manually drew the splenic contours independently and made the final seg-mentation decision in agreement. They also detected and documented the associated pathologic findings, first indi-vidually and then in agreement. Inter-observer variability of manual segmentation of splenic contours and splenic pathologies were 0.15 % and 0.23 %, respectively. Method of detection lesions with CAD
We categorized the traumatic splenic pathologies into three groups: contusion/laceration, hematoma, and active extravasation. We used the portal venous phase to detect contusion/laceration and hematoma while we used the
ar-terial phase to assess active extravasations. Segmentation of the spleen is the first step before the comprehensive detection of pathology. We developed a segmentation method for injured spleens in24, as the first step of this study with the performance of volume overlap of 89.6 % ± 9.73, dice coefficient of 93.6 % ± 2.97, precision of 90.13 % ± 4.32, and sensitivity of 97.63 % ± 2.21; which was determined to be successful and sufficient to perform CAD of splenic pathologies.
Detection of contusion/laceration
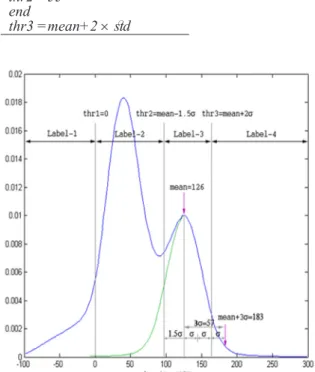
We used the binary images of the segmented spleen and the CT volume in the portal venous phase as the in-puts of the system. While investigating the density dis-tributions of the spleen and the perisplenic region, we ob-served that the density distributions exhibit two hills and the right hills represent the splenic parenchyma (Figure 1). We used the right half of the right hill to calculate the mean and standard deviation of splenic parenchyma den-sity distribution. The peak of the hill indicates the mean value, while one-third of the right tail yields the standard deviation. The endpoint of the tail is determined to be the last point along the right tail corresponding to one-tenth of the peak value. We determined three threshold values and four labels based on the mean value and standard de-viation. The pseudo code of the proposed thresholding method is as follows: thr1 =0 thr2 =mean-1.5 ´ std if thr2 <55 thr2 =55 end thr3 =mean+2 ´ std
Figure 1: Determination of adaptive threshold levels from the histogram of the spleen and perisplenic region. The peak of the green hill, 126 Hounsfield unit (HU), depicts the mean value and one-third of the right tail indicates the standard deviation (std). Threshold values were determined as threshold 1 =0, threshold 2 = mean-1.5 x std, threshold 3 = mean+2 x std.
The thresholding and labeling process, in one case is illustrated in Figure 1. The density of the peak value of the right hill, 126 HU, was taken as the mean value of the splenic parenchyma. One-tenth of the peak value corresponds to 183 HU on the right side, with a standard deviation s =19 HU. Label-3 indicated the density val-ues of the spleen and designated between mean -1.5s and mean +2s.
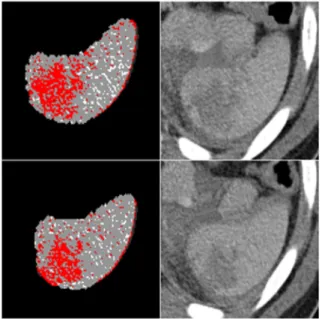
The second label indicated probable laceration/con-tusion areas and was marked as red in Figure 2 for two slices. We applied morphological operations such as ero-sion, dilation, opening, and closing to reduce the small hypodense areas corresponding to artifacts.
Both sides of the vessel connections are the possible false positive regions that mimic laceration. Therefore, hyperdense areas at the medial part of the spleen were detected and subtracted followed by morphological di-lation. We then analyzed the remaining portion of the second label and identified the connected components. We regarded components larger than 0.03 mL as contu-sion/laceration, while we classified others as an artifact. Detection of perisplenic hematoma
To detect perisplenic hematoma, we first magnified the splenic volume in three dimensions using morpho-logical operations; fourteen voxels in x and y Cartesian coordinates, one voxel to above the spleen and four voxels to under the spleen. Subtracting the original seg-mented splenic volume from the magnified splenic vol-ume revealed the perisplenic region. We applied the same thresholding levels and selected label-2 as region of in-terest (ROI) for hematoma. As an example, two slices of a case is displayed in Figure 3. The first column shows the output of thresholding and labeling, and the second
column shows the original Digital Imaging and Commu-nications in Medicine (DICOM) images with the label-2 indicated as green. After morphological operations, we performed a connected component analysis and calcu-lated the volumes of each component.
Here, we encountered two possible scenarios for the location and the volume of a hematoma. In the first sce-nario, the hematoma is large and covers almost the entire circumference of the spleen. In the second, the hematoma volume is small and appears only posterior to the spleen. In the first scenario, the volume of the largest component has to be more than 4 mL to be labeled as a hematoma. Figure 3 is an example of the first case scenario. In the second case, the largest component is between 0.4 and 4 mL, and the centroid of the largest component must be posterior to the spleen. In these cases, the hematoma commonly accumulated in the posterior aspect of the spleen.
Detection of active extravasation
To detect active extravasation, we used arterial phase and segmented spleen volume. We defined active extrav-asation as a small group of pixels outside the segmented spleen. Therefore, relatively dense and large foci (>0.3 mL) such as blood vessels, organs, and ribs were detected by connected component analysis followed by threshold-ing, using mean -0.5s as a level of threshold. Then these areas were removed, and only small and dense particles remained. In Figure 4, white areas indicate the regions higher than the threshold level, mean -0.5s. After remov-ing large components and intersectremov-ing with enlarged and threshold spleen region, green pixels remained.
Compo-Figure 2: Thresholding and labeling processes of two dif-ferent slices. Red regions indicate the label-2, the possible contusion/laceration areas.
Figure 3: Subtracting the original segmented splenic volume from the enlarged spleen (fourteen voxels in x and y Cartesian coordinates, one voxel to above the spleen and four voxels to under the spleen) revealed the perisplenic region. After thresh-olding, label-2, highlighted in green, was assumed as the region of interest (ROI) for periorgan hematoma.
nents having density values higher than 190 HU and foci less than 0.3 mL in volume were considered active ex-travasation and indicated as red. In Figure 4, the original images are shown in the first column, possible foci of ac-tive extravasation near the spleen are shown in the second column in green, and the foci that meet the last condition are detected as active extravasation and indicated in red, shown in the third column.
Results
We tested our proposed method in thirty subjects.
Twenty subjects had splenic trauma, and ten had other blunt organ traumas. Laceration/contusion was present in eighteen subjects; active extravasation was present in four and perisplenic hematoma in twenty cases. We validated the performance of our CAD method by cal-culating the accuracy, sensitivity, specificity, positive predictive value (PPV), negative predictive value (NPV), positive likelihood ratio (LR+), negative likelihood ratio (LR-), and diagnostic odds ratio (DOR) within 95 % con-fidence interval as displayed in Table 1.
The accuracy value is a metric that counts all positive
Figure 4: The first column: The original images. The second column: Possible active extravasation areas indicated in green. The third column: Detected active extravasation areas are indicated in red.
Table 1: Diagnosis performance of laceration/contusion, active extravasation, perisplenic hematoma, and all pathologies for the proposed computer-aided diagnosis (CAD) methods. The diagnosis indicators of overall performance of the three CAD algorithms are given at the last row.
Accuracy Sensitivity Specificity Positive pr
edictive
value (PPV) Negative pr
edic
-tive value (NPV) positive likelihood ratio (LR+) Negative likeli
-hood ratio ( LR-) Diagnostic odds ratio (DOR) 95% confidence interval (95% CI)
Laceration/contusion 0.77 0.94 0.50 0.74 0.86 1.89 0.11 17 3 - 84 Active extravasation 0.73 1.00 0.69 0.33 1.00 3.25 0.00 20 4 - 96 Perisplenic hematoma 0.90 0.95 0.80 0.90 0.89 4.75 0.06 76 13 - 442 All pathologies 0.80 0.95 0.67 0.71 0.94 2.86 0.07 40 14 - 117
and negative predictions. According to Table 1, accura-cies of all methods were between 73 % and 90 %, and the perisplenic hematoma diagnosis method had the highest accuracy. The specificity of the perisplenic hematoma di-agnosis had the highest value of 80 %. The PPV of the detection method for active extravasation of 33 % was less than that of other methods because of relatively high false positive (FP) value and the low number of active extravasation cases. NPVs of all the three methods were high, and there was no false prediction among the sub-jects without active extravasation.
LR+ pertains to the degree of probability of disease when the test is positive. On the other hand, LR- is a mea-sure of how much to decrease it when the test is negative. In diagnostic test results, LR+ values should be greater than one and LR- values should be less than one. In our test results, LR+ was between 1.89 - 4.75 and LR- was between 0.00 - 0.11.
For range estimates and significance testing, confi-dence intervals can be conventionally calculated using as-ymptotic standard error using the following formula25-27:
where SE is the standard error. We then obtained the 95 % confidence interval of the log DOR by using the formula:
We then obtained the confidence interval of the DOR by calculating the antilog of this expression.
DOR value of perisplenic hematoma diagnosis had the highest value with 76, indicating 76 times higher odds for positivity in subjects with perisplenic hematoma compared to odds for positivity among subjects without perisplenic hematoma.
Among these algorithms, CAD of perisplenic hema-toma had the highest rates of diagnosis as evidenced by high true positive (TP) and true negative (TN) as well as low false positive (FP) and false negative (FN) values.
Indicators of overall performance of the three CAD algorithms are given at the last row of Table 1 as accuracy of 0.80, sensitivity of 0.95, specificity of 0.67, PPV of 0.71, NPV of 0.94, LR+ of 2.86, LR- of 0.07, and DOR of 40 with a range of 14 - 117, 95 % of CI.
Discussion
Trauma is known as the leading cause of death before the age of 40, and overall is the fifth most common cause of mortality28. CT is crucial in the diagnosis of trauma. Successful diagnostic workup with CT, among other fac-tors, also depends on the timely availability of a trauma radiologist. Delay in diagnosis or missed radiological findings can have significant consequences29. Discordant clinical outcomes may warrant repeated CT examina-tions, increasing patient’s exposure to radiation, and io-dinated contrast agent30. Eventually, the result is the loss
of time, a vital concern for trauma patients, as well as an increase in mortality and morbidity.
As an emerging technology, CAD systems have great potential for providing accurate and rapid detection of lesions automatically or semi-automatically from medi-cal images. These systems can provide some additional information in daily clinical practice such as precise estimation of hematoma volume and intraperitoneal/ intracavitary bleeding, along with correlation with the patient’s hematocrit, assessment of viable or intact solid organ volume as well as the degree of the solid organ contusion and overall visceral perfusion. These systems can help radiologists detect subtle traumatic solid organ lesions and also help surgeons determine the operative or non-operative approach, surgery planning, and quantity of blood and fluid replacement.
In this study, we developed three CAD methods for automated diagnosis of contusion/laceration, hematoma, and active extravasation. We also obtained various per-formance metrics to validate developed methods. Our methods have a sensitivity of greater than 94 %. Howev-er, specificity values of the CAD of laceration/contusion and active extravasation were low due to a high number of false positives. Our method detected the small lacera-tions and contusions by applying low-level volumetric thresholds, resulting in a high false positive rate. The minuscule group of bright voxels in active extravasation makes detection difficult. Inhomogeneously enhancing segments of a thin vessel can be erroneously detected as active extravasation. We observed such segmentation er-rors, which increased both false positive rate and speci-ficity. In cases of perisplenic hematoma detection, both sensitivity and specificity rates were high due to high TP rate combined with low FN and low FP rate coupled with high TN rate.
The PPV of the active extravasation diagnosis meth-od was lower than other detection methmeth-ods at 33 % be-cause of the high FP rate and the small number of cases. NPVs of the three methods were high, and one for active extravasation, which means if the result is negative, it is correct in 100 % of the subjects.
LR+ and LR- values indicate the increase and crease percentages for the probability of pathology de-tection. All LR+ values were greater than one, showing an increase in the likelihood of pathology diagnosis ap-proximately between 15 % and 30 %. The LR- value decreases the probability of determination of pathology more than 45 %31.
DOR is an indicator of the effectiveness of a diag-nostic test15. Odds for positive result among subjects with laceration/contusion is 17 times higher than the odds for a positive outcome in subjects with no laceration/contu-sion. The odds for a positive result in cases with active extravasation is 20 times higher than the odds for positiv-ity among subjects with no active extravasation. Finally, the odds for a positive outcome among subjects with peri-splenic hematoma is 76 times higher than the odds for positivity among subjects with no perisplenic hematoma.
LR+ pertains to the degree of probability of disease when the test is positive. On the other hand, LR- is a measure of how much to decrease it when the test is negative. In diagnostic test results, LR+ values should be greater than one and LR- values should be less than one. In our test results, LR+ was between 1.89 - 4.75 and LR- was between 0.00 - 0.11.
For range estimates and significance testing, confidence intervals can be conventionally calculated using asymptotic standard error using the following formula25-27:
(1)
where SE is the standard error. We then obtained the 95 % confidence interval of the log DOR by using the formula:
(2)
We then obtained the confidence interval of the DOR by calculating the antilog of this expression.
DOR value of perisplenic hematoma diagnosis had the highest value with 76, indicating 76 times higher odds for positivity in subjects with perisplenic hematoma compared to odds for positivity among subjects without perisplenic hematoma.
Among these algorithms, CAD of perisplenic hematoma had the highest rates of diagnosis as evidenced by high true positive (TP) and true negative (TN) as well as low false positive (FP) and false negative (FN) values.
Indicators of overall performance of the three CAD algorithms are given at the last row of Table 1 as accuracy of 0.80, sensitivity of 0.95, specificity of 0.67, PPV of 0.71, NPV of 0.94, LR+ of 2.86, LR- of 0.07, and DOR of 40 with a range of 14 - 117, 95 % of CI.
Discussion
LR+ pertains to the degree of probability of disease when the test is positive. On the other hand, LR- is a measure of how much to decrease it when the test is negative. In diagnostic test results, LR+ values should be greater than one and LR- values should be less than one. In our test results, LR+ was between 1.89 - 4.75 and LR- was between 0.00 - 0.11.
For range estimates and significance testing, confidence intervals can be conventionally calculated using asymptotic standard error using the following formula25-27:
(1)
where SE is the standard error. We then obtained the 95 % confidence interval of the log DOR by using the formula:
(2)
We then obtained the confidence interval of the DOR by calculating the antilog of this expression.
DOR value of perisplenic hematoma diagnosis had the highest value with 76, indicating 76 times higher odds for positivity in subjects with perisplenic hematoma compared to odds for positivity among subjects without perisplenic hematoma.
Among these algorithms, CAD of perisplenic hematoma had the highest rates of diagnosis as evidenced by high true positive (TP) and true negative (TN) as well as low false positive (FP) and false negative (FN) values.
Indicators of overall performance of the three CAD algorithms are given at the last row of Table 1 as accuracy of 0.80, sensitivity of 0.95, specificity of 0.67, PPV of 0.71, NPV of 0.94, LR+ of 2.86, LR- of 0.07, and DOR of 40 with a range of 14 - 117, 95 % of CI.
Several other studies have been published about the segmentation of injured abdominal organs with limited cases. Davis ML et al, semi-automatically calculated from CT images the volume of thoracoabdominal in-jured organs following trauma32. Additionally, Rezai et al presented a semi-automatic calculation of traumatized kidney volume with surrounding perirenal hematoma in 18 cases without detailed explanation, especially about the segmentation of fragmented kidneys due to trauma33. Danelson KA et al presented a study about semi-automat-ically measuring the grade of splenic injuries based on CT images and concluded that, with minimal data inputs from users, measurement of injury volume was feasible though their study involved only five injured spleens34.
To best of our knowledge, there is no study published about automated detection of splenic injuries in the Eng-lish literature. Our proposed method can be further devel-oped to determine all traumatic intraabdominal injuries from CT images automatically.
Conflict of Interest
The authors declare no conflict of interest. References
1. Berger LR, Mohan D. Injury control: A global view. Oxford Uni-versity Press, Delhi, 1996, 1-34.
2. Potenza BM, Hoyt DB, Coimbra R, Fortlage D, Holbrook T, Hollingsworth-Fridlund P, et al. The epidemiology of serious and fatal injury in San Diego County over an 11-year period. J Trauma. 2004; 56: 68-75.
3. Baker S, O’neill B, Ginsburg M, Li G. The injury fact book. Oxford University Press, New York, 1992, 8-16.
4. Aldemir M, Taçyildiz I, Girgin S. Predicting factors for mortal-ity in the penetrating abdominal trauma. Acta Chir Belg. 2004; 104: 429-434.
5. Hoyert DL, Xu J. Deaths: Preliminary data for 2011. Natl Vital Stat Rep. 2012; 61: 1-51.
6. Townsend CM, Beauchamp RD, Evers BM, Mattox KL. Sabiston Text-Book of Surgery, the Biological Basis of Modern Surgical Practice. 18th edition. Elsevier-Saunders, Philadelphia, 2008, 512.
7. Hemmila MR, Wahl WL. Management of the Injured Patient. Doherty GM (ed), Current surgical diagnosis and treatment. McGraw-Hill Medical, New York, 2008, 227-228.
8. Fabian TC, Croce MA, Minard G, Bee TK, Cagiannos C, Miller PR, et al. Current issues in trauma. Curr Probl Surg. 2002; 39: 1160-1244.
9. Karamercan A, Yilmaz TU, Karamercan MA, Aytaç B. Blunt abdominal trauma: evaluation of diagnostic options and surgical outcomes. Ulus Travma Acil Cerrahi Derg. 2008; 14: 205-210. 10. Hildebrand F, Winkler M, van Griensven M, Probst C, Musahl V,
Krettek C, et al. Blunt abdominal trauma requiring laparotomy: an analysis of 342 polytraumatized patients. Eur J Trauma. 2006; 32: 430-438.
11. ACEP Clinical Policies Committee, Clinical Policies Subcom-mittee on Acute Blunt Abdominal Trauma. Clinical policy: Criti-cal issues in the evaluation of adult patients presenting to the emergency department with acute blunt abdominal trauma. Ann Emerg Med. 2004; 43: 278-290.
12. Chiu WC, Cushing BM, Rodriguez A, Ho SM, Mirvis SE, Shan-muganathan K, et al. Abdominal injuries without hemoperito-neum: a potential limitation of focused abdominal sonography for trauma (FAST). J Trauma. 1997; 42: 617-625.
13. Hauser CJ, Visvikis G, Hinrichs C, Eber CD, Cho K, Lavery RF, et al. Prospective validation of computed tomographic screening of the thoracolumbar spine in trauma. J Trauma. 2003; 55:
228-235.
14. Poletti PA, Wintermark M, Schnyder P, Becker CD. Traumatic injuries: the role of imaging in the management of the poly-trauma victim (conservative expectation). Eur Radiol. 2002; 12: 969-978.
15. Shanmuganathan K, Mirvis SE, Sherbourne CD, Chiu WC, Ro-driguez A. Hemoperitoneum as the sole indicator of abdominal visceral injuries: a potential limitation of screening abdominal US for trauma. Radiology. 1999; 212: 423-430.
16. Wang Y, Qiu Y, Thai T, Moore K, Liu H, Zheng B. A two-step convolutional neural network based computer-aided detection scheme for automatically segmenting adipose tissue volume depicting on CT images. Comput Methods Programs Biomed. 2017; 144: 97-104.
17. Moeskops P, Viergever MA, Mendrik AM, de Vries LS, Bend-ers MJ, Isgum I. Automatic Segmentation of MR Brain Images With a Convolutional Neural Network. IEEE Trans Med Imag-ing. 2016; 35: 1252-1261.
18. Burns JE, Yao J, Muñoz H, Summers RM. Automated Detection, Localization, and Classification of Traumatic Vertebral Body Fractures in the Thoracic and Lumbar Spine at CT. Radiology. 2016; 278: 64-73.
19. Anthimopoulos M, Christodoulidis S, Ebner L, Christe A, Mou-giakakou S. Lung Pattern Classification for Interstitial Lung Diseases Using a Deep Convolutional Neural Network. IEEE Trans Med Imaging. 2016; 35: 1207-1216.
20. Kooi T, Litjens G, van Ginneken B, Gubern-Mérida A, Sánchez CI, Mann R, et al. Large scale deep learning for computer aided detection of mammographic lesions. Med Image Anal. 2017; 35: 303-312.
21. Setio AA, Ciompi F, Litjens G, Gerke P, Jacobs C, Van Riel SJ, et al. Pulmonary Nodule Detection in CT Images: False Positive Reduction Using Multi-View Convolutional Networks. IEEE Trans Med Imaging. 2016; 35: 1160-1169.
22. Cheng JZ, Ni D, Chou YH, Qin J, Tiu CM, Chang YC, et al. Computer-Aided Diagnosis with Deep Learning Architecture: Applications to Breast Lesions in US Images and Pulmonary Nodules in CT Scans. Sci Rep. 2016; 6: 24454.
23. Suk HI, Lee SW, Shen D, Alzheimer’s Disease Neuroimaging Initiative. Deep ensemble learning of sparse regression models for brain disease diagnosis. Med Image Anal. 2017; 37:101-113. 24. Dandin O, Teomete U, Osman O, Tulum G, Ergin T, Sabunc-uoglu MZ. Automated segmentation of the injured spleen. Int J Comput Assist Radiol Surg. 2016; 11: 351-368.
25. Glas AS, Lijmer JG, Prins MH, Bonsel GJ, Bossuyt PM. The diagnostic odds ratio: a single indicator of test performance. J Clin Epidemiol. 2003; 56: 1129-1135.
26. Altman DG. Practical statistics for medical research. Chapman & Hall/ CRC, Florida, 1997, 229-276.
27. Bland JM, Altman DG. Statistics notes. The odds ratio. BMJ. 2000; 320: 1468.
28. Cherkasov M, Sitnikov V, Sarkisyan B, Degtirev O, Turbin M, Yakuba A. Laparoscopy versus laparotomy in the management of abdominal trauma. Surg Endosc. 2008; 22: 228-231. 29. Sung CK, Kim KH. Missed injuries in abdominal trauma. J
Trauma. 1996; 41: 276-282.
30. Farach SM, Danielson PD, Amankwah EK, Chandler NM. Re-peat computed tomography scans after pediatric trauma: results of an institutional effort to minimize radiation exposure. Pediatr Surg Int. 2015; 31 :1027-1033.
31. McGee S. Simplifying likelihood ratios. J Gen Intern Med. 2002; 17: 646-649.
32. Davis ML, Stitzel JD, Gayzik FS. Thoracoabdominal organ vol-umes for small women. Traffic Inj Prev. 2015; 16: 611-617. 33. Rezai P, Tochetto S, Galizia M, Yaghmai V. Perinephric
hema-toma: semi-automated quantification of volume on MDCT: a feasibility study. Abdom Imaging. 2011; 36: 222-227.
34. Danelson KA, Hoth JJ, Miller PR, Stitzel JD. A semi-automated approach for measuring splenic injury using computed tomogra-phy. Biomed Sci Instrum. 2007; 43: 13-17.