185
ARAŞTIRMA MAKALESİ / RESEARCH ARTICLE
EXPERİMENTAL STUDY THE İNFLUENCE OF SURFACE SHAPE AND ROUGHNESS OF DİFFERENT MATERİALS ON THERMAL CONTACT CONDUCTANCE İN SİNGLE AND
MULTİLAYERS WALL Laith Yahya AWAD1
School of Engineering and Natural Sciences, Altinbas University, Istanbul-Turkey [email protected] ORCID: 0000-0001-5954-2531
Ibrahim KOÇ2
School of Engineering and Natural Sciences, Altinbas University, Istanbul-Turkey [email protected] ORCID: 0000-0002-1379-7093
Salah Kareem JAWAD3
Production and Meteorology Department, University of Technology, Baghdad-Iraq [email protected] ORCID: 0000-0002-2875-1450
GELİŞ TARİHİ/RECEIVED DATE: 28.08.2020 KABUL TARİHİ/ACCEPTED DATE: 26.12.2020
Abstract
This paper presents an experimental study, the purpose of which is to know the effect of surface shape on the thermal contact conductance of two solid specimens bonded to each other. The experiment was carried out by placing copper and aluminum specimens in an electric furnace, isolating the surroundings of these specimens and measuring the temperatures at the contact surfaces of the samples. The aluminum specimens used in this study have different surfaces (some specimens have extended surfaces). The experimental results found variations in temperature distribution due to the difference in surface form, by which the aluminum thermal conductivity can be measured at various temperatures ranging from 100oC to 300oC. The results
showed the efficiency and effectiveness of extended surfaces and their effect in enhancing heat transfer.
Keyword: Thermal conductivity, Thermal contact conductance, Thermal contact resistance, Extended surfaces. FARKLI MALZEMELERİN YÜZEY ŞEKLİ VE PÜRÜZLÜLÜĞÜNÜN TERMAL TEMAS
İLETKENLİĞİNE ETKİSİ İÇİN DENEYSEL BİR ÇALIŞMA
Özet
Bu makale, birbirine temas eden iki katı numunenin, yüzey şeklinin ısıl temas iletkenliği üzerindeki etkisini bulmayı amaçlayan deneysel bir çalışmayı sunar. Deney, bakır ve alüminyum numuneleri bir elektrikli fırına yerleştirerek, bu numunelerin çevresini izole ederek ve numunelerin temas yüzeylerindeki sıcaklıkları ölçülerek gerçekleştirilmiştir. Bu çalışmada kullanılan alüminyum numunelerin farklı yüzeyleri vardır (bazı numuneler geniş yüzeylere sahiptir). Deneysel sonuçlar, yüzey formundaki farklılığa bağlı olarak sıcaklık dağılımında farklılıklar buldu; bu sayede alüminyum termal iletkenlik 100°C ila 300°C arasında değişen çeşitli sıcaklıklarda ölçülebilir. Sonuçlar, uzatılmış yüzeylerin verimliliğini ve etkililiğini ve ısı transferini artırmadaki etkilerini gösterdi.
186
1. Introduction
Heat transfer is one of the important fields where researchers have focused on the transfer of heat because it deals with a wide range of applications (Sahu, M., Sahu, G., Sao, and Jain, 2018). Knowledge of the thermal properties of materials used in various applications is very important to obtain effective design, and at the same time, it is low cost (Patle, 2006). Heat conduction is one of the mechanisms of heat transfer that occurs due to the difference in temperature between two contacting bodies (Holmen, 2008). Depending on the material state (solid or liquid) many devices are used to measure the thermal properties (such as thermal conductivity) of the materials. The measuring technique is classified into two types: firstly, the steady-state technique, which is achieved when the specimen reached a thermal equilibrium state. The second technique, called the transient method, start measuring when the specimen temperature reaches the desired temperature (Kerschbaumer et al., 2019). The methods used by the researchers in their studies to measure the thermal properties of different materials and their effects will be identified through the following literature:
Yuwang (2017) measured the thermal conductivity by using a hot disk device to stainless steel beads and glass beads with different particle sizes and analysis of the effect of moisture on the results of measuring the thermal conductivity.
Jin sung (2018) has developed a device to measure the insulation performance using a heat flow meter, through which the thermal conductivity of gases is measured.
Ross (2018) measured the thermal properties of samples using the optical heat deviation spectroscopy. Through this transient method, the laser can be used to heat the sample. The beam of electromagnetic radiation energy is converted into thermal energy that leads to moderate temperature grades through which the sample temperature can be known.
Christoph (2019) calculated fluid temperatures using a differential scanning calorimeter for temperatures of up to 270 ° C. Through which liquid mass flow rate and the temperature difference can be known along with the concentrated solar energy.
Courtney (2019) studied used a needle probe technique to measure the thermal properties of stainless steel with diameters ranging from 10 mm to 30 mm. Thermal conductivity was determined, with resistance to thermal contact. The mean standard error of 0.501 K.
Andallib (2016) conducted an experimental study to evaluate the thermal conductivity of two contact samples using the steady-state method. The materials used are copper, aluminum, and stainless steel. The thermal conductivity of flat planar surfaces with a roughness of 1-5 ηm is calculated with the effect of roughness on the thermal contact conductance.
The purpose of this study is to find a system capable of calculating the thermal properties of solid materials and at different temperatures. This study contributed to finding comparisons between specimens having different extended surfaces and studying their effect on heat transfer.
187 2. Theory
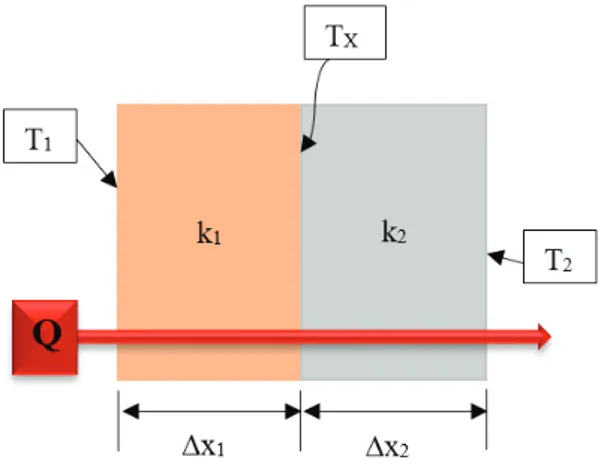
The current study is focused upon tight contact between two solid specimens. Heat transfer occurs as a result of heating the specimen, which leads to the transfer of heat energy through it. The rate of heat can be calculated from the following equation(Incropera, 2011):
(1) Where Q is the rate of heat (W), k is the thermal conductivity (W/m.oC), A is the area (m2), (T
2-T1) is the
temperature difference (oC), ∆x is the thickness (m).
Since the two specimens are in contact, the thermal energy in the first specimen is the same as the thermal energy in the second specimen, as shown in Figure 1. This is indicated by the following equation (2):
Figure 1. Scheme of heat transfer between two solid specimens
(2) Where Q1 is the heat rate of the copper specimen, Q2 is the heat rate of the aluminum specimen. The first specimen of copper has a thermal conductivity k1 known in previously (standard), and thus the thermal conductivity k2 of the aluminum specimen can be found by applying the following equation:
188
2.1 Thermal contact between specimens
Perfect contact between two specimens enhancing heat transfer. Researchers are always trying to find perfect contact between specimens by trying to create very smooth surfaces. The difficulty is always with the presence of relative roughness that leads to the formation of air gaps that resist the transfer of heat from one specimen to another. These gaps reduce the temperature in the interface area between the specimens. In this study, the temperature in the interface area between the specimens was considered equal by models with very smooth surfaces. Also, a thermal oil was placed between the specimens to prevent the formation of air gaps, and thus we can maintain the temperature in the area of the specimens equal(Cengel, 2006).
Thermal contact conductance between the specimens in the interface area can be calculated using the following equation[(Cengel, 2006):
(4) Where hc is the thermal contact conductance (W/m2.oC).
The concept of thermal contact resistance is the opposite of thermal contact between specimens, which can be determined through the following equation(Cengel, 2006):
(5) Where Rc is the thermal contact resistance (m2.oC/W)
2.2 Extended surfaces
Extended surfaces are used in many applications, to optimize the heat transfer generated within the components. Extended surfaces have different shapes, including cylindrical, rectangular, and other shapes. In choosing extended surfaces, consideration must be given to the length and height of the extended surface due to its effect on its efficiency and effectiveness(Jeon, Ngo, and Byon, 2016). Understanding that the temperature varies along the extended surface is important because the efficiency of the extended surface can be determined from the following equation(Cengel, 2006):
(6) Where: ηf is the fin efficiency, Qf is the actual heat transfer rate (W), Qfin, max is the ideal heat transfer rate (W). Another indicator is the effectiveness of the extended surface, from which thermal performance can be measured. This happens with the following equation applied(Cengel, 2006):
189
(7) Where ɛf is the fin effectiveness.
3. Experimental study
An important part of this research is experimental work because it produces practical results. This research is focused on building an integrated system capable of evaluating specimen thermal properties by distributing measured temperatures to control experimental parameters using accurate and calibrated sensors.
3.1 Experimental devices
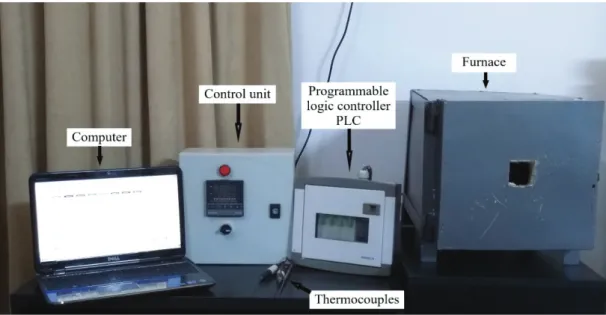
The experimental devices for this study shown in Figure 2 consists of a group of major components aimed at measuring the temperature of some selected specimens. First: A rectangular electrical furnace consisting of a chamber for heating specimens by heating the wires distributed on its internal walls. The temperature sensor is placed on the back wall, with a channel in the furnace gate to put specimens. This furnace is characterized by rapid heating and the ability to maintain internal temperature due to the existing thermal insulators. Secondly: A control unit containing a digital screen whose function is to set the furnace temperature at the required degree. Third: Thermocouple Type-K are known for their good sensitivity and are placed in the required positions to measure the temperature of the specimens, and on the other side the thermocouples are connected to a programmable logic control unit. Fourth: A programmable logical controller.
190
3.2 Specimens
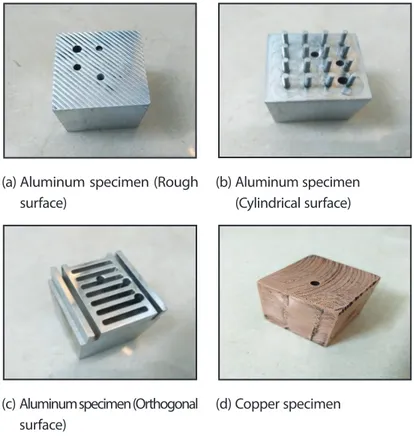
The specimens used in this study are aluminum and copper as shown in Figure 3.
(a) Aluminum specimen (Rough surface)
(b) Aluminum specimen (Cylindrical surface)
(c) Aluminum specimen (Orthogonal surface)
(d) Copper specimen
Figure 3. Copper and aluminum specimens
The known thermal conductivity of copper is shown in Table 1, in addition to three specimens of aluminum with different surfaces. The first specimen has a rough surface of 40 mm in length, 40 mm in width and 40 mm in height. The second specimen has a cylindrical extended surface and has the same dimensions as the first specimen. As for the dimensions of the extended surface, it is 10 mm long and 2.5 mm in diameter. The third specimen is composed of vertical and horizontal extended surfaces, which are called orthogonal and have the same previous dimensions. Also, the extended surface length is 10 mm and a thickness of 2.5 mm.
Table 1. Thermal conductivity of copper (Ho, Powell, and Liley, 1968)
Temperature (oC) 100 150 200 250 300
191 3.3 Test procedure
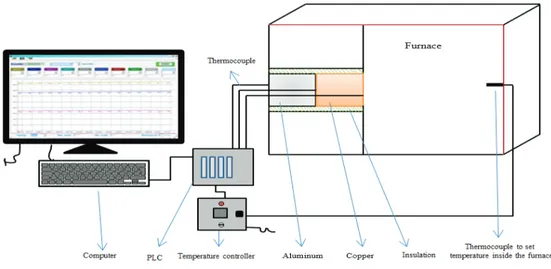
The testing mechanism includes an ideal connection of two copper and aluminum specimens through optimal insulation to ensure that the heat flows in an axial direction with thermal oil placed in the interface area. After that, the test specimen is placed in the gap in the furnace gate shown in Figure 4. Then the thermocouples are placed in the required positions. The furnace temperature is set according to the required temperature by the control unit. After heating the furnace, the program that was installed on the personal computer is started. Through the program, it can be observed that the temperature of the specimens increases over time.
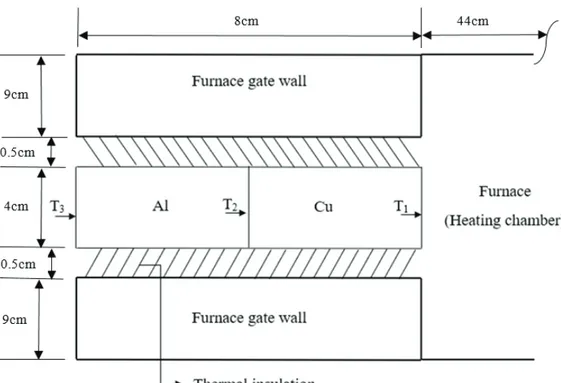
Figure 4. Scheme of experimental study
Figure 5 represents a simple scheme for placing the thermocouples inside the specimens to be temperature measured. (T1) indicates the temperature of the surface of the copper specimen facing the heat source. (T2) indicates the temperature in the interface between the two specimens. (T3) indicates the surface temperature of the aluminum specimen facing the surrounding.
192 Figure 5. The scheme of the locations of the thermocouples 4. Results and discussion
Based on the experimental results obtained through this study, Figure 6 shows a comparison between the standard values and the experimental results of the thermal conductivity coefficient of the aluminum specimens used in this work, as the results were close between them.
193
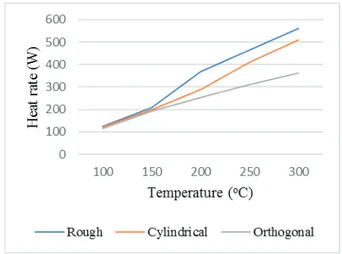
Figure 7 shows the variation in the rate of heat for specimens at different temperatures. The figure shows a convergence in the rate of heat transferred, with a slight increase in the rough surface aluminum specimen, which reached 562.436W when the source temperature was 300oC. While the rate of heat
transferred in the cylindrical specimen was 510.892W and in the orthogonal specimen it was 360.808W. By figure, a specimen with a rough surface is better conduction than other specimens that have complex extended surfaces.
Figure 7. The heat rate of aluminum specimens at different temperatures
Figure 8 shows the temperature and thickness relationship of two copper and aluminum contact specimens at a constant heat source of 300oC. Through the figure, the temperature decreases when the
thickness increases. The surface temperature of the specimen facing the heat source is 193.7oC, while the
temperature drops to 169.9oC when the thickness is 40 mm. When increasing the thickness to 80 mm,
the temperature decreases to 130.1oC.
Figure 8. The relationship between the temperature and thickness of two copper + aluminum specimens at a
194
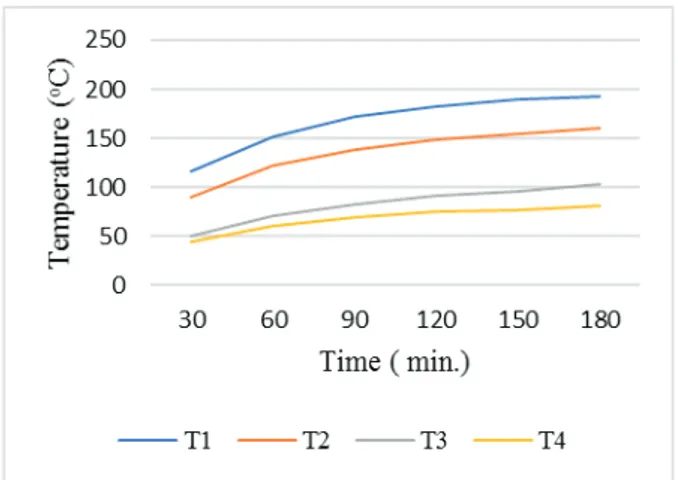
Figure 9, Figure 10 and Figure 11 show the temperature distribution of two copper and aluminum specimens in contact during a time when the source temperature is 300C. Figure 9, two copper specimen, and other aluminum specimen with a rough surface are placed in contact. It is clear from the figure that the surface temperature of the copper specimen facing the heat source reached T1=199oC and in the
interface area between the two specimens it reached T2=161.9oC while the temperature reached the surface
of the aluminum specimen facing the surrounding was T3=99.1oC. Figure 10 A copper specimen and an
aluminum specimen were placed with a cylindrical extended surface, and the temperature distribution was as follows T1=193.4oC, T
2=159.7oC, T3=103.6oC, T4=81.5oC, while Figure 11 shows the temperature
distribution of a specimen of copper and another of aluminum having an orthogonal extended surface as shown T1=193.7oC, T
2=169.9oC, T3=130.1oC, T4=100.1oC. (T4) represents the temperature at the end of
the extended surface.
Figure 9. The temperature distribution of two contacting specimens (copper + aluminum with rough surface) at a
constant temperature of 300oC
Figure 10. The temperature distribution of two contacting specimens ( copper + aluminum with cylindrical
195 Figure 11. The temperature distribution of two contacting specimens ( copper + aluminum with orthogonal
extended surface ) at a constant temperature of 300oC
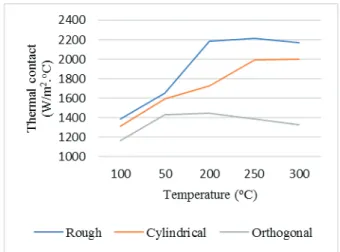
Figure 12 shows the variation in thermal contact values between specimens at different temperatures. The experimental results showed that the value of thermal contact of the specimen with the rough surface, which reached its value 2171.23 W/m2.oC, is higher than that of the other specimens with extended
surfaces (cylindrical 1999.42 W/m2.oC, orthogonal 1327.28 W/m2.oC), and these values are at a constant
heat source 300oC. The reason for this is due to the effect of surface shape in terms of cross-sectional
area and extended surface length.
Figure 12. The relationship between thermal contact and temperature for different specimens
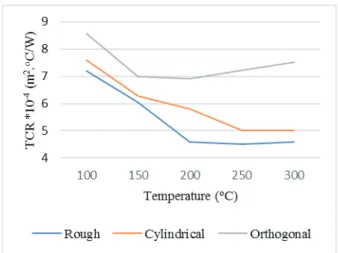
Figure 13 shows that there is very little resistance to thermal contact between specimens due to the influence of the thermal oil used in the contact area that prevents the formation of air gaps caused by the relative roughness of the specimens affecting the thermal contact.
196
Figure 13. The effect of thermal contact resistance TCR on temperature distribution
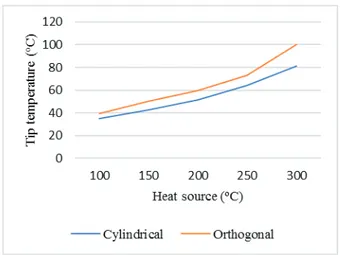
Figure 14 and Figure 15 shows the comparison of the temperature distribution between two aluminum specimens with cylindrical and orthogonal extended surfaces at different source temperatures. Through experimental results and a constant heat source 300oC, the temperature of the base and the
tip of the orthogonal extended surface (Tbase=130.1oC, T
tip=100.1oC) is higher than the temperature
of the base and the tip of the extended cylindrical surface (Tbase=103.6oC, T
tip=81.5oC). The reason for
the difference in temperature is the difference in the cross-sectional area of the extended surface and its thickness.
197 Figure 15. Comparison of temperature of extended surface specimens at the tip
Figure 16 and Figure 17 illustrate the comparison of effectiveness and efficiency of cylindrical and orthogonal extended surfaces of two aluminum specimens. Figure 16shows that the efficiency of the extended surfaces of the two specimens is high due to the short of the extended surface (cylindrical extended surface 0.997, orthogonal extended surface 0.988), as the longer the length of the extended surface the less efficient. While Figure 17 shows the difference between the effectiveness of the extended surface. Through experimental results, the effectiveness of the orthogonal extended surface 5.928 is higher than the effectiveness of the cylindrical extended surface 0.828, due to the increased cross-sectional area and thickness.
198
Figure 17. Comparison between the effectiveness of the extended surfaces of aluminum specimens 5. Conclusion
Based on the results reached through this experimental study, the system can measure the thermal properties of the various samples. The effect of thermal contact resistance between samples resulting from air gaps can be reduced by using thermal oil, which in turn leads to increased thermal contact between samples. The thickness of the influence of the sample in reducing heat transfer because it is inversely proportional to the rate of heat. Extended surfaces have a major role to play in improving heat transfer, but their efficiency and effectiveness differ. The efficiency of the extended surfaces increases with short lengths. The effectiveness of extended surfaces varies with the variation of cross-sectional area and thickness.
References
Cengel, Y.A. 2006. Heat Transfer: A Practical Approach, Second edi. 37(9), 61–65.
Fontenot, R. S., V.K. Mathur, and J.H. Barkyoumb. 2018. New photothermal deflection technique to discriminate between heating and cooling. Journal of Quantitative Spectroscopy and Radiative Transfer 204, 1-6.
Hilgert, C., F. Howar, and M. Röger. 2019. Flow through calorimeter to measure fluid heat capacity in CSP applications. Solar Energy, 194, 804-814.
Ho, C.Y., R.W. Powell, and P.E. Liley. 1968. Thermal Conductivity of Selected Materials Part 2. U.S. Department of Commerce, National Bureau of Standards, Washington, 168.
Hollar, C., A. Fleming, K. Davis, R. Budwig, C. Jensen, and D. Estrada. 2019. A parametric study for in-pile use of the thermal conductivity needle probe using a transient, multilayered analytical model. International Journal of Thermal Sciences, 145, 106028.
199 Holman, J. P. 2008. Useful Conversion Factors, Heat Transfer Tenth ed., McGraw Hill, New York.
Incropera, F. P. 2011. Fundamentals of heat and mass transfer, Seventh ed., New York.
Jeon, S.W., Ngo, I., and Byon, C. 2016. Numerical study on heat transfer performance of wavy fins with different geometries 40(11), 737–744.
Kerschbaumer, R. C, S. Stieger, M. Gschwandl, T. Hutterer, M. Fasching, B. Lechner, L. Meinhart, J. Hildenbrandt, B. Schrittesser, P.F. Fuchs, G.R. Berger and W. Friesenbichler. 2019. Comparison of steady-state and transient thermal conductivity testing methods using different industrial rubber compounds. Polymer Testing, 80, 106121.
Lee, J. S., K.S. Kim, and Y. Kim. 2018. Development of an insulation performance measurement unit for full-scale LNG cargo containment system using heat flow meter method. International Journal of Naval Architecture and Ocean Engineering 10(4), 458–467.
Liu, Y., M. Yu, Y. Tian, and Q. Qin. 2017. Study of thermal conductivity measurement accuracy of wet porous media. Procedia Engineering, 205, 1755–1761.
Patle, S.D. 2006. Analysis and measurement of thermophysical properties by temperature oscillation. National Institute Of Technology Rourkela, India, 1–135.
Sahu, M., G.C. Sahu, M. Sao, and A.K. Jain. 2018. Analysis of Heat Transfer From Fins Using Finite Difference Method, International Journal Of Advance Research, Ideas And Innovations In Technology, 4(1), 261–269. Tariq, A., and M. Asif. 2016. Experimental investigation of thermal contact conductance for nominally flat metallic contact, Heat Mass Transf. und Stoffuebertragung 52(2), 291–307.