Bank Efficiency and Stock Returns in the Turkish Stock Market:
A Two-stage Analysis Approach
Süleyman Kale1 Mehmet Hasan Eken2 İ. Gökçe Kaya31. Introduction
In parallel with the importance of a well-functioning financial sector in a country, the bank-ing sector has always been at the centre of the interest of researchers. This study focuses on the relationship between the efficiencies of banks and their stock returns in the Turkish banking industry. For this purpose, the possible effects of multiple dimensions of efficiencies on stock returns are investigated. Related to this, firstly, the measurement methods of bank efficiencies are identified. After that, the features of progressing paths of efficiencies in Turkish economic environment are determined for the analysed period. Thirdly, the relationship between effi-ciencies and stock returns is measured using panel dynamic models. Finally, whether the rela-tionship differs in the short-run or long run is researched.
1 Doç. Dr., Kırklareli Üniversitesi, UBYO, Bankacılık ve Finans Bölümü. [email protected], ORCID: https://or-cid.org/0000-0001-7208-1872.
2 Prof. Dr., Kırklareli Üniversitesi, UBYO, Bankacılık ve Finans Bölümü. [email protected], ORCID: https://or-cid.org/0000-0002-6005-7637.
3 Dr. Öğr. Üyesi, İstanbul Gelişim Üniversitesi, İİBF, Uluslararasi Lojistik ve Taşımacılık Bölümü. [email protected], ORCID: https://orcid.org/0000-0002-2949-2147.
Türk Hisse Senetleri Piyasasında Banka Etkinliği ve Getiri: İki Aşamalı Bir Analiz
Öz
Bu çalışamada, 2002-2017 döneminde Türk hisse senedi piyasalarında, banka etkinliğindeki değişimin getiriler üzerinde etkili olup olmadığı, araştırılmaktadır. Önce Malmquist Verimlikilik Endeksi ile etkinlik farklı boyutları ile hesaplanmış; daha sonra statik ve dinamik panel veri yönetmleri ile etkinlik değişiminin etkileri incelenmiştir. İlk aşama, banklarda etkinliğin 2010 yılına kadar arttığını, sonrasında önemli derecede azaldığını göstermektedir. İkinci aşama, piyasanın ve etkinlikteki değişimin getiri üzerinde etkili olduğunu ortaya koymuştur. Karlılık etkin-liği uzun dönemde olumlu; diğer taraftan aracılık etkinetkin-liği kısa dönemde olumlu ancak uzun dönemde olumsuz etkiye sahiptir. Bu durum aracılık etkinliğinin artması so-nucu uzun vadede takipteki kredi oranının artması ve karlığın azalması ile açıklanabilir.
Bank Efficiency and Stock Returns in the Turkish Stock Market: A Two-stage Analysis Approach
Abstract
This study researches the effects of bank efficiency changes of returns in Turkish stock markets using a two-stage model for the period of 2002-2017. First, Malmquist Productive Index is employed to measure the different di-mensions of efficiency; then, static and dynamic panel data models are used to investigate the effects of effi-ciency changes. First stage indicates that effieffi-ciency in-creased until 2010, and then a considerable decrease was observed. Second stage proves that together with market itself efficiency change has explanatory power on stock return. Effect of increase in profitability efficiency is itive in the long run while effect of intermediation is pos-itive in the short but negative in the long run. This may be explained with the side effects of increasing intermedia-tion in the short run as the increasing non-performing loans and decreasing profitability in the long run. Anahtar Kelimeler: Veri Zarflama Analizi; Malmquist
Verimlilik Endeksi; Panel ARDL; PMG; banka etkinliği ve hisse senedi getirisi.
Keywords: Data Envelopment Aanalysis; Malmquist Productivity Index; Panel ARDL; PMG; bank efficiency and stock returns.
Başvuru : 17.10.2018 Kabul : 01.04.2020
Financial development is assumed to trigger economic growth, and almost all govern-ments/regulatory agents advise financial intermediators to continue/increase financial support to real sector especially at difficult times. Levine (2005) stated that economists do not have a consensus about the role of financial sector on economic growth. In one hand, some econo-mists argue that finance does not cause growth, it responds to demands from real economy. On the opposite side, others claim that the positive contribution of financial markets to eco-nomic growth is obvious.
Demirgüç-Kunt and Levine (2008) concluded that developed financial system, size of the banking system and the liquidity of stock markets, better functioning financial system tend to positively effect economic growth. Arestis, Chortareas, and Magkonis (2015)’s literature survey suggested a statistically significant and economically meaningful positive effect of financial de-velopment on economic growth. Valickova, Havranek, and Horvath (2015) concluded that the studies imply a positive and significant effect between financial development and economic growth by analyzing 1334 estimates from 67 studies. But they stated that, these effects may change between developed and developing countries and from time to time.
In spite of vast literature claiming positive power of financial development on economic growth, Ang (2008) stated that the direction of causality is controversial. The assumption that financial development positively contributes to economic growth needs further empirical in-vestigations. There are many structural differences between countries, and further country-specific researches with appropriate econometric techniques should be conducted. Recent studies indicate that the relationship is more complex than previously thought and positive effects are not guaranteed. Financial development and growth relationship have recently drawn greater attention (Hasan, Horvath, & Mares, 2016). Especially during difficult times like global financial crisis, real sector may suffer from turbulence of financial sector, and therefore financial development may negatively affect economic growth. And also, positive correlation may belong to years before 2000s, and recent relationship may be different.
Not only the quantity of financial development, the quality of financial development should also be important for an economy. Efficiency means quality for financial sector, and bank effi-ciency may be related to the economic growth much more than the traditional quantity measures such as the credit volume (Koetter and Wedow, 2010; Hasan, Koetter & Wedow, 2009; Hasan et al.,2016). Also, new techniques in econometrics have emerged. Studies search-ing the relationship between financial development and economic growth suffer from not con-sidering the efficiency of financial sector (Hasan et al., 2016). Macroeconomic growth means growth of companies in micro scale. Therefore, there may be a relationship between financial development, bank efficiency and return, i.e. price, of companies. Macroeconomic growth means growth of companies in micro scale. Therefore, there may be a relationship between financial development, bank efficiency and return, i.e. price, of companies.
Banking sector in Turkey, with its subsidiaries, constitutes more than 90% of the financial system. Therefore, efficiency of banking sector means efficiency of whole financial system in Turkey. Researching for the relationship between efficiency of banking sector and stock market shed light on the microeconomic behavior of financial system, and therefore may provide eco-nomics policy suggestions
Almost all studies use econometric techniques that searches the simultaneous relations be-tween banking sector and stock market indicators. However, the relationship may be dyna-mic., i.e. efficiency of banking sector in one period may be involved in price a few periods later.
This study searches for the dynamic effects of efficiencies on the market value of bank. It uses quarterly data of banks traded in Borsa Istanbul for the period of 2002-2017.
The rest of paper is structured as follows. In the second section, the related literature on bank efficiencies and stock returns and economic value-added relationship is outlined. In the third section, the methodology of the study is introduced. The data and variables are presented in the fourth section. The findings are presented and discussed in the fifth section, followed by the conclusion in the sixth section.
2. Literature Review
To measure the effects of efficiencies on stock returns, one should start by measuring the efficiency scores that cannot be directly observed in the market. Thereafter, the effects of efficiencies on stock returns that can easily be attained from the market can be conducted. Therefore, this type of study needs to be conducted in two consecutive stages.
Different methods are used to measure the efficiencies of banks. Two of the frontier meth-ods are the Stochastic Frontier Analysis (SFA) and Data Envelopment Analysis (DEA). SFA is a parametric method and differs from non-parametric models with a priori assumptions about functional form and distribution of error term. On the other hand, the non-parametric DEA does not impose a functional form and enables users to employ multiple inputs and outputs to benchmark inefficient units with efficient ones (Paradi & Zhu, 2013).
Casu, Girardone, and Molyneux (2004) measured the productivity change of European banks between 1994 and 2002 using both parametric and non-parametric methods and indi-cated that neither method yields different results in identifying the main components of productivity growth. DEA seems to be preferred by many academics mainly because it allows the use of multiple inputs and outputs at the same time. It is the most widely used efficiency measurement and decision analysis tool in the banking industry. Berger and Humphrey (1997) listed 130 frontier efficiency studies from 21 countries and indicated that 69 of them applied DEA. Fethi and Pasiouras (2010) summarized 196 papers using operational research and artifi-cial intelligence methods to measure bank efficiency and productivity all over the world during the period 1998-2008. They pointed out that with 151 studies, DEA is by far the most common operational research method used to measure bank efficiency. Sharma, Sharma, and Barua (2013) analysed 106 bank efficiency studies published during the period 1994-2011 using par-ametric and non-parpar-ametric frontier methods. They indicated that with 66 empirical papers, DEA was by far the most widely used method. Paradi and Zhu (2013) concluded that among the many bank-modelling methods used to assess bank performance, DEA was one of the most successful operational research techniques.
We investigated 31 studies that examined the relationship between bank efficiencies and stock returns. Twenty-two of them used DEA, eight used SFA, and two used both (see Appendix 1). Studies that analysed the relationship between bank efficiencies and stock returns have mainly been implemented in two consecutive stages. In the first stage, efficiencies (technical, pure technical, scale, cost, profit, etc.) were measured by either DEA or SFA. In the second stage, stock returns were regressed on efficiencies, market returns and other bank-specific and environmental factors.
The measurement of efficiency scores over time requires taking into account time dimen-sions and dynamic conditions. Based on DEA, there are two methods to measure efficiency
changes over time: Window Analysis (WA) and Malmquist Productivity Index (MPI). WA is use-ful in the case of a small number of banks. Furthermore, deciding window size may require experience, experimentation and subjectivity (Paradi, Yang, & Zhu, 2011). On the other hand, MPI enables tracking efficiency changes based on an index over a longer period and decom-poses efficiencies into two components that cannot be tracked by WA. Therefore, in this paper, a DEA-based MPI model is used to measure efficiency scores in the first stage, as in the majority of the literature such as Kasman and Kasman (2011) and Guzmán and Reverte (2008). For the details of MPI in DEA, see Cooper, Seiford, and Tone (2007); for MPI applications in banking, see Paradi et al. (2011). The details of this preference are further discussed in the methodology section.
In the second stage, different techniques have been used to test the relationship between efficiency and stock returns. Hossan, Hoque, and Dey (2014) employ Mann-Whitney U test, Chan and Karim (2014) used vector error correction model and Habibullah, Makmur, Azman-Saini, Radam, and Ong (2005) used Granger causality. However, the great majority of research-ers used a regression method (OLS regression, pooled regression, panel data regression and Tobit regression) to search for the effects of efficiency scores on stock returns. Some studies incorporated market return and/or risk-free return into the regression models that took the form of different variations of Capital Asset Pricing Model (CAPM) (Shamsuddin & Xiang, 2012; Srairi, Kouki, & Harrathi, 2015; Sufian & Majid, 2009). Nonetheless, few studies in this field have considered the dynamic or lagged effects of efficiencies on stock returns (Fiordelisi & Molyneux, 2010; Fu, Lin, & Molyneux, 2014). Our study differs from other studies in that it considers not only static effects but also possible dynamic effects.
The great majority of the studies in this field use stock returns as the dependent variable (see Appendix 1 for the list). However, another research stream uses economic value added (EVA) to determine the acquired value for both exchange listed and unlisted banks and then to handle the effects of efficiencies for all banks (Fiordelisi, 2007; Fiordelisi & Molyneux, 2010; Fu et al., 2014; Radić, 2015). In these studies, EVA is calculated by subtracting the cost of capital from net operating profit after tax. Then it is used to investigate the effects of efficiencies. Not all banks are quoted on the stock market; therefore, the market value of all banks cannot be directly obtained from the markets. Difficulties in getting reliable and comparable data of non-traded banks led us to study with only quoted banks in the second stage.
Most studies detected a positive relationship between stock returns/shareholder value cre-ation and the type of efficiencies they measured; an increase in efficiency causes stock price and market value to increase. The results Chu and Lim (1998) and Sufian and Majid (2007b) indicated that compared to cost efficiency, profit efficiency seems to be more effective in de-termining stock returns. As for using technical, allocative and economic efficiency, Erdem and Erdem (2008) concluded that changes in economic efficiency were not related to variations in stock returns in the Turkish banking industry. Vardar (2013) found that regressing cost efficien-cies against stock returns indicated a negative relationship for Turkish banks for the period of 1995-2006. Hossan et al. (2014) suggested that there was no significant difference between returns of operationally efficient and inefficient portfolios. Many studies indicated that cost efficiency has no effect on stock returns, while profit efficiency was positively reflected (Fiordelisi, 2007; Ioannidis, Molyneux, & Pasiouras, 2008; Liadaki & Gaganis, 2010; Pasiouras, Liadaki, & Zopounidis, 2008).
3. Methodology
3.1. First Stage: Efficiency Measurement
For efficiency measurement, DEA enables using MPI over a time that in turn enables re-searchers to employ time series data and produce comparable scores over time. It also has a rich variation of sub-models to handle input- and/or output-oriented technical efficiency, pure technical efficiency, scale efficiency and mixed efficiency methods. DEA also provides opportu-nities to shed light on different dimensions of a bank’s efficiency scores, i.e., profitability, inter-mediation, production efficiencies or a combination thereof that requires multiple inputs and outputs.
DEA is a frontier-based nonparametric tool that measures the efficiencies of different units having multiple inputs and outputs by maximizing the ratio of weighted outputs to weighted inputs. It then normalizes the ratios so that efficiency scores to be between zero and one. CCR (Charnes, Cooper, & Rhodes, 1978) and BCC (Banker, Charnes, & Cooper, 1984) are two basic models of DEA that use constant return to scale and variable return to scale frontier respec-tively to measure the technical and pure technical (and scale) efficiencies. Both CCR and BCC are radial models that suggest the same proportional increase/decrease for all inputs/outputs. Usage with either input or output orientation and neglecting non-radial input or output slacks may be a shortcoming of radial models in some situations. To overcome shortcomings Tone (2001) developed a non-radial Slacks-Based Model (SBM) to handle the input or output slacks simultaneously to propose a non-proportional rate of decrease/increase for inputs/outputs of inefficient units and to produce efficiency scores between zero and one like radial models. Since SBM associates slacks and identifies more possible sources of inefficiency, the efficiency scores can be lower compared to radial models and the inefficiencies are defined as mix inefficiencies. Avkiran (2011) indicated that among DEA models, SBM has become the preferred non-radial model in the last ten years.
MPI is composed of two terms: catch-up and frontier-shift. Catch-up scores represent the improvement or deterioration of a unit resulting from its own performance compared to other units. Frontier-shift, on the other hand, relates to changes in the efficient frontier of all units. It is associated with technological progress and innovation being common for all decision units. Therefore, to increase its efficiency, a bank should improve its technology and should run faster than its peers. To measure the efficiencies in the first stage, we therefore use a DEA-based MPI model with a Slack Based Model (SBM) approach that considers no input or output orientation.
3.2. Second Stage: Measuring Stock Returns
In our study market, returns and MPIs constitute two factors to estimate the stock returns of banks. Accordingly, Equation 1 can be written as
𝑟𝑖𝑡 = 𝛼𝑖𝑡+ 𝑏𝑖,𝑚𝑓𝑚,𝑡+ 𝑏𝑖,𝑒𝑓𝑓𝑓𝑒𝑓𝑓,𝑡+ 𝑒𝑖𝑡 (1)
where
𝑟𝑖𝑡 = Stock return of bank i at time t
𝑏𝑖,𝑚 ; 𝑏𝑖,𝑒𝑓𝑓 = The sensitivity of stock i to the market return or efficiency change
𝑓𝑚,𝑡 ; 𝑓𝑖,𝑒𝑓𝑓 = The market return or efficiency change
𝛼𝑖𝑡 = The non-index-related return for stock i (corresponds to risk-free ret.)
4. Data and Variables
The quarterly data of 21 Turkish commercial banks, which constitute about 93% of the whole sector by assets, are used in this study. Table 1 presents banks and their properties. This study differs from the majority of recent studies by using comparatively more data with higher frequency for a longer period.
Table1: List of banks used in the study
Banks Assets
(Mil USD) For/Dom St/Pr BIST
A&T Bank 1,379 Dom SDIF Unlisted
Akbank 80,466 Dom Pr Listed
Alternatifbank 4,506 For Pr Unlisted
Anadolubank 3,758 Dom Pr Unlisted
Burgan Bank 3,658 For Pr Unlisted
Citibank 2,869 For Pr Unlisted
Denizbank 28,861 For Pr Listed
Finans Bank 29,378 For Pr Listed
Garanti 87,160 For Pr Listed
Halkbank 64,333 Dom St Listed
HSBC Bank 10,845 For Pr Unlisted
ICBC Turkey 2,280 For Pr Listed
ING Bank 16,876 For Pr Unlisted
Is Bank 94,485 Dom Pr Listed
Sekerbank 8,367 Dom Pr Listed
T-Bank 1,994 For Pr Unlisted
TEB 24,660 Dom Pr Unlisted
Turkish Bank 416 For Pr Unlisted
VakıfBank 62,694 Dom St Listed
YapıKredi 75,518 Dom Pr Listed
Ziraat 103,783 Dom St Unlisted
712,123
Note: Dom: Domestic, For: Foreign, SDIF: The Savings Deposit Insurance Fund, ST: state, PR: Private. 2015 year-end data.
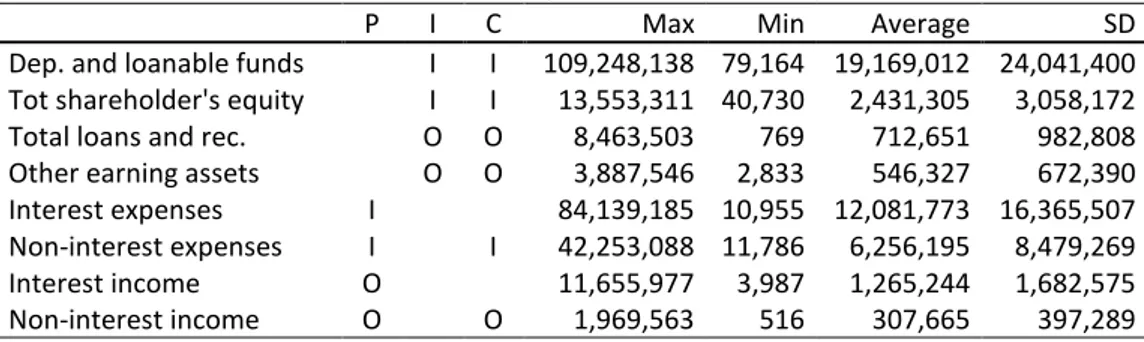
Choosing inputs and outputs depends on the purpose of researchers and researcher’s way of modelling the banks. Since a bank has many aspects, choosing inputs and outputs is not a straightforward process. Intermediation efficiency may be defined as the success of converting liabilities to assets, while profitability efficiency is ability to maximize profit items using cost items. Operational efficiency is the ability to conduct operations with minimum inputs (person-nel, assets and expenses), and production efficiency may be defined as the success of producing banking outputs (loans, credits, other financial assets). We may add further dimension to a bank or bank branch. (Kale, Eken & Selimler, 2015). In parallel to extensive functions of banks, we measured their efficiencies using three different dimensions: profitability, intermediation and composite. In the profitability approach, “interest expenses” and “non-interest expenses” are used as inputs; “interest income” and “non-interest income” are outputs. The intermedia-tion approach treats banks as intermediaries between surplus spending units and deficit spend-ing units. Therefore, intermediation efficiency is measured as the power of convertspend-ing “depos-its”, “other loanable funds” and “total shareholder's equity” into “total loans and receivables” and “other earning assets”. We also preferred to measure a more general efficiency that is a
combination of both profitability and intermediation efficiency approaches using all inputs (de-posits and other loanable funds, total shareholder’s equity and non-interest expenses) and all outputs (total loans and receivables, other earning assets and non-interest income). Because of relatively high and volatile inflation rates, all data are deflated using the average of consumer and producer price indices, taking 2002 year-end as basis. The balanced panel data consist of 21 banks and 53 quarters of data from 2002Q4 to 2017Q4. Table 2 presents descriptive statis-tics.
In 2000 and 2001 Turkish economy experienced the most catastrophic financial crises. The Turkish banking sector faced significant losses during the crisis. The sharp fall in prices of Turk-ish Lira treasury bills, increased interbank rates, devaluation of currency and dried liquidity neg-atively affected the banks’ balance sheets. In 2001, GDP decreased by 7.5%. Between 1999-2003, 22 banks transferred to Savings Deposit Insurance Fund (SDIF). After the crisis, In May 2001, the Banking Regulation and Supervision Agency (BRSA) initiated a comprehensive re-structuring program, which had four pillars, for the banking system. It covers rere-structuring of the state banks, prompt resolution of the SDIF banks, strengthening of the private banks and strengthening of the regulatory and supervisory framework. 1994 and 1997-1998 were also crisis years for banking sector. Therefore, it seems feasible to start period of analysis from 2002. After measuring the efficiency of banks in the first stage, to determine whether efficiency has any explanatory power in stock returns, a dynamic panel data analysis is run in the second stage. The stock returns of banks are used as dependent variables, while market returns and efficiency changes are used as independent variables. BIST100 return index obtained from Borsa Istanbul is used as a proxy for market return.
Table 2: Inputs and outputs used in profitability, intermediation and composite approaches and descriptive statistics
P I C Max Min Average SD
Dep. and loanable funds I I 109,248,138 79,164 19,169,012 24,041,400 Tot shareholder's equity I I 13,553,311 40,730 2,431,305 3,058,172
Total loans and rec. O O 8,463,503 769 712,651 982,808
Other earning assets O O 3,887,546 2,833 546,327 672,390
Interest expenses I 84,139,185 10,955 12,081,773 16,365,507
Non-interest expenses I I 42,253,088 11,786 6,256,195 8,479,269
Interest income O 11,655,977 3,987 1,265,244 1,682,575
Non-interest income O O 1,969,563 516 307,665 397,289
Note: P: profitability approach, I: intermediation approach, C: composite approach I:input, O:output 5. Results and Analysis
5.1. Different dimensions of bank efficiencies over time
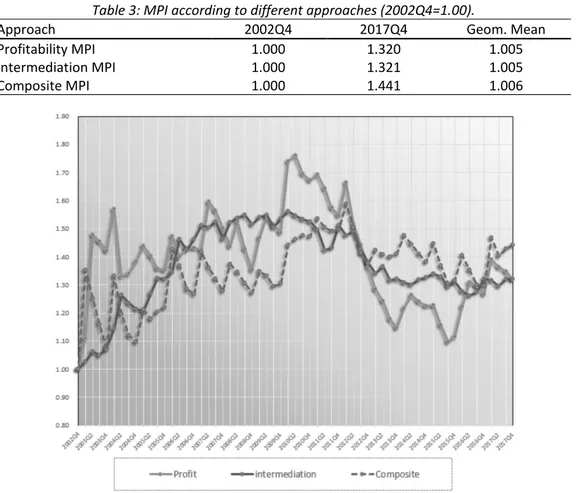
After measuring the efficiency scores of each bank on a quarterly basis, the efficiencies of total sector were calculated as the weighted arithmetic average of all banks based on their total assets that represent the whole sector (Table 3). The efficiency indices of profitability, interme-diation and composite approaches generally had upward trends, indicating improvement, until 2010-Q1 (Figure 1). Then deterioration, and later a correction was observed, especially in the profitability approach. The profitability efficiencies seem to be more volatile compared to oth-ers.
Table 3: MPI according to different approaches (2002Q4=1.00).
Approach 2002Q4 2017Q4 Geom. Mean
Profitability MPI 1.000 1.320 1.005
Intermediation MPI 1.000 1.321 1.005
Composite MPI 1.000 1.441 1.006
Figure 1: Efficiency indices according to profitability, intermediation and composite ap-proaches (2002Q4=1.00).
5.2. The relationship between efficiency and stock return 5.2.1. Static relationship
In the second stage, first, “stock returns” are used as dependent variables while “return of Borsa Istanbul-100 index” and “the efficiency change” are used as independent variables. All returns are deflated with inflation. Panel unit roots should be conducted to determine station-arity of data. First generation panel unit root tests assume no cross-sectional dependence, while second generation tests allow. First-generation Fisher-Augmented Dickey Fuller test (Fisher-ADF), (Maddala and Wu, 1999) and Fisher-Philips & Perron (Choi, 2001) tests can be used for unbalanced panels when time dimension is greater than cross-section dimension. They are also less affected from presence of cross-sectional dependence compared to other first-generation tests. Additionally, Levin–Lin–Chu (2002) and Im–Pesaran–Shin (2003) tests showed that all variables are stationary for no-intercept, intercept, intercept and trend options.
The regression models presented in Table 4 were tested with efficiencies derived from prof-itability, intermediation and composite approaches. Different efficiency estimates capture dif-ferent characteristics of banks. Since the data is in panel form one of the estimation approaches
among pooled, fixed or random should be chosen. F-test is conducted to distinguish between fixed effects and pooled model. Breusch & Pagan LM test is performed to make a choice be-tween pooled and random effects models. Both tests indicated that pooled model should be preferred. To confirm the poolability once again individual and time effects are predicted with Chow test. The tests showed that no individual effects were observed at 5% probability level except for profitability-MPI. Again, it is indicated that for all equations the slope of the regres-sors were the same regardless of the time except for Intermediation-MPI. As a result, consid-ering all findings, we preferred to continue with pooled model for all approaches and equations.
Table 4: Tested approaches, equations and decision of regression approach.
Approach Equation F-te st B & P L M Chow T. D ec isi o n ind . Ti m e Profitability ∆𝑠𝑡𝑜𝑐𝑘𝑖𝑡= 𝛼𝑖𝑡+ 𝑏𝑖,𝑚∆𝑏𝑖𝑠𝑡100𝑚,𝑡+ 𝑏𝑖,𝑒𝑓𝑓∆𝑝𝑟𝑜𝑓𝑒𝑓𝑓,𝑡+ 𝑒𝑖𝑡 P P p P Intermediation ∆𝑠𝑡𝑜𝑐𝑘𝑖𝑡= 𝛼𝑖𝑡+ 𝑏𝑖,𝑚∆𝑏𝑖𝑠𝑡100𝑚,𝑡+ 𝑏𝑖,𝑒𝑓𝑓∆𝑖𝑛𝑡𝑒𝑟𝑒𝑓𝑓,𝑡+ 𝑒𝑖𝑡 P P P P Composite ∆𝑠𝑡𝑜𝑐𝑘𝑖𝑡= 𝛼𝑖𝑡+ 𝑏𝑖,𝑚∆𝑏𝑖𝑠𝑡100𝑚,𝑡+ 𝑏𝑖,𝑒𝑓𝑓∆𝑐𝑜𝑚𝑝𝑒𝑓𝑓,𝑡+ 𝑒𝑖𝑡 P P P p P Note: B&P LM: Breusch & Pagan LM test, ind.: individual effect, p: poolable,
The results of pooled panel regressions are presented in Table 5.. Breusch-Pagan/Cook-Weisberg test for heteroscedasticity indicated heteroscedasticity in all models; therefore, ro-bust estimators are used. Wooldridge test for autocorrelation pointed to no first order serial autocorrelation.
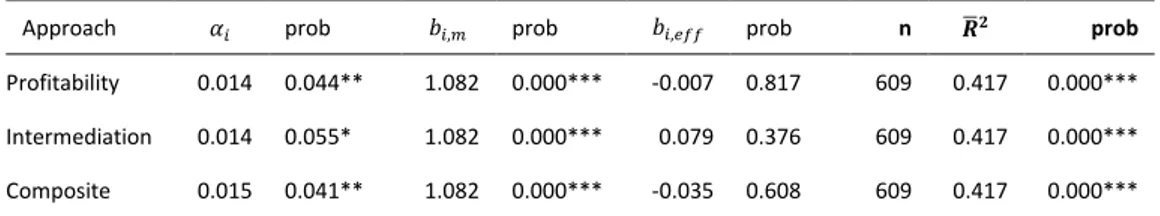
Table 5. Effect of different efficiency components on stock returns.
Approach 𝛼𝑖 prob 𝑏𝑖,𝑚 prob 𝑏𝑖,𝑒𝑓𝑓 prob n 𝑹̅𝟐 prob
Profitability 0.014 0.044** 1.082 0.000*** -0.007 0.817 609 0.417 0.000*** Intermediation 0.014 0.055* 1.082 0.000*** 0.079 0.376 609 0.417 0.000*** Composite 0.015 0.041** 1.082 0.000*** -0.035 0.608 609 0.417 0.000***
***, ** and * indicates significance level of 0.01, 0.05 and 0.10 respectively.
The regression results show that sensitivity of stock returns to the market, 𝑏𝑖,𝑚, is significant
and greater than one in all models. This implies that market return is effective on stock returns. The results further show that the effects of efficiencies on stock returns, represented by 𝑏𝑖,𝑒𝑓𝑓 coefficients, are insignificant in all models. Regressions with fixed effect option yielded
to almost the same results and presented in Appendix 2. The point we should search further must be a dynamic relationship in which the investors should see the efficiency improvements first, and then prices react. Additionally, financial tables of banks are announced about 1.5 months later than quarter-ends, and this may be another reason for a possible lagged efficiency effect.
5.2.2. Dynamic relationship
Static models are not flexible enough to adequately cover the specification of time lags and dynamic adjustments. Therefore, developing a dynamic model to incorporate economic theory and allow a flexible, data-driven lag structure is necessary (Kennedy, 2008). Thus, the questions to be asked are first, is there a dynamic relationship between efficiency improvements and
stock returns? Second, when and how much efficiency are reflected in the return? Finally, how long will this effect continue? In addition to static effect, searching for the details of dynamic effects may be assumed as another contribution to the literature. Few studies associate dy-namic effects into the models (Fiordelisi & Molyneux, 2010; Fu et al., 2014).
The ARDL models incorporate lags of both dependent and independent variables as regres-sors into the equation; therefore, incorporate dynamic nature and fit our requirements. Pe-saran, Shin, and Smith (1999) defined the ARDL (p, q, q, …, q) model as
𝑦𝑖,𝑡 = ∑ 𝑖𝑗 𝑝 𝑗=1 𝑦𝑖,𝑡−𝑗+ ∑ 𝑖𝑗′ 𝑞 𝑗=0 𝑋𝑖,𝑡−𝑗+ 𝑖+ 𝑖𝑡 (4)
where 𝑦𝑖𝑡 and 𝑖𝑗 represent dependent variables and the coefficients of lagged dependent
variables, respectively; 𝑋𝑖𝑡 denotes the vector of independent variables, and 𝑖𝑗 are their
coef-ficients; 𝜇𝑖show intercepts (unit specific fixed effects); and i=1, 2, …, N and t=1, 2, …, T represent
group and time periods, respectively; p and q are optimal lag orders and . 𝑖𝑡 is the error term.
If variables are co-integrated, they will respond to any deviation from long-run equilibrium; and the short-run dynamics are influenced by long-run equilibrium. Therefore, Equation (4) is re-parameterized as the following error correction equation that implies that ARDL (p, q, q,…, q) error correction model simultaneously reveals short-run relationship, long-run equilibrium and speed of satisfying equilibrium conditions.
𝑦𝑖,𝑡= 𝑖(𝑦𝑖,𝑡−1− 𝜃𝑖′𝑋𝑖,𝑡) + ∑ 𝑖𝑗∗ 𝑝−1 𝑗=1 𝑦𝑖,𝑡−𝑗+ ∑ 𝑖𝑗∗ 𝑞−1 𝑗=0 𝑋𝑖,𝑡−𝑗+ 𝜇𝑖+ 𝑖𝑡 (5) where 𝑖= −(1 − ∑ 𝑖𝑗) 𝑝 𝑗=1 , 𝜃𝑖= ∑ 𝛿𝑖𝑗 𝑞 𝑗=0 /(1 − ∑ 𝑘 𝑖𝑘), 𝑖𝑗∗ = − ∑ 𝑖𝑚 𝑝 𝑚=𝑗+1 𝑗 = 1,2, … , 𝑝 − 1, 𝛿𝑖𝑗∗ = − ∑ 𝛿𝑖𝑚 𝑞 𝑚=𝑗+1 𝑗 = 1,2, … , 𝑞 − 1.
The parameter 𝑖 is error-correction speed of adjustment term to the long-run relationship, and it is expected to be negative and significant to indicate the stable and convergence of pa-rameters towards long-run equilibrium. 𝑖= 0 means no evidence of long-run relationship. 𝜃𝑖′
represents the long-run relationship; 𝑖𝑗∗ and 𝑖𝑗∗ are the short-run dynamic coefficients
(Black-burne & Frank, 2007).
The ARDL model that includes error correction term enables a new co-integration form. The ARDL model requires a single-equation set-up that is easy to implement and interpret. Addi-tionally, different lags of dependent and independent variables can be integrated into the model, and Pooled Mean Group (PMG) and Mean Group (MG) estimators consistently estimate the coefficients, whether endogeneity exists or not. It can be used with order of I(0) and I(1) or both but not I(2). Unit root tests can be conducted to make sure variables are not I(2). In this study, change in stock prices are used as dependent variables, while change in Bist100 return
index and change in efficiency scores are used as independent variables. All the data are meas-ured to be stationary at the level.
The ARDL model can be estimated with the MG, PMG and dynamic fixed effect (DFE) esti-mators. MG estimation allows all coefficients to vary for each unit in the short-run and long run. It requires a sufficiently large time-series data. DFE, on the other hand, restricts the short-run coefficients, long-short-run coefficients and speed of adjustment to be equal for all units. PMG estimator, introduced by Pesaran et al. (1999), assumes long-run slope coefficients to be same for all units, while short-run coefficients, intercepts and speed of adjustment may change from unit to unit. The PMG estimator provides more efficient estimates under long-run equilibrium (Samargandi, Fidrmuc, & Ghosh, 2015). Hausman test is also a useful tool to choose one among ARDL models.
Hausman tests pointed to PMG selection between PMG and MG choices. Therefore, in this study, PMG estimator is used. With automatic lag selection based on Schwartz criterion, all models are selected as ARDL (1, 1, 1). Table 4 presents the results of ARDL models with PMG estimators, based on profitability, intermediation and composite approaches.
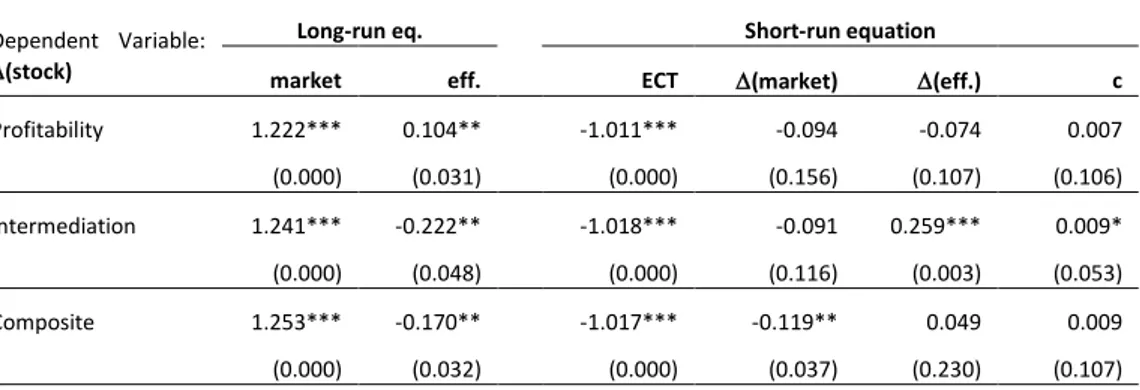
Table 6: Dynamic effect of efficiency on stock returns in the short- and long-run with PMG esti-mator in different approaches.
Dependent Variable: (stock)
Long-run eq. Short-run equation
market eff. ECT (market) (eff.) c
Profitability 1.222*** 0.104** -1.011*** -0.094 -0.074 0.007 (0.000) (0.031) (0.000) (0.156) (0.107) (0.106) Intermediation 1.241*** -0.222** -1.018*** -0.091 0.259*** 0.009* (0.000) (0.048) (0.000) (0.116) (0.003) (0.053) Composite 1.253*** -0.170** -1.017*** -0.119** 0.049 0.009 (0.000) (0.032) (0.000) (0.037) (0.230) (0.107)
Note: Values in parenthesis represent probability. The lag structure is ARDL (1, 1, 1) in all models. ECT: Error correction term. N is 11, T is 42 for all models.
***, ** and * indicates significance level of 0.01, 0.05 and 0.10 respectively.
Considering long-run equilibrium, all coefficients of market effect on stock returns are pos-itive and significant at 1% level. Without any exception, all models indicate that when the mar-ket changes, stock prices change in the same direction; when marmar-ket moves about 1%, bank stock moves more than 1.2%. This is reasonable as stock prices are the main and leading con-tributor of market movement. The error corrected terms are significant at 1% level in all mod-els, and the coefficients are not less than -2 meeting the requirement for validity of ARDL and showing appropriate error correction methodology. This indicates the existence of co-integra-tion and adjustment process of short-run dynamic to long-run equilibrium. Change in profit efficiency has positive effect on stock return on the long run. On the other hand, the relation between intermediation efficiency improvement and stock return seem to be negative in the long run, while positive in the short run. This may be explained with the side effects of increas-ing intermediation in the short run as the increasincreas-ing non-performincreas-ing loans and decreasincreas-ing prof-itability in the long run.
As a whole, we can conclude that in efficiency change has explanatory power on stock re-turn in addition to market itself. Although the effect of profitability increase is positive in the long run, effect of intermediation is positive in the short but negative in the long run.
Banking sectors are cathastropically affected worldwide by global financial crisis. Although it is frequently mentioned that Turkish banks less felt the crisis, to see the relation before and after crisis we analyzed 2003q1-2008q4 and 2009q1-2017q4 period separately. The results are presented in Appendix 3 and Appendix 4. Effect of market movement on stock return is con-firmed in both periods. Effect of profitability and intermediation efficiency was observed in long run after cirisis, but this effect emerged as insignificant before cirisis.
6. Conclusions
This study analyses the effects of efficiency improvements on stock returns. For this pur-pose, first, we employed a DEA-based MPI to measure different dimensions of efficiency scores of 21 banks that account for about 92% of the sector in Turkey, using 2002Q4-2017Q4 quarterly data. In the second stage, static and dynamic panel data models are created to search for the effects of efficiencies on stock returns.
Banking sector is very crucial for an economy. Efficiency of financial system is expected to positively fuel the whole economy. We expect to trace the clues of efficiency change on grow-ing and price of bankgrow-ing sector. In Turkey, bankgrow-ing sector requires expectioanal interest as it constitutes more than 90% of the financial system. Therefore, efficiency of banking sector means efficiency of whole financial system in Turkey.
The MPI analysis indicates that efficiency improved until 2010Q1 in all profitability, inter-mediation and composite approaches. However, deterioration was observed thereafter, espe-cially in the profitability approach.
ARD models proves that efficiency change has explanatory power on stock return together with market itself as already bank stock compromise a major quantity in Borsa Istanbul. Alt-hough the effect of profitability increase is positive in the long run, effect of intermediation is positive in the short but negative in the long run. This may be explained with the side effects of increasing intermediation in the short run as the increasing non-performing loans and decreas-ing profitability in the long run.
We we extended our analysis as before and after global financial crisi, effect of market movement on stock return is confirmed in both periods. However, the effect of efficiency changed for both periods. This implies that efficieny factor effecting stock returns of banking sector changes from time to time. This study suffers from showing effect of efficiency and other banking indicators directly on economic growth. As global economic conditions have been changing at a dizzying speed, it requires to pay more attention to analyzse interaction between banking sector and macroeconomic indicator, and to analyze whether relations are confirmed for all periods.
References
Ang, J. B. (2008). A survey of recent developments in the literature of finance and growth. Journal of Economic Sur-veys, 22(3), 536-576. doi:10.1111/j.1467-6419.2007.00542.x
Arestis, P., Chortareas, G., & Magkonis, G. (2015). The Financial Development and Growth Nexus: A Meta-Analysis. Journal of Economic Surveys, 29(3), 549-565. doi:10.1111/joes.12086
Avkiran, Necmi K. (2011). "Association of Dea Super-Efficiency Estimates with Financial Ratios: Investigating the Case for Chinese Banks." Omega, 39(3), 323-34.
Banker, Rajiv D; Abraham Charnes and William Wager Cooper. (1984). "Some Models for Estimating Technical and Scale Inefficiencies in Data Envelopment Analysis." Management science, 30(9), 1078-92.
Berger, Allen N. and David B. Humphrey. (1997). "Efficiency of Financial Institutions: International Survey and Direc-tions for Future Research." European Journal of Operational Research, 98(2), 175-212.
Blackburne, Edward F and Mark W Frank. (2007). "Estimation of Nonstationary Heterogeneous Panels." The Stata Journal, 7(2), 197-208.
Burmeister, Edwin; Richard Roll; Stephen A. Ross; Edwin J. Elton; Martin J. Gruber; Richard Grinold and Ronald N. Kahn. (1994). "A Practitioner's Guide to Factor Models," USA: Research Foundation of CFA Institute,
Casu, Barbara; Claudia Girardone and Philip Molyneux. (2004). "Productivity Change in European Banking: A Compari-son of Parametric and Non-Parametric Approaches." Journal of Banking & Finance, 28(10), 2521-40.
Chan, Sok-Gee and Mohd Zaini Abd Karim. (2014). "Bank Efficiency and Stock Returns in Selected Asean Countries." Argumenta Oeconomica, 2(33), 5-21.
Charnes, Abraham; William W Cooper and Edwardo Rhodes.(1978). "Measuring the Efficiency of Decision Making Units." European Journal of Operational Research, 2(6), 429-44.
Chu, Sing Fat and Guan Hua Lim. (1998). "Share Performance and Profit Efficiency of Banks in an Oligopolistic Market: Evidence from Singapore." Journal of Multinational Financial Management, 8(2–3), 155-68.
Cooper, William W; Lawrence M Seiford and Kaoru Tone. (2007). "Data Envelopment Analysis: A Comprehensive Text with Models, Applications, References and Dea-Solver Software," New York, USA: Springer-Verlag,
Demirgüç-Kunt, A., & Levine, R. (2008). Finance, financial sector policies, and long-run growth (7, Trans.) (6 ed.). Washington: The World Bank.
Erdem, Cumhur and Meziyet Sema Erdem. (2008). "Turkish Banking Efficiency and Its Relation to Stock Performance." Applied Economics Letters, 15(3), 207-11.
Fethi, Meryem Duygun and Fotios Pasiouras. (2010). "Assessing Bank Efficiency and Performance with Operational Research and Artificial Intelligence Techniques: A Survey." European Journal of Operational Research, 204(2), 189-98.
Fiordelisi, Franco. (2007). "Shareholder Value Efficiency in European Banking." Journal of Banking & Finance, 31(7), 2151-71.
Fiordelisi, Franco and Phil Molyneux. (2010). "Total Factor Productivity and Shareholder Returns in Banking." Omega, 38(5), 241-53.
Fu, Xiaoqing; Yongjia Lin and Philip Molyneux. (2014). "Bank Efficiency and Shareholder Value in Asia Pacific." Journal of International Financial Markets, Institutions and Money, 33, 200-22.
Guzmán, Isidoro and Carmelo Reverte. (2008). "Productivity and Efficiency Change and Shareholder Value: Evidence from the Spanish Banking Sector." Applied Economics, 40(15), 2037-44.
Habibullah, Muzafar Shah; Muhd Iqbal Makmur; W. N. W. Azman-Saini; Alias Radam and Hway-Boon Ong. (2005). "Bank Efficiency and the Efficient Market Hypothesis the Case for Bank Stock Prices in Klse." Savings and Devel-opment, 29(4), 363-90.
Hasan, I., Koetter, M., & Wedow, M. (2009). Regional growth and finance in Europe: Is there a quality effect of bank efficiency? Journal of Banking & Finance, 33(8), 1446-1453. doi:10.1016/j.jbankfin.2009.02.018
Hasan, I., Horvath, R., & Mares, J. (2016). What Type of Finance Matters for Growth? Bayesian Model Averaging Evi-dence. Washington: The World Bank.
Hossan, Mohammad Akter; Mohammad Ziaul Hoque and Bishajit Dey. (2014). "Does Operating Efficiency Matter for the Returns of Banking Sector Stocks in Dhaka Stock Exchange?" Universal Journal of Accounting and Finance, 2(5), 121-28.
Ioannidis, Christos; Philip Molyneux and Fotios Pasiouras. (2008). "The Relationship between Bank Efficiency and Stock Returns: Evidence from Asia and Latin America." University of Bath, School of Management, Working Pa-per, (2008.10).
Kale, S., Eken, M. H. & Selimler, H (2015). The Effects of Regulations on the Performance of Banks: Evidence from Turkish Banking Industry. Journal of CENTRUM Cathedra: The Business and Economics Research Journal, 8(2), 109-145. doi:10.1108/JCC-08-02-2015-B003
Kasman, Saadet and Adnan Kasman. (2011). "Efficiency, Productivity and Stock Performance: Evidence from the Turk-ish Banking Sector." Panoeconomicus, 58(3), 355-72.
Kennedy, P. (2008). A Guide to Econometrics. USA: Blackwell Publishing Ltd.
Koetter, M., & Wedow, M. (2010). Finance and growth in a bank-based economy: Is it quantity or quality that mat-ters? Journal of International Money and Finance, 29(8), 1529-1545. doi:10.1016/j.jimonfin.2010.05.015 Levine, R. (2005). Finance and growth: theory and evidence. Handbook of economic growth, 1, 865-934.
Liadaki, Aggeliki and Chrysovalantis Gaganis. (2010). "Efficiency and Stock Performance of Eu Banks: Is There a Rela-tionship?" Omega, 38(5), 254-59.
Paradi, Joseph C.; Zijiang Yang and Haiyan Zhu. (2011). "Assessing Bank and Bank Branch Performance," W. W. Cooper, L. M. Seiford and J. Zhu, Handbook on Data Envelopment Analysis. Boston, MA: Springer US, 315-61. Paradi, Joseph C. and Haiyan Zhu. (2013). "A Survey on Bank Branch Efficiency and Performance Research with Data
Envelopment Analysis." Omega, 41(1), 61-79.
Pasiouras, Fotios; Aggeliki Liadaki and Constantin Zopounidis. (2008). "Bank Efficiency and Share Performance: Evi-dence from Greece." Applied Financial Economics, 18(14), 1121-30.
Pesaran, M. Hashem; Yongcheol Shin and Ron P. Smith. (1999). "Pooled Mean Group Estimation of Dynamic Hetero-geneous Panels." Journal of the American Statistical Association, 94(446), 621-34.
Radić, Nemanja. (2015). "Shareholder Value Creation in Japanese Banking." Journal of Banking & Finance, 52, 199-207.
Samargandi, Nahla; Jan Fidrmuc and Sugata Ghosh. (2015). "Is the Relationship between Financial Development and Economic Growth Monotonic? Evidence from a Sample of Middle-Income Countries." World Development, 68, 66-81.
Shamsuddin, Abul and Dong Xiang. (2012). "Does Bank Efficiency Matter? Market Value Relevance of Bank Efficiency in Australia." Applied Economics, 44(27), 3563-72.
Sharma, Dipasha; Anil K. Sharma and Mukesh K. Barua. (2013). "Efficiency and Productivity of Banking Sector: A Criti-cal Analysis of Literature and Design of Conceptual Model." Qualitative Research in Financial Markets, 5(2), 195-224.
Srairi, Samir; Imen Kouki and Nizar Harrathi. (2015). "The Relationship between Islamic Bank Efficiency and Stock Market Performance: Evidence from Gcc Countries," H. A. El-Karanshawy and e. al, Islamic Banking and Finance: Essays on Corporate Finance, Efficiency and Product Development. Doha, Qatar: Bloomsbury Qatar Foundation, 125.
Sufian, Fadzlan and Muhamed Zulkhibri Abdul Majid. (2009). "Bank Efficiency and Share Prices in China: Empirical Evidence from a Three-Stage Banking Model." International Journal of Computational Economics and Economet-rics, 1(1), 23-47.
Sufian, Fadzlan and Muhd-Zulkhibri Abdul Majid. (2007). "Singapore Banking Efficiency and Its Relation to Stock Re-turns: A Dea Window Analysis Approach." International Journal of Business Studies, 15(1), 83.
Tone, Kaoru. (2001). "A Slacks-Based Measure of Efficiency in Data Envelopment Analysis." European Journal of Oper-ational Research, 130(3), 498-509.
Valickova, P., Havranek, T., & Horvath, R. (2015). Financial Development and Economic Growth: A Meta-Analysis. Journal of Economic Surveys, 29(3), 506-526. doi:10.1111/joes.12068
Vardar, Gülin. (2013). "Efficiency and Stock Performance of Banks in Transition Countries: Is There a Relationship?" International Journal of Economics and Financial Issues, 3(2), 355.
Appendix 1: List of studies about relationship between bank efficiency and stock return.
Year Author CNT # of
banks Period
First Stage Second Stage
Conclusion
Method Appr./Model Efficiency Method Dependent Independent
2015 Srairi
et al. GCC 25 2003-2009 DEA
• Profit
• CCR, BCC TE, PTE, SE Reg. • Stock return
• Efficiency • Market returns
• Bank's factors (Size, BV/MV)
Stock returns reflect changes in both TE and PTE. But, no significant relationship btw SE and stock returns
2015 Radic JAP 1999-2011 SFA • Profit, Cost Shareholder value
eff., PE, CE, Rev. E Panel Reg. • Sharholder val
• Efficiency • Other factors
CE gains, credit risk and bank size are the most im-portant factors in explaining the shareholder value cre-ation 2014 Hossan et al BAN 10 2008-2012 DEA • Operation • CCR, BCC TE, PTE, SE MW– U test • Return of
eff. portfolio • Return of inefficient portfolio
No significant difference btw returns of operationally efficient and inefficient portfolios.
2014 Fu
et al A-PA 500 2003-2010 SFA • Profit, Cost PE, CE Reg.
• Tobin’s Q, • RoAE, EVA • M/B ratiok
•PE and CE change (PEC, CEC) • Bank's factors (Cred., market, liq. risk, lev., size, dum.)
Both CE and PE enhancements are positively related to bank shareholder value.
2014 Chan,
Karim ASIA 45 1987-2007 DEA • Profit, Cost PE, CE VECM • Stock return
• Profit efficiency (PE) • Cost efficiency (CE)
Both CE and PE contain useful information to explain bank stock returns
2013 Vardar CEE 39 1995-2006 SFA • Profit, Cost PE, CE Panel
Reg. • Stock return
• Profit efficiency change • Cost efficiency change • Risk, Size
Changes in PE have a positive impact on stock returns; negative relationship btw CE and stock returns
2012 Moradi-
Motlagh et al AUS 7 2001-2010 DEA • Ratios TE Reg. • Stock return
• Efficiency
• Bank's factors (ROA, Ass. turnover, growth, P/B)
Changes in performance are reflected in total share-holder returns
2012 Shamsuddin,
Xiang AUS 10 1985-2008 SFA
• Total
• Profit, Cost TE, PE, CE
Panel Reg.
• Excess return (over risk free)
• Excess return on the market • Efficiency change (TE, PE, CE) • Degree of financial leverage
Improvement in TE, CE and PE contribute to the market value of a bank
2011 Aftab
et al PAK 7 2003-2007 DEA • Profit TE, PTE Reg. • Stock return • Efficiency change
Significant relationship btw changes in bank efficiency and shares performance
2011 Gu,
Yue CHI 14 2008-2010 DEA
• Profit • Window (CCR, BCC)
TE, PTE, SE Panel
Reg. • Stock return
• Efficiency change (TE, PE, CE) • Bank's factors (Dep, ln/TA, TA, ni.exp/TA, eq/TA, prf/TA)
Both TE and PTE include useful information to explain bank stock returns
2011 Hadad
et al. IND 24 2003-2007 DEA
• Profit
• Malmquist MI, FS, EC
Nonpar.
Trn. Reg. • Efficiency
• Market index
• Bank's factors (Stock price, ROE, for. share, size), Time
Efficiency is positively correlated with stock returns in all models
2011 Kasman,
Kasman TUR 13 1998-2008 DEA
• Profit • Malmquist (CCR, BCC)
TE, SE, Prod. Reg. • Stock return
• Efficiency change • Bank specific factors (size, risk, profitability)
The changes in three measures of performance have positive and significant effect on stock returns
2011 Tsolas GRE 13 2007 DEA
• Profit • Market P. (CCR, BCC)
TE, PTE, SE Tobit Reg.
• Perfromance measures
• Efficiency change • Bank's factors (Size, lev, CIR, lp., CA, ltod., beta, EPS)
Leverage is insignificant in explaining PE, while CIR ex-plains stock market performance.
2010 Liadaki,
Gaganis EU 171 2002-2006 SFA • Profit, Cost PE, CE Reg. • Stock return
• Profit efficiency change (PE) • Cost efficiency change (CE)
Significant positive relationship btw changes in PE and stock returns, but no effct of CE.
2010 Fiordelisi,
Molyneux EU 1995-2002 DEA
• Cost • Malmq. TFP
CE (TE, AE, SE) Malmquist (TE, PTE, SE)
Reg. • Sharholder val (EVA, MAR)
• Cost eff. and components • TFP change and comonents
TFP best explain shareholder value, and tech. change seems to be the most important component
2010 Janoudi EU 947 2004-2010 SFA • Profit, Cost PE, CE Panel
Reg. • Stock return
• Profit efficiency change (PE) • Cost efficiency change (CE) • Other f. (Size, eq. chnge, dum.)
Changes in both CE and PE are significantly reflected in changes in stock prices
2009 Sufian,
Majid CHI 7 1997-2006 DEA
• Intermed. • Window (CCR, BCC)
TE, PTE, SE Panel
Reg. • Stock return
• Efficiency change (TE, PE, CE) • Bank's factors (Dep, loan, size, inc.div, lev, ROA, inv.c)
Efficiency estimates, rather than financial information, explain share price returns.
2008 Erdem,
Erdem TUR 10 1998-2004 DEA
• Intermed. • Window (CCR, BCC)
TE, AE, EE Reg. • Excess return (over risk free)
• Excess return on the market • Efficiency change (TE, PE, CE)
Change in economic efficiency has nothing to do ex-plaining the variation in stock returns
2008 Pasiouras
et al GRE 10 2001-2005 DEA
• Profit
• CCR, BCC TE, PTE, SE
Panel
Reg. • Stock return
• Efficiency change • Bank's factors (size, risk)
TE was statistically significant and positively related to stock returns, however SE was insignificant. 2008 Ioannidis
et al A-LA 260 2000-2006 SFA • Profit, Cost PE, CE Reg. • Stock return
• Efficiency change • Bank’s factors (size, risk)
PE changes are reflected in stock returns, although this is not the case for CE changes
2007 Sufian,
Majid SIN 6 1993 - 2003 DEA
• Intermed.
• Window CE
Panel
Reg. • Stock return • Efficiency change
Changes in stock prices tend to reflect CE albeit with small degree of reaction
2007 Sufian,
Majid MAL 9 2002-2003 DEA • CCR, BCC
PE (OE, AE, SE) CE (OE, AE, SE)
Panel
Reg. • Stock return • Efficiency change (CE, PE)
Stock prices react more towards the improvements in PE rather than in CE
2007 Fiordelisi EU 3323 1997-2002 SFA • Profit, Cost Shareholder
value eff., PE, CE Reg.
• Sharholder
value (EVA) • PE, CE, SH value eff., dummy
EVA eff. is the most important factor explaining value creation, whereas CE and PE have a marginal influence 2006 Sufian,
Majid MAL 8 1994-2003 DEA
• Window
(CCR, BCC) PE (TE, PTE, SE)
Panel
Reg. • Stock return • Efficiency change
Efficiency to some extent reflects banks’ share perfor-mance in the marketplace
2006 Kirkwood,
Nahm AUS 10 1995-2002 DEA
• Bank. ser.eff. • Prof. Eff. • Malmquist
Serv. (TE, AE, PE) Prof. (TE, AE, PE) Reg.
• Excess stock return
• Efficiency change
• Excess market return Changes in firm efficiency are reflected in stock returns 2006 Beccalli
et al EU 29 1999-2000
SFA DEA
• Intermed.
• BCC PE, CE Reg. • Stock return
• Efficiency
• Bank's factors (Size, risk, prof.) Changes in CE are reflected in changes in stock prices 2005 Habibullah
et al. MAL 37 1988-1993 DEA
• Intermed. • CCR, BCC
TE, PTE, SE Congestion Eff.
Granger
Causality • Stock return • Efficiency (TE, PTE, SE, Cong. E)
Stock returns reflect changes in the TE but not PTE, SE and congestion efficiencies
2002 Fernandez
et al 18 C 142 1989-1998 DEA
• Production
• Malmquist TE, PTE, SE
Panel
Reg. • Stock return • Productivity
Efficiency and productivity changes are consistent with the wealth maximization criterion
1999 Eisenbeis
et al USA 254 1986-1991
SFA
DEA • Cost eff. CE Reg. • Stock return
• Market returns • Traesury bond return • Efficiency
Both SFA and DEA produce informative scores, but de-cision makers should put more weight on the SFA 1998 Chu,
Lim SIN 6 1992-1996 DEA
• Intermed. • CCR, BCC
PE (TE, PTE, SE)
CE (TE, PTE, SE) Reg. • Stock return
• Profit efficiency change (PEC) • Cost efficiency change (CEC)
Changes in share prices are highly dependent on changes in PE rather than CE
1997 Adenso-Díaz,
Gascon SPA 23 1994 DEA
• Prod. costs • Brnch distrib.
Prod. costs
Branch distrib. Reg. • Stock return
• Prod. costs, branch distrib. • Systematic risk, specific risk
Most influential variable is specific risk of banks in de-termining stock performance
CCR: Charnes, Cooper, Rhodes model, BCC: Banker, Charnes, Rhodes model, Malm: Malmquist, OE:Overall efficiency, TE: Total technical efficiency, PTE: Pure technical efficiency, SE: Scale efficiency, PE: Profit efficiency, CE: Cost efficiency, TA: Total assets, CIR: Cost to income ratio, CA: Capital adequacy, BV/MV:Book value to market value, P/B: Public value to book value, ROA: Return on assets, ROE: Return on equity, EPS: Earning per share
Appendix 2. Relationship between bank efficiency and stock return with FE estimtion.
Approach 𝛼𝑖 prob 𝑏𝑖,𝑚 prob 𝑏𝑖,𝑒𝑓𝑓 prob n 𝑹̅𝟐 prob
Profitability 0.015 0.053* 1.081 0.000*** -0.009 0.835 609 0.417 0.000*** Intermediation 0.014 0.065* 1.081 0.000*** 0.070 0.477 609 0.417 0.000*** Composite 0.015 0.046** 1.081 0.000*** -0.055 0.444 609 0.417 0.000***
***, ** and * indicates significance level of 0.01, 0.05 and 0.10 respectively.
Appendix 3: Dynamic effect of efficiency on stock returns in the short- and long-run with PMG estimator in different approaches for the period of 2003q1-2008q4
Dependent Variable: (stock)
Long-run eq. Short-run equation
market eff. ECT (market) (eff.) c
Profitability 1.193*** 0.060 -1.049*** -0.120 -0.155 0.026** (0.000) (0.306) (0.000) (0.455) (0.297) (0.017) Intermediation 1.098*** -0.199 -1.076*** -0.158 -0.025 0.033*** (0.000) (0.260) (0.000) (0.243) (0.907) (0.007) Composite 1.310*** -0.267** -1.074*** -0.259** 0.0029 0.023* (0.000) (0.017) (0.000) (0.016) (0.620) (0.078)
Note: Values in parenthesis represent probability. The lag structure is ARDL (1, 1, 1) in all models. ECT: Error correction term.
***, ** and * indicates significance level of 0.01, 0.05 and 0.10 respectively.
Appendix 4: Dynamic effect of efficiency on stock returns in the short- and long-run with PMG estimator in different approaches for the period of 2009q1-2017q4
Dependent Variable: (stock)
Long-run eq. Short-run equation
market eff. ECT (market) (eff.) c
Profitability 1.151*** 0.192*** -0.995*** -0.039 -0.058 -0.001 (0.000) (0.002) (0.000) (0.717) (0.167) (0.984) Intermediation 1.166*** -0.319** -0.991*** 0.031 0.336** -0.003 (0.000) (0.024) (0.000) (0.713) (0.0306) (0.590) Composite 1.213*** 0.006 -0.976*** -0.026 0.034 -0.002 (0.000) (0.960) (0.000) (0.788) (0.739) (0.722)
Note: Values in parenthesis represent probability. The lag structure is ARDL (1, 1, 1) in all models. ECT: Error correction term.