MEGA AIRPORT'S FATE DEPENDS ON TURKEY'S GROWTH
POTENTIAL
Seyfettin Gürsel and Tuba Toru Delibaşı Executive Summary
The new airport of Istanbul is planned to be one of the largest in the world with 150 million passenger capacity. The Cengiz-Kolin-Limak-Mapa-Kalyon Consortium, a joint venture of Turkish companies, has won the tender for the new airport, promising to pay 22 billion 152 million Euros (without VAT) to the Turkish Treasury for 25 years starting 2019 ending 2043.The new airport, replacing the current Ataturk Airport in 2019, is planned to be built in three phases. In the first phase, the new airport is projected to accommodate 90 million passenger. Then, there are plans to increase the capacity of the new airport to 120 million in the second phase and then to 150 million in third phase. This big project in terms of capacity and tender price has raised a heated debate on the environmental concerns and profitability. In this report, we focus on the financial part of the problem and provide an analysis on the expected number of passengers and the profitability of business.
To do so, we regress the number of passengers on real GDP per capita, population and real ticket prices, and then forecast the number of enplaned passengers under two scenarios, which differ in terms of real GDP growth, for the period 2013-2043. In the first one, we set growth at 5 percent for the next seven years, which is the admitted potential growth rate for the Turkish economy, then 4 percent until 2030, and, finally, 2 percent up until 2043. In the second scenario, should Turkey be unable to im -plement the necessary reforms in order to secure its potential economic growth, the growth rates used in the forecasts are 4 percent, 3 percent and 1.5 percent, respectively. After obtaining the number of passengers, we predict the aeronautical and non-aeronautical (commercial) revenues depending on passenger forecasts.
We find out that if the Turkish economy grows around its potential in the next 25 years, the expected capacities do not seem unrealistic. But if growth rates stay below the potential level, the airport may only reach the capacity of 120 million passengers by the 2050s. Therefore, the estimated operating profits will be far from compensating the loan repayments and the rent to be paid to the Treasury if the Turkish economy fails to achieve its potential growth. The profitability issue is linked to the number of passengers, given the service prices announced by the Republic of Turkey General Directorate Of State Airports Authority. Taking as benchmarks the financial information of Hartsfield-Jackson Atlanta International Airport, the busiest in the US with about 95 million passengers, as well as those of the Ataturk and Sabiha Gokcen airports, we find that in the first scenario, cumulative losses appear until
Prof. Dr. Seyfettin Gürsel, BETAM, Director, [email protected] Dr. Tuba Toru-Delibaşı, Bahçeşehir University, [email protected]
Research Brief 13/150
2030 because of rent and loan installments. But these losses are largely compensated for later thanks to large profits. Nevertheless, in the second scenario, the profitability of the mega airport might be very problematic unless the consortium succeeds in raising enough non-operational revenue.
Concerning the land devoted to this business, around 3,500 hectares of land appears to be enough to meet the planned airport’s passenger capacity by a basic comparison with Atlanta and Ataturk. The Atlanta Airport, which has now the biggest passenger capacity of the world, 95 million passengers, is built on 1,900 hectares and the Ataturk Airport is built on 1178 hectares while the new airport of Istanbul will be built on around 7,500 hectares. There may be other business opportunities in the extensive area provided to the new airport to raise revenues.
Air Traffic Boom
Turkey, since 2003, has gone through a huge development in the air transportation following a series of reforms in the aviation industry. After the deregulation, the number of carriers in the market did not change a lot but the number of destinations and the flight frequencies have increased significantly. Besides the liberalization, the so called open sky policy, the new regional airports and the renewal of existing airports played an important role, especially in increasing the number of flights and the initiation of new destinations. The increasing capacity of airlines, as well as the development of Turkish Airlines after its partial privatization, led to a significant increase in the air traffic in Turkey. In the last decade, while the average annual air traffic growth rate was 5 percent in the world, the air traffic of Turkey has increased by 16 percent per year on average.
That being the situation in the world, the European air traffic increased by 5.3 percent in 2012 compared to the previous year, but this rate remained at low levels in some European countries due to the economic crisis (EUROCONTROL, 2012).Particularly, in Spain and Greece, the debt crisis resulted in unemployment and economic recession so the growth rate of air traffic stayed at low levels. However, the air traffic continued to grow rapidly in Turkey. As of end of 2012 compared to 2009, the number of flights increased by 29 percent to 1.3 million, and the number of passengers increased by 52 percent to131 million (DHMİ, 2012).
Considering Istanbul Ataturk Airport (IST), the number of flights increased by 38 percent to 1 million and the number of passengers increased by 51 percent to 45 million during the same period (see The new airport would be the only airport in the European side of Istanbul as Ataturk airport will be closed once the new airport starts to operate. Given that the other airport, Sabiha Gokcen Airport, is located on the Asian part of Istanbul, and the new airport will take over the Ataturk Airport's operation, the competition against the new airport will not be strong in terms of aviation. However, due to short distance between most of the big cities and inconvenient locations of airports, the high speed train will be an alternative mode of transportation and a serious competitor against air transportation. Ivaldi and Vibes (2005) show that there is a strong competition between rail and air travel especially on short distances. For example, passengers travelling between Istanbul-Ankara city pair may opt for train instead of air travel. As a result the number of passengers may decrease on this origin-destination which has the highest load factor. Moreover, we need to consider).With an annual traffic of 45 million passengers Ataturk Airport has been providing approximately 35 percent of Turkey's total passenger traffic. The European Organization for Safety of Air Navigation states in their medium and long term report that Ataturk airport traffic will continue to grow by 5.5 percent per year on average (EUROCONTROL, 2012). Based on this expectation, the number of passenger at Ataturk airport will be above 65 million in 2019 and the existing airport will not be able to handle the expected number of passengers in the following years. Until 2012, the authorities were planning to increase the capacity of Ataturk airport by constructing an additional runway and enlarging the terminal building. However, the council of ministers decided to build a new airport project in May 2012. The new airport would be the only airport in the European side of Istanbul as Ataturk airport will be closed once the new airport starts to operate. Given that the other airport, Sabiha Gokcen Airport, is located on the Asian part of
Istanbul, and the new airport will take over the Ataturk Airport's operation, the competition against the new airport will not be strong in terms of aviation. However, due to short distance between most of the big cities and inconvenient locations of airports, the high speed train will be an alternative mode of transportation and a serious competitor against air transportation.0 Ivaldi and Vibes (2005) show that there is a strong competition between rail and air travel especially on short distances. For example, passengers travelling between Istanbul-Ankara city pair may opt for train instead of air travel. As a result the number of passengers may decrease on this origin-destination which has the highest load factor. Moreover, we need to consider
Figure 1. Flight and Passenger Traffic (millions)
2002 2003 2004 2005 2006 2007 2008 2009 2010 2011 2012 0.0 200000.0 400000.0 600000.0 800000.0 1000000.0 1200000.0 0 20000000 40000000 60000000 80000000 100000000 120000000 140000000
Number of flights at IST Number of passenger at IST Total number of passengers
N u m b e r o f f ig h ts N u m b e r o f p as se n ge rs Source: DHMI
car travel as an alternative to air transportation on the short distance. There are on-going and planned highway projects in Turkey. Especially, the North Marmara Highway project would be an alternative for passengers.0For a more comprehensive assessment, for example, on origin-destination basis, we need to consider the competition between modes of transportation (intermodal).
Air traffic and economic growth
Many studies in the literature have shown the sensitivity of the aviation industry to economic conditions. Toru (2011) shows that the increasing fuel prices led to a fall in air traffic of European airlines during the period 2004-2008. There are two main reasons why Turkish aviation industry is not severely affected by the increasing fuel prices in the same period. First, the deregulation of the air transportation in October 2003 increased the activities of private companies (Pegasus, Atlas Jet, Onur Air, etc.) and enlarged the network of Turkish Airlines (THY). The deregulations in the United States of America (1979) and the European Union (1988) lead to an increase in air traffic at first. Then, the air traffic growth rate slowed down and the markets reached equilibrium. Second, Turkey experienced 0 The distance between Istanbul-Ankara city pair is 523 km which is expected to take 3 hours by the high speed train. The project is planned to be completed by the end of 2013. Train stations are located in the city center and one can access easily so passengers may prefer trains rather than air transportation.
strong economic growth in the last decade such that the gross domestic product per capita increased by 43 percent from 2002 to 2012in real terms. This economic growth certainly had a positive impact on air traffic.
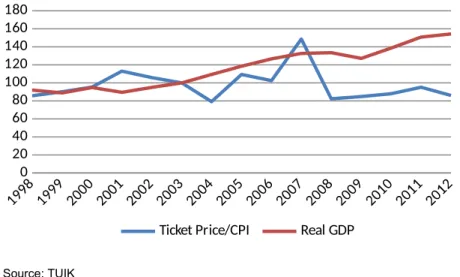
Figure 2 presents the real GDP and relative price of ticket fares indices. After the liberalization in 2003, the relative price of ticket decreased in 2004 but it is followed by an increasing trend until 2008. Since the high fuel prices in this period increased the costs of airlines and almost all of the cost increase had been reflected to ticket prices (Toru, 2011). However, air traffic had increased during the same period (see Figure 1.) According to Figure 1 and Figure 2, we can explain the air traffic growth in the period of 2004-2008 by the rise in real GDP per capita. After 2008, both decreasing ticket fares and increasing real GDP per capita had a positive impact on demand for air transportation.
Figure 2. Real GDP per capita and relative price of ticket (2003=100)
0 20 40 60 80 100 120 140 160 180
Ticket Price/CPI Real GDP Source: TUIK
Historically air traffic is known to be sensitive to economic indicators. For example, the economic crisis has affected airlines, some of which even went bankruptcy, in Europe and in the United States and then the air traffic growth rate decreased (Borenstein and Rose, 2003). Although Turkey witnessed a strong recovery amid the Great Recession, the growth rate decreased to 2.2 percent in 2012 and it is expected that it will be around 4 percent in 2013. Many structural problems like high current account deficit and low productivity gains as well as the end of the international liquidity glut amid the expected change in the FED’s monetary policy are able to constrain Turkish economic growth in the future. It is quite probable that the growth performance of the past ten years could not be repeated in the next ten years.
A comparison with Atlanta airport
The new airport is planned to be one of the largest airport in the world with 150 million passenger capacity. The new airport capacity is planned to have a capacity of 90 million passengers at the first stage then increase to 120 million and to 150 million at the last stage. In order to analyze the new airport, we first make a comparison with the Hartsfield-Jackson Atlanta International (ATL) airport which is the world’s largest airport in terms of passenger traffic. Atlanta airport has been the world’s
busiest airport every year since 2000 and held its ranking in 2012 by accommodating 95 million passengers.0
Capacity and Location
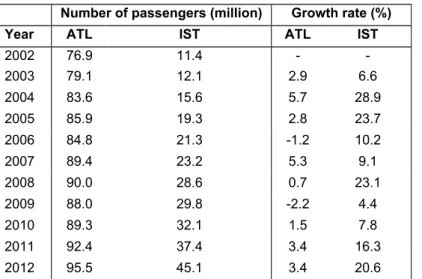
The Atlanta airport, which has five Runways, has accommodated 95 million passengers with 952 thousands flights in 2012. Ataturk airport has three Runways and had approximately 45 million passengers with 364 thousand flights in 2012. The number of passengers has increased by 300 percent from 2002 to 2012 at Ataturk airport while Atlanta airport had a 25 percent increase. The average air traffic growth rate per year was 15 percent for Ataturk airport and 2.2 percent for Atlanta airport during the last ten-year period. Table 1 presents the number of passengers and its growth rate for the last eleven years.
Table 1 Number of Passengers and growth rate
Number of passengers (million) Growth rate (%)
Year ATL IST ATL IST
2002 76.9 11.4 - -2003 79.1 12.1 2.9 6.6 2004 83.6 15.6 5.7 28.9 2005 85.9 19.3 2.8 23.7 2006 84.8 21.3 -1.2 10.2 2007 89.4 23.2 5.3 9.1 2008 90.0 28.6 0.7 23.1 2009 88.0 29.8 -2.2 4.4 2010 89.3 32.1 1.5 7.8 2011 92.4 37.4 3.4 16.3 2012 95.5 45.1 3.4 20.6
Source: Federal Aviation Administration (FAA) and General Directorate of State Airports Authority (DHMI)
Ataturk airport passenger traffic reached 45 million last year but there were long delays in many flights. The main reason behind these delays was the insufficient physical capacity of the airport. Additionally, Ataturk airport cannot provide the necessary conditions for some of the new aircrafts. It has three runways, two of which are 2.6 thousand meters long and the third one is 3 thousand meters. However, in 2012, Turkish Airlines have ordered 15 Boeing 777-300 aircraft to be delivered in 2018 and at least 3.38 thousand meter runway is needed for these aircrafts. Therefore, a larger airport is needed in order to meet the increasing passenger traffic and the technical requirements of the airlines.
Many studies have shown that airport characteristics are important in air transportation demand (see Caves and Thomson, 1993, Nijkamp et al., 1998 and Ivaldi et al., 2012).For instance, passengers do care about the distance to the city center and easy access to the airport when they make their travel decisions. Atlanta airport is 16.1 kilometers from Atlanta city center and provides good transportation options such as shuttles, bus, train, rental car, etc. There are 33,500 parking areas, many bus connections and a high-speed train station at the airport. Atlanta city center takes about 20 minutes by fast train and the ticket price is only 2.5 U.S. dollars. Also a taxicab costs about 30 U.S. dollars (ATL 0 Hartsfield-Jackson Atlanta International (ATL) airport reports, 2012.
Reports, 2012). Likewise, Ataturk airport is 16 km far from the city center. There is a subway station and taxicab as transportation options. However, the new airport is approximately 42 km to the city center and the access to the airport depends on the transportation infrastructure project which is still at its planning stage. A glitch in the project and/or an insufficiency of the transportation infrastructure may result in a lower demand for the air transportation from the new airport than it is expected.
Considering the area of airports, Atlanta airport having5 runways is constructed on 1,900 hectares while the area of Ataturk airport having 3 runways is 1178 hectares. The land reserved for the new Istanbul airport with 6 runways is 7,400 hectares. The biggest U.S. airport according to land is Denver International Airport which has6 runways and stands on a land area of 13000 hectares. Although it is the biggest in terms of available capacity and land, the annual passenger traffic of Denver airport was only 53 million in 2012. It has been running under its potential capacity. It is stated that the new Istanbul airport will be the world’s largest airport in terms of passenger traffic and the fifth largest in terms of area. Given the land areas of the Ataturk, Atlanta and Denver airports, we make a rough calculation of the land needed for the new Istanbul airport. Considering the number of passenger at 150 million passengers, the land needed will be about three times the capacity of Ataturk airport. Having in mind that Ataturk airport is not big enough, we assume that the area needed for the new Istanbul airport will be more than three times of the area of Ataturk airport. Based on this, the land needed may be estimated to be around 4000hectares which is just more than the half of the area planned (7,400 hectares) for the new Istanbul airport. Even if we assume that the expected number of passengers is realized, whether a land of 7,400 hectares wide is needed or not is a matter of debate. However, we need to remark that the land allocated to the new airport may not be the definitive one due to the lack of precise measurements for the construction of the airport. These measurements are important not only for the neglected environmental factors but also for the airport security (the direction of the wind, erosion, subsidence and other factors). Particularly, the wind measurements and estimates are vital to find optimal position of runways. The runways should be positioned considering the cross-winds in order to increase the traffic capacity and security of the airport. Any measurement error may cause over or under investment in capacity.0Thus, a detailed wind data analysis and forecasts should be performed before constructing airports. Moreover, a detailed research has to be done before the project is realized in order to construct an airport which is convenient for air transportation and profitable for its managing company. The companies bidding for the project had a period of less than a year to prepare their offer before the bid. The consortium highlighting their experiences in the construction industry states that they can handle the field research and measurements in a very short time.0In that case, if the details of the plan for the new Istanbul airport can be shared with the public as soon as possible, the worries and uncertainty on the issue could be eliminated.
0 Airport Research Center report, http://www.airport-consultants.com/images/download/pl-osp_rdo.pdf
The Hub
Atlanta airport serves as the hub of Delta Airlines which is the largest air carrier in the world. In 2012, Delta airlines had carried 63.4 million passengers to/from Atlanta airport which is 66.4 percent of the total number. In addition to this, Delta Airlines has connecting flights with seven regional carriers which carried 12 million passengers in 2012. So, Delta Airlines together with its regional partners had carried 78 million passengers to/from the Atlanta airport in 2012.Likewise, the Ataturk airport is serving as a hub to Turkish Airlines. In 2012, Turkish Airlines had carried 72 percent of international passengers and 74 percent of domestic passengers of the Ataturk airport. While Delta Airlines had 78 million passengers at the Atlanta airport, Turkish Airlines has only 32.7 million in 2012. Turkish Airlines needs to pursue 15 percent annual average growth rate in order to be as big as Delta Airlines. In terms of fleet, Delta Airlines has 719 aircraft while Turkish airline has 202. But, Turkish airline ordered 117 aircraft from Airbus and 95 from Boeing so the number of fleet will increase to 414 aircraft. According to aircraft orders of Turkish Airlines, it is expected that it will continue to grow (Turkish Airlines Report, 2012).
During the last decade, Turkish airline was growing while some of the European airlines had suffered operational losses. However, these European airlines are in recovery period which may deteriorate the growth pattern of Turkish Airlines in the future. The new airport will take over the operations of Ataturk airport and any slowdown in the growth of Turkish Airlines will lead to lower number of passengers than expected. In another case, when Turkish Airlines continues to grow rapidly and the new airport is not completed, Turkish Airlines will be obliged to postpone its growth plan due to inadequate airport capacity. Considering efficiency levels of Delta Airlines and Turkish Airlines, they have very similar capacity utilizations. The load factor of Delta airline is 83.8 percent and it is 77.4 percent for Turkish Airlines. Air transport is a capital-intensive sector with high fixed costs, the efficient use of the full capacity is important for airlines in order to decrease marginal cost of an additional passenger.
Another reason that Atlanta airport is such a big hub that it is located a two-hour flight from many major cities in the east side of the United States. Hence, the Atlanta airport is an attractive transfer point for the domestic as well as the international flights. However, it is not the case for the Ataturk airport. As the distance between two cities in Turkey is shorter than in the United States, the new Istanbul airport cannot be a very big transfer point for the domestic flights which are mostly direct. After all, the main target of the authority is to make Istanbul a global hub for passengers from Europe, Africa and Asia, and compete especially with the Gulf region. In 2012 the Ataturk airport has accommodated 10 million transit passengers and the number of transit passengers is growing fast. Moreover, Turkish Airlines has become a member of Star Alliance in 2008 and has gained the support of passenger traffic of United Airlines and Lufthansa. Thus, Turkish Airline has increased its transit traffic for the last five years. The new Istanbul airport can be an attractive stopover hub compared to Gulf Region airports due to the growth of transit passenger number and also the tourism potential of Istanbul.
Operating Revenue
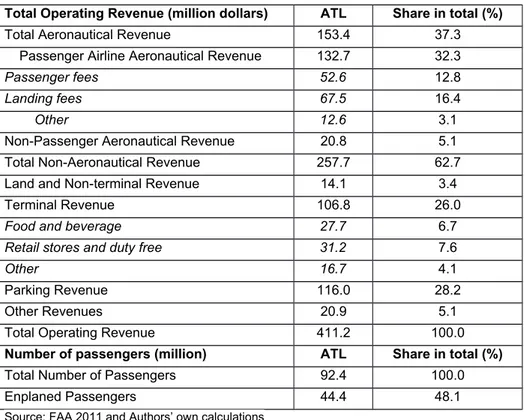
Airports provide both aeronautical and non-aeronautical services. Although aviation services are the main mission of airports, airports have realized that they can generate a significant amount of non-aeronautical services revenue such as parking, restaurants, shops and other commercial centers. The big hub airports are generating in average 40 percent of their revenue from non-aeronautical (e.g. commercial) activities and the rest from the aeronautical services.0Table 2 presents the total operating revenue and the number of passengers in the Atlanta airport. In 2011, the total operating revenue of Atlanta airport was 411 million dollars. The Atlanta airport generated almost 63 percent of its total operating revenue from non-aeronautical services and the rest, 37 percent, from aeronautical services (see Table 2).
Table 2 Atlanta Airport Operating Revenue and Number of Passengers (2011)
Total Operating Revenue (million dollars) ATL Share in total (%)
Total Aeronautical Revenue 153.4 37.3 Passenger Airline Aeronautical Revenue 132.7 32.3
Passenger fees 52.6 12.8
Landing fees 67.5 16.4
Other 12.6 3.1
Non-Passenger Aeronautical Revenue 20.8 5.1 Total Non-Aeronautical Revenue 257.7 62.7 Land and Non-terminal Revenue 14.1 3.4 Terminal Revenue 106.8 26.0
Food and beverage 27.7 6.7
Retail stores and duty free 31.2 7.6
Other 16.7 4.1
Parking Revenue 116.0 28.2 Other Revenues 20.9 5.1 Total Operating Revenue 411.2 100.0
Number of passengers (million) ATL Share in total (%)
Total Number of Passengers 92.4 100.0 Enplaned Passengers 44.4 48.1
Source: FAA 2011 and Authors’ own calculations
In Table 2 the total aeronautical revenues consist of two main items: passenger airline aeronautical revenue and non-passenger aeronautical revenue. There are passenger fees (fee charged by airport per enplaned passenger), landing fees (fee charged by airport per aircraft landing) and other passenger revenues under passenger airline revenue. The non-passenger aeronautical revenue includes the landing fees charged to freight and military carriers, fuel taxes, hanger fees, maintenance fees.
There are four main items under the total non-aeronautical revenue (e.g. commercial revenue): Land and terminal revenue, terminal revenue, parking revenue and other revenues. Land and non-0 Writers’ own calculation from the FAA 2012.
terminal revenue comprises the rental revenues from airport area such as building and storages. Terminal revenue is coming from food and beverage shops, retail stores, duty free shops and other small commercial points (e.g. telecommunication, banks, advertisements, internet and etc.). The sum of car parking and ground transportation revenues is listed as parking revenue.
The Atlanta airport obtained 32 percent of its total operating revenue from passenger airline services, 63 percent from commercial services and 5 percent from other non-passenger services. The CEO of LIMAK holding, Nihat Ozdemir, states that the passenger airline revenue is expected to be the one third of the total operating revenue of the new Istanbul airport.0 Thus, one can assume that the consortium plans to have similar revenue mechanism.
Is the expected number of passengers realistic?
As mentioned above, the average annual growth rate of air traffic was 16 percent for the last decade in the Ataturk airport. The air traffic has grown very fast due to deregulation of air transportation and development of airlines. As the air traffic in Istanbul is expected to continue increasing, a need for a larger airport is obvious. In this section, we assess whether the expected number of passengers is realistic or not. In order to do so, first we estimate a regression model and then predict the number of passengers under two different scenarios for the following thirty years.
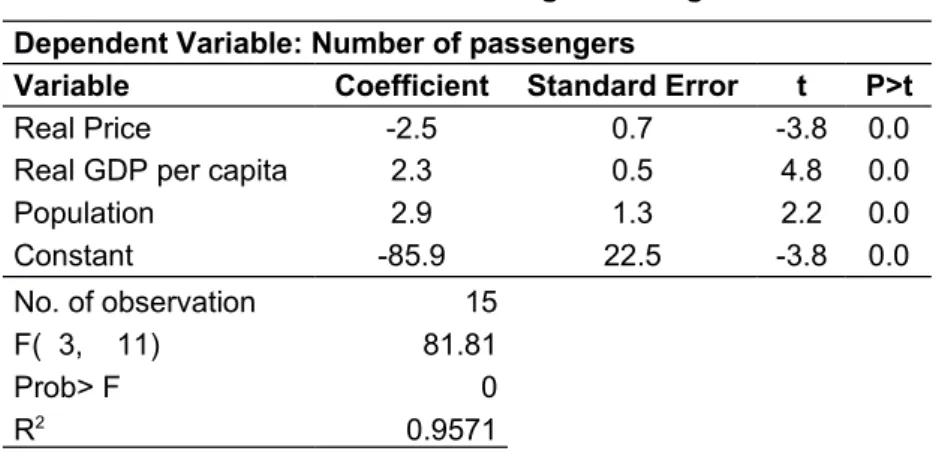
The enplaned passenger forecasts are developed using a bottom-up approach based on a regression model using socioeconomic variables. A reduced form econometric model is specified in order to estimate the number of passengers. We regress the number of passengers on the real ticket prices, real GDP and population.0After obtaining the regression parameters, we estimate the number of passengers (domestic, international and connecting separately) for each year in the period 2013-2043 under two different simulations.
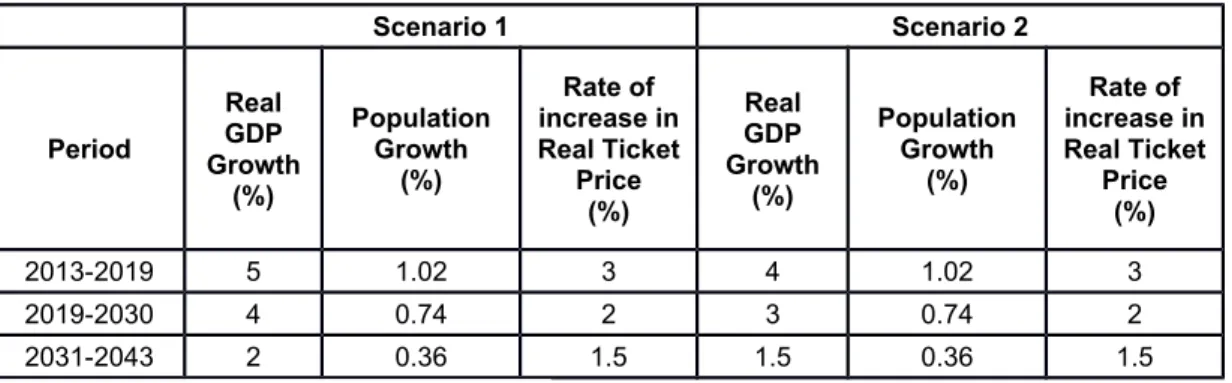
In Scenario 1, we determine the growth rate of real GDP as 5 percent for the period 2013-2019, 4 percent for the period 2020-2030 and 2 percent for the period 2031-2043during the period of 2013-2043 according to the OECD medium and long term predictions. These rates are also adopted by the Medium Term Program of Turkey and it is also quoted by many economists that these rates are the potential economic growth rates for Turkey. However, the realization of the potential growth rate is possible only if the necessary structural reforms are performed in order to overcome the restriction such as low savings and low competition power. If the necessary structural reforms are not done then the potential growth rate will not be attained. Hence, we set up Scenario 2 which has lower economic growth rates such as 4 percent for the period 2013-2019, 3 percent for the period 2020-2030 and 1.5 percent for the period 2031-2043. We also have some assumptions on the population growth and ticket prices which are similar under two scenarios. We adapt Turkish Statistics Institute (TUIK) population increase projection, that is, 1.02 percent for the period 2013-2019, 0.74 percent for the period 2020-2030 and 0.36 percent for the period 2031-2043 are assumed. Considering ticket fares, we posit an increase of 3 percent for 2012-2019, 2 percent for 2020-2030 and 1.5 percent for 2031-2043. Our two scenarios have difference in terms of economics growth assumption (see Table 3). 0 Bloomberg Businessweek Turkey journal, 12-18 May 2013.
Table 3 Growth Rates for Real GDP, Population and Ticket Price under Scenarios 1 and 2 Scenario 1 Scenario 2 Period Real GDP Growth (%) Population Growth (%) Rate of increase in Real Ticket Price (%) Real GDP Growth (%) Population Growth (%) Rate of increase in Real Ticket Price (%) 2013-2019 5 1.02 3 4 1.02 3 2019-2030 4 0.74 2 3 0.74 2 2031-2043 2 0.36 1.5 1.5 0.36 1.5
Source: OECD, TUIK and Authors’ own calculations.
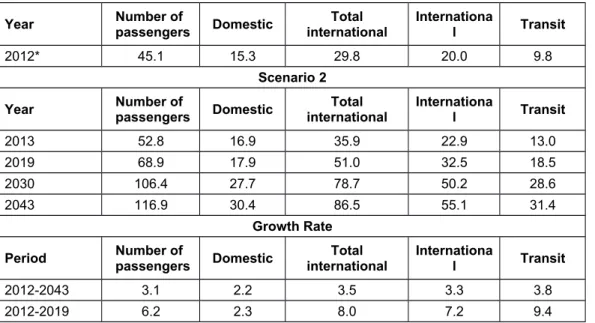
Having predicted the number of passengers, we distinguish domestic, international and transit passengers according to past observations. In other words, we first project the growth rate of domestic and total international (i.e. international and transit) passengers in the Ataturk airport during 2005-2012 on the period 2012-2019. Then, the shares of domestic passengers and international passengers in the total number of passengers are taken respectively 26 percent and 74 percent in the period 2019-2043. For the period 2012-2043, the average annual growth rates are 4.9 percent for total number of passengers, 4 percent for domestic and 5.3 for international passengers under Scenario 1. Considering Scenario 2, the rates are respectively 3.1 percent, 2.2 percent and 3.5 percent.(Bu tahminleriregresyonhesabındakikatsayılarileilişkilendirmeklazım). In order to identify the number of transit passengers, we use the observations from Turkish Airlines. Precisely, we assess the variation of this during the period from 2005 to 2012 then reflect the rate of variation on the period 2013-2043. According to our predictions, the total number of passengers at the new airport will be 80 million under Scenario 1 and 68 million under Scenario 2 in 2019. The distribution of domestic, international and transit passengers are respectively 21 million, 38 million and 22 million under Scenario 1 while they are in that order 18 million, 32 million and 19 million passengers under Scenario 2.
Having in mind that 90 million passengers are targeted for the new Istanbul airport in 2019, the capacity utilization in terms of the number of passengers will be 89 percent under Scenario 1. This capacity utilization rate is a relatively acceptable (see Barnhart and Vaze, 2012). However, in Scenario 2 the capacity utilization rate will be 76 percent. As previously mentioned, actually the Ataturk airport does not have enough capacity to accommodate 45 million passengers. Considering the estimates in Table 4 and Table 5, the current capacity of the Ataturk airport will not be sufficient until the new Istanbul airport built.
Remember that the targeted number of passengers is 120 million and 150 million for the last two phases. Are these targets realistic? To answer this question, we predict the number of passengers until the end of the contract of the consortium. The results are presented in Table 10 and Table 11.According to the results, the new airport could reach its 150 million passengers capacity by the 2030s if Turkey manages to grow around 5 percent between 2012-2019, 4 percent between 2019-2030 and 2 percent between 2019-2030-2050 in Scenario 1. However, in Scenario 2, the planned airport could reach a maximum capacity of 120 million passengers by the 2050s if Turkey manages to grow 4
percent during the period 2012-2019, 3 percent during the period 2019-2030 and 1.5 percent during the period 2030-2043, in the light of the Turkish economy’s structural problems.
We find that the new Istanbul airport will only reach its potential of 150 million passengers in the 2030s if Turkey achieves sustainable growth, otherwise the airport may only reach the capacity of 120 million passengers by the 2050s. Particularly, if the economic growth remains below its potential due to the lack of implementing key structural reforms, the expected number of passenger traffic will not be attained during the contract period.
Table 4 The Number of Passengers (million) and the Growth Rates (%) under Scenario 1
Year passengersNumber of Domestic internationalTotal International Transit
2012* 45.1 15.3 29.8 20.0 9.8
Scenario 1
Year passengersNumber of Domestic internationalTotal International Transit
2013 54.0 17.3 36.7 23.4 13.3 2019 80.3 20.9 59.4 37.9 21.6 2030 158.2 41.1 117.0 74.5 42.5 2043 201.1 52.3 148.8 94.8 54.0
Growth rate
Period passengersNumber of Domestic internationalTotal International Transit
2012-2043 4.9 4.0 5.3 5.2 5.6 2012-2019 8.6 4.6 10.4 9.6 11.9 2019-2030 6.4 6.4 6.4 6.4 6.4 2030-2043 1.9 1.9 1.9 1.9 1.9
Source: Authors’ own calculations * Actual values in 2012
Table 5 The Number of Passengers (million) and the Growth Rates (%) under Scenario 2
Year passengersNumber of Domestic internationalTotal International Transit
2012* 45.1 15.3 29.8 20.0 9.8
Scenario 2
Year passengersNumber of Domestic internationalTotal International Transit
2013 52.8 16.9 35.9 22.9 13.0 2019 68.9 17.9 51.0 32.5 18.5 2030 106.4 27.7 78.7 50.2 28.6 2043 116.9 30.4 86.5 55.1 31.4
Growth Rate
Period passengersNumber of Domestic internationalTotal International Transit
2012-2043 3.1 2.2 3.5 3.3 3.8 2012-2019 6.2 2.3 8.0 7.2 9.4
2019-2030 4.0 4.0 4.0 4.0 4.0 2030-2043 0.7 0.7 0.7 0.7 0.7
Source: Authors’ own computations * Actual values in 2012
Operating Revenue and Cost Analysis for the New Istanbul Airport
The second main question of the report is about how the airport could become profitable despite its huge costs. To assess the feasibility of the new airport, we predict the aeronautical and non-aeronautical (commercial) revenues depending on the predicted number of passengers and the financial report presented in Table 2.
According to the conditions of the bid, the new airport will charge 20 Euros per an international passenger, 5 Euros per a transit passenger and 3 Euros per domestic passenger. The total passenger revenue is calculated by multiplying these prices by the corresponding number of enplaned passengers. Considering the revenue obtained from landing, we obtain the number of aircraft landing by dividing the number of domestic and the total international passengers by average number of passengers per aircraft.0 Then, we multiply the number of aircraft landing by the average maximum aircraft weight (190 tons). And lastly, we use the regulated prices listed by General Directorate of State Airports Authority of Turkey (DHMI) to obtain the landing revenue.0The fees charged to passenger like airport security are collected under the name of other passenger revenue which is assumed to be one quarter of the passenger revenue similar to the Atlanta airport. Following the statement of the consortium and the financial statement of Atlanta airport, we assume that the commercial (non-aeronautical) revenue will be double of the revenue from passengers. To compute the operating cost, we assume that the profit margin will be 30 percent for the new airport similar to the other two airports in Istanbul, namely, Ataturk and Sabiha Gokcen airports (Operation Report of TAV and Sabiha Gokcen, 2012). We present the predicted operating revenue and cost of the new Istanbul airport for the year 2019 in Table 6.
Table 6 Operating Revenue and Cost (million Euros, 2019)
Scenario 1 Scenario 2
Total Operating Revenue 2995.1 2569.5
Passenger Airline Revenue 998.4 856.5
Passenger Revenue 463.9 397.9
Domestic 31.3 26.9
Total International (international+transit) 432.5 371.1
Landing Revenue 418.5 359.1
Other Passenger Revenue 116.0 99.5
Other Operating Revenue (Non Passenger+Ground and Non-terminal
Revenue+Terminal Revenue+Parking Revenue+Other Revenue) 1996.7 1713.0
Total Operating Cost -2096.6 -1798.7
Net Operating Profit/Loss 898.5 770.9
Source: Authors’ own computations
0 We use the fleet structure of Turkish Airlines and its load factor to calculate the average number of passengers per flight. It is computed to be 123.
In Scenario 1, the passenger airline revenue is estimated to be 998 million Euros and the other operating revenue is 1 billion 996 million Euros. Then, the total operating revenue is computed to be 2 billion 995 million Euros and the operating cost is 2 billion 96 million Euros under the assumption of 30 percent profit margin.
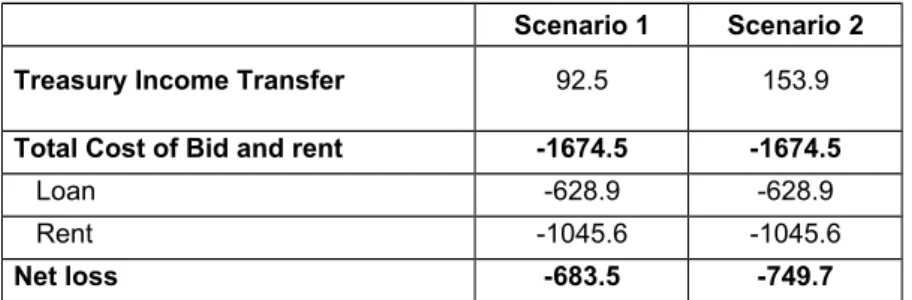
Besides the operating revenue and cost, we need to consider the bid conditions which also generate some revenue and cost to the consortium. According to bid conditions, there are three main issues to focus on. Firstly, the Treasury gives a guarantee on the number of passengers such that it will pay the consortium 6.3 billion Euros for the first 12 years covering the international and transit passengers. This means that if the consortium obtains less than 525 million Euros of passenger revenue from international and transit passengers, then the Treasury will transfer the difference to the consortium. If the consortium gathers more than 525 million Euros, it will transfer the difference to the Treasury. For example, in 2019, as the revenue from total international passengers is 432.9 million Euros, which is less than the guarantee, the Treasury will transfer 92.5 million Euros to the consortium in the first scenario.
Secondly, the consortium promised to pay approximately 26.1 billion Euros (including VAT) for 25 years starting from 2019 ending 2043. Hence, the rent paid by the consortium will be 1 billion 45 million Euros per year. Thirdly, the consortium is planning to take a loan of 6 billion Euros for construction cost of about 7.5 billion Euros. Nihat Ozdemir, CEO of LIMAK, mentioned that it would be possible to find a loan for 16 years without repayments for the first 4 years. Therefore, we assume that the consortium will have a loan for 16 years without repayments for the first 4 years at an interest rate of 4 percent per year. We compute the interest rate by adding a half point of risk premium to the Eurobond interest rate of 3.5 percent. We want to point out that this interest rate is the lowest rate that they can find under the current economic conditions. Under these assumptions, the repayment of the loan will be 628.9 million Euros per year.
Table 7presents the predicted financial position of the new airport including the conditions of bid. In Scenario 1, the consortium will have a loss of 683.5 million Euros. That is to say, the operating profit of airport will not be sufficient to pay the rent and the loan repayments. The situation will be even worse in the case of low economic growth (Scenario 2) and the loss will be equal to 749.7 million Euros when the airport starts to operate.
Table 7 Financial Statement with the Bid Conditions (million Euros, 2019)
Scenario 1 Scenario 2 Treasury Income Transfer 92.5 153.9
Total Cost of Bid and rent -1674.5 -1674.5
Loan -628.9 -628.9 Rent -1045.6 -1045.6
Net loss -683.5 -749.7
Source: Authors’ own computations
In these computations, we only consider the operating revenue (i.e. predicted aeronautical and commercial revenues), operating cost and the bid conditions. However, it is well-known that the
operating services are not the only revenue resource for airports. There are non-operating activities (e.g. passenger facility, real estate, sponsorship and etc.) which generate extra revenue to airports. For instance, the new airport can charge an extra fee to passengers through passenger facility fees which are collected to finance some projects at the airport. We look at the ratio of total non-operating revenue to total operating revenue in some hub airports in order to predict non-operating revenue of the new Istanbul airport. Atlanta airport generates an amount, which is equal to 42 percent of total operating revenue, through non-operating services. This ratio is 25 percent for Los Angeles airport and 22 percent for the John F. Kennedy airport.
Predicted Return of the Consortium
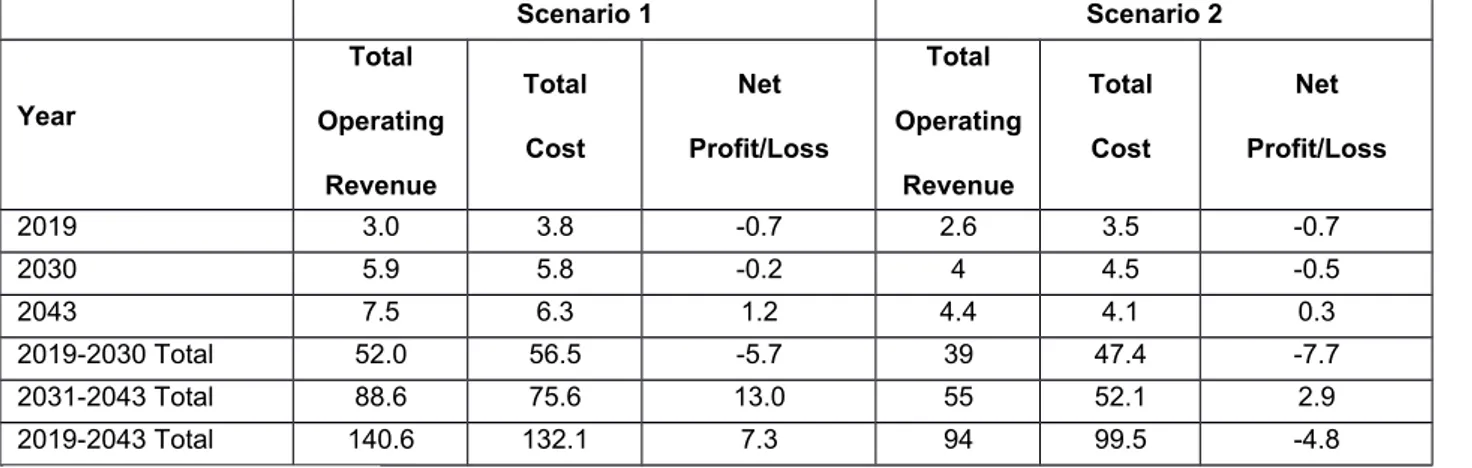
We compute the revenue and cost of the new airport for the whole contract period and the summary of results are presented in Table 8 (see Appendix Table 12 for the details). Remember that we consider the prices charged to passenger by the airport constant for the period 2019-2043.0 However, the tariff may change for the following years.
Table 8 Revenue and Cost during 2019-2043 (billion Euros)
Scenario 1 Scenario 2 Year Total Operating Revenue Total Cost Net Profit/Loss Total Operating Revenue Total Cost Net Profit/Loss 2019 3.0 3.8 -0.7 2.6 3.5 -0.7 2030 5.9 5.8 -0.2 4 4.5 -0.5 2043 7.5 6.3 1.2 4.4 4.1 0.3 2019-2030 Total 52.0 56.5 -5.7 39 47.4 -7.7 2031-2043 Total 88.6 75.6 13.0 55 52.1 2.9 2019-2043 Total 140.6 132.1 7.3 94 99.5 -4.8
Source: Authors’ own computations
Under the constant price assumption, our results show that the new airport is expected to post a loss until 2030, when the loans are repaid. The accumulative loss would reach 5.7 billion Euros in Scenario 1 and 7.7 billion Euros in Scenario 2 by 2030. The planned airport, however, could accumulate 7.2 billion Euros of profit by the end of 2043 in the first scenario. But the new airport would suffer from 4.8 billion Euros of loss by 2043 in the second scenario.
Certainly, the firms in the consortium had done their computations and we cannot evaluate to what extent our estimates are similar to the calculations of consortium. But we can state that the operating revenue of the new airport will not be sufficient to cover operating cost, rent and loan repayments. Unless the non-operating revenues are high enough, the new Istanbul airport as a business will not be profitable under the existing rental conditions and predicted revenues.
Conclusion
The 25-year period is a very long to determine how the Turkish economy will progress. Therefore, in this study we specify two scenarios on the real GDP growth rate. In Scenario 1, we assume the growth rate will be at its potential and Scenario 2 draws a more conservative economic progress. The results point out three important issues.
First, the airport could reach its 150 million passengers capacity by the 2030s if Turkey manages to grow around 5 percent between 2013 and 2019, 4 percent between 2020 and 2030 and 2 percent between 2031and 2043 in the first scenario. So, a 90 million capacity in the first stage seems more than reasonable and 150 million passengers would be achieved around 2030. However, if the Turkish economy continues to be trapped in a low growth regime, the slightly lower growth rates would have a decisively adverse impact on the number of passengers. In the second scenario, the number of passengers hardly reaches 70 million in 2019 and the planned airport could reach a maximum capacity of 117 million passengers by the 2043 if Turkey manages to grow 4 percent between 2013-2019, 3 percent between 2020-2030 and 1.5 percent between 2031-2043,in the light of the Turkish economy’s structural problems. Particularly, if the economic growth remains below its potential due to the lack of implementing key structural reforms, the passenger traffic will remain below 120 million in 2043. Therefore, the requirement for a mega airport in Istanbul depends crucially on the future growth performance of the Turkish economy.
The second issue is about how the airport could become profitable despite its huge costs. The profitability issue is linked to the number of passengers and flights, given the agreed service prices in the tender. Taking as benchmarks the financial information of Hartsfield-Jackson Atlanta International Airport, the busiest in the US with about 95 million passengers, as well as those of the Ataturk and Sabiha Gokcen airports, our results show that in the first scenario cumulative losses of 5.7 billion Euros appear until 2030 because of rent and loan installments. But these losses are largely compensated for thanks to large profits and the cumulative profit is estimated to reach 7.2 billion Euros by the end of the end of the tender period. Nevertheless, in the second scenario, the cumulative losses is estimated to be 4.8 billion the profitability of the mega airport might be very problematic unless the consortium succeeds in raising enough non-operational revenue from real estate developments in the extensive area (7.400 hectares) provided to the new airport. As the consortium could not undertake such losses, there would be two possibilities: the loss would most probably be compensated by extra charges on passengers or the consortium would try to get some non-operational incomes on the land.
Finally, around 4000hectares of land appears to be enough to meet the planned airport’s passenger capacity by a basic comparison with Atlanta and Ataturk. The Atlanta Airport, which has now the biggest passenger capacity of the world, 95 million passengers, is built on 1900 hectares and the Ataturk Airport is built on 1178 hectares while the new airport of Istanbul will be built on around 7500 hectares. May the extra land be a carrot aiming to make the project enough attractive, so profitable, through estate developments? We are not able to answer this question.
References
Borenstein, S. and Rose, N. L. (2003): "Do Airline Bankruptcies Reduce Air Service?", NBER Working Papers 9636, National Bureau of Economic Research Inc.
DHMI (2012): “Aviation Reports”, Retrieved from DHMİ website, http://www.dhmi.gov.tr/
EUROCONTROL(2012): “Seven-Year Forecast September 2012”, retrieved from EUROCONTROL website.
Federal Aviation Administration (2012): “Financial Reports”.retrieved from FAA website.http://www.faa.gov/airports/airport_safety/airportdata_5010/
Fu, X., Oum, T.H., and Zhang, A. (2010): “Air Transport Liberalization and Its Impacts on Airline Competition and Air Passenger Traffic”, Transportation Journal, Volume 49, Number 4,pp 24-41. Ivaldi, M., Sokullu, S. and Toru, T. (2012): “Are Airports Two-Sided Platforms?: A Methodological Approach”, Pricing Behavior and Non-Price Characteristics in the Airline Industry, Editor J. Peoples, Volume 3 of Advances in Airline Economics, Chapter 10, Emerald Group Publishing Ltd.
Ivaldi, M., Sokullu, S. and Toru, T. (2013):“Airport Prices in a Two-Sided Framework”, Working paper IDEI.
Ivaldi, M. and Vibes, C. (2005): “Intermodal and Intramodal Competition in Passenger Rail Transport”, Toulouse: IDEI.
Pels, E., Nijkamp, P. and Rietveld, P. (1998): “Equilibrium Airfares.Frequencies and Airport Taxes in a Multiple Airport Region: an Application of the Nested Logit Demand Model”, Free University, mimeo. Starkie, D. and Yarrow, G. (2009): “Single till approach to the price regulation of airports “ (Tech. Rep.), The UK Civil Aviation Authority.
TAV (2012): “Operating Reports”, retrieved from TAV website.
http://www.tavyatirimciiliskileri.com/tr-TR/pages/faaliyet_raporlari.aspx
Thompson, A. and Caves, R. (1993): “The Projected Market Share for a New Small Airport in the North of England”, Regional Studies, Volume 27, Number 2, pp 137-147.
Toru, T. (2011): “European Air Traffic Facing Raising Fuel Prices and Carbon Permits: An Empirical Analysis”, Toulouse School Economics, working paper.
TUIK (2012): “Population Projections 2013-2075”, retrieved from TÜİK website. www.tuik.gov.tr
Vaze, V. and Barnhart, C. (2012): “An assessment of the impact of demand management strategies for efficient allocation of airport capacity”, International Journal of Revenue Management, Volume 6, Issue 1, pp 5-27.
Appendix
Table 9 Estimation Results for the log-linear regression model
Dependent Variable: Number of passengers
Variable Coefficient Standard Error t P>t
Real Price -2.5 0.7 -3.8 0.0
Real GDP per capita 2.3 0.5 4.8 0.0
Population 2.9 1.3 2.2 0.0 Constant -85.9 22.5 -3.8 0.0 No. of observation 15 F( 3, 11) 81.81 Prob> F 0 R2 0.9571
Table 10 The Number of Passengers (million) and the Growth Rate (%) in Scenario 1
Year passengersNumber of Domestic internationalTotal International Transit
2012* 45.1 15.3 29.8 20.0 9.8
Scenario 1
Year passengersNumber of Domestic internationalTotal International Transit
2013 54.0 17.3 36.7 23.4 13.3 2014 57.8 17.9 39.9 25.4 14.5 2015 61.8 18.5 43.3 27.6 15.7 2016 66.1 19.2 46.9 29.9 17.0 2017 70.6 19.8 50.8 32.4 18.4 2018 75.3 20.3 55.0 35.0 20.0 2019 80.3 20.9 59.4 37.9 21.6 2020 85.8 22.3 63.5 40.5 23.1 2021 91.6 23.8 67.8 43.2 24.6 2022 97.8 25.4 72.4 46.1 26.3 2023 104.2 27.1 77.1 49.1 28.0 2024 111.0 28.9 82.2 52.3 29.8 2025 118.0 30.7 87.3 55.6 31.7 2026 125.3 32.6 92.8 59.1 33.7 2027 133.0 34.6 98.4 62.7 35.7 2028 141.0 36.7 104.4 66.5 37.9 2029 149.4 38.8 110.6 70.4 40.1 2030 158.2 41.1 117.0 74.5 42.5 2031 162.0 42.1 119.9 76.4 43.5 2032 165.8 43.1 122.7 78.1 44.5 2033 169.5 44.1 125.4 79.9 45.5 2034 173.1 45.0 128.1 81.6 46.5 2035 176.7 45.9 130.7 83.3 47.5 2036 180.1 46.8 133.3 84.9 48.4 2037 183.4 47.7 135.7 86.5 49.3 2038 186.7 48.5 138.1 88.0 50.1 2039 189.8 49.4 140.5 89.5 51.0 2040 192.8 50.1 142.7 90.9 51.8 2041 195.7 50.9 144.8 92.3 52.6 2042 198.5 51.6 146.9 93.6 53.3 2043 201.1 52.3 148.8 94.8 54.0 Growth Rate
Period passengersNumber of Domestic internationalTotal International Transit
2012-2043 4.9 4.0 5.3 5.2 5.6
2012-2019 8.6 4.6 10.4 9.6 11.9
2019-2030 6.4 6.4 6.4 6.4 6.4
2030-2043 1.9 1.9 1.9 1.9 1.9
Source: Authors’ own computations * Actual values in 2012
Table 11 The Number of Passengers (million) and the Growth Rate (%) in Scenario 2
Year passengersNumber of Domestic internationalTotal International Transit
2012* 45.1 15.3 29.8 20.0 9.8
Scenario 2
Year passengersNumber of Domestic internationalTotal International Transit
2013 52.8 16.9 35.9 22.9 13.0 2014 55.3 17.1 38.2 24.3 13.9 2015 57.9 17.4 40.5 25.8 14.7 2016 60.5 17.6 43.0 27.4 15.6 2017 63.3 17.7 45.5 29.0 16.5 2018 66.0 17.8 48.2 30.7 17.5 2019 68.9 17.9 51.0 32.5 18.5 2020 72.0 18.7 53.3 33.9 19.3 2021 75.2 19.6 55.7 35.5 20.2 2022 78.5 20.4 58.1 37.0 21.1 2023 81.9 21.3 60.6 38.6 22.0 2024 85.3 22.2 63.1 40.2 22.9 2025 88.7 23.1 65.6 41.8 23.8 2026 92.1 23.9 68.2 43.4 24.7 2027 95.6 24.9 70.8 45.1 25.7 2028 99.2 25.8 73.4 46.7 26.6 2029 102.8 26.7 76.0 48.4 27.6 2030 106.4 27.7 78.7 50.2 28.6 2031 107.8 28.0 79.7 50.8 28.9 2032 109.0 28.3 80.7 51.4 29.3 2033 110.2 28.7 81.6 52.0 29.6 2034 111.3 28.9 82.4 52.5 29.9 2035 112.3 29.2 83.1 53.0 30.2 2036 113.3 29.4 83.8 53.4 30.4 2037 114.1 29.7 84.4 53.8 30.6 2038 114.8 29.8 84.9 54.1 30.8 2039 115.4 30.0 85.4 54.4 31.0 2040 115.9 30.1 85.8 54.6 31.1 2041 116.3 30.2 86.1 54.8 31.3 2042 116.7 30.3 86.3 55.0 31.3 2043 116.9 30.4 86.5 55.1 31.4 Growth Rate
Period passengersNumber of Domestic internationalTotal International Transit
2012-2043 3.1 2.2 3.5 3.3 3.8
2012-2019 6.2 2.3 8.0 7.2 9.4
2019-2030 4.0 4.0 4.0 4.0 4.0
2030-2043 0.7 0.7 0.7 0.7 0.7
Source: Authors’ own computations * Actual values in 2012
Table 12 Revenue and Cost during 2019-2043 (million Euros) Scenario 1 Scenario 2 Year Total Operatin g Revenue Total Cost Net Profit/Los s Total Operatin g Revenue Total Cost Net Profit/Los s 201 9 2995.1 3771.2 -683.7 2569.5 3473.3 -749.9 202 0 3200.5 3915.0 -651.7 2685.7 3554.7 -731.8 202 1 3417.3 4066.8 -618.0 2805.0 3638.1 -713.2 202 2 3646.0 4226.9 -582.4 2927.2 3723.7 -694.2 202 3 3886.8 4395.5 -544.9 3052.4 3811.3 -674.8 202 4 4140.2 4572.8 -505.5 3180.2 3900.8 -654.9 202 5 4400.8 4755.2 -465.0 3306.5 3989.2 -635.2 202 6 4674.0 4946.5 -422.4 3435.0 4079.2 -615.2 202 7 4960.1 5146.7 -377.9 3565.6 4170.6 -594.9 202 8 5259.3 5356.2 -331.4 3698.0 4263.3 -574.3 202 9 5571.9 5575.0 -282.8 3832.1 4357.1 -553.4 203 0 5897.7 5803.0 -232.1 3967.5 4451.9 -532.4 203 1 6040.7 5274.2 766.5 4018.3 3858.5 159.8 203 2 6181.6 5372.8 808.8 4066.0 3891.9 174.1 203 3 6319.9 5469.6 850.3 4110.5 3923.1 187.5 203 4 6455.4 5564.4 890.9 4151.7 3951.9 199.8 203 5 6587.6 5657.0 930.6 4189.4 3978.3 211.1 203 6 6716.2 5747.0 969.2 4223.4 4002.1 221.3 203 7 6840.9 5834.3 1006.6 4253.7 4023.3 230.4 203 8 6961.7 5918.9 1042.8 4280.5 4042.0 238.5 203 9 7078.3 6000.5 1077.8 4303.5 4058.1 245.4 204 0 7190.5 6079.0 1111.5 4322.8 4071.7 251.2 204 1 7298.0 6154.3 1143.7 4338.4 4082.6 255.9 204 2 7401.0 6226.4 1174.6 4350.5 4091.0 259.5 204 3 7499.4 6295.3 1204.1 4359.0 4097.0 262.0 Tota l 140620.8 132124.4 7279.8 93992.6 99484.6 -4827.7 Source: Authors’ own computations