R E S E A R C H A R T I C L E
Open Access
Clinical and economic burden associated
with cardiovascular events among patients
with hyperlipidemia: a retrospective cohort
study
Kathleen M. Fox
1,6*, Li Wang
2, Shravanthi R. Gandra
3, Ruben G. W. Quek
3, Lu Li
2and Onur Baser
4,5Abstract
Background: Annual direct costs for cardiovascular (CV) diseases in the United States are approximately $195.6 billion, with many high-risk patients remaining at risk for major cardiovascular events (CVE). This study evaluated the direct clinical and economic burden associated with new CVE up to 3 years post-event among patients with hyperlipidemia.
Methods: Hyperlipidemic patients with a primary inpatient claim for new CVE (myocardial infarction, unstable angina, ischemic stroke, transient ischemic attack, coronary artery bypass graft, percutaneous coronary intervention and heart failure) were identified using IMS LifeLink PharMetrics Plus data from January 1, 2006 through June 30, 2012. Patients were stratified by CV risk into history of CVE, modified coronary heart disease risk equivalent, moderate- and low-risk cohorts. Of the eligible patients, propensity score matched 243,640 patients with or without new CVE were included to compare healthcare resource utilization and direct costs ranging from the acute (1-month) phase through 3 years post-CVE date (follow-up period).
Results: Myocardial infarction was the most common CVE in all the risk cohorts. During the acute phase, among patients with new CVE, the average incremental inpatient length of stay and incremental costs ranged from 4.4–6.2 days and $25,666–$30,321, respectively. Acute-phase incremental costs accounted for 61–75 % of first-year costs, but incremental costs also remained high during years 2 and 3 post-CVE.
Conclusions: Among hyperlipidemic patients with new CVE, healthcare utilization and costs incurred were significantly higher than for those without CVE during the acute phase, and remained higher up to 3 years post-event, across all risk cohorts.
Keywords: Hyperlipidemia, Cardiovascular events, Clinical burden, Economic burden Background
The global cost of cardiovascular disease (CVD) is esti-mated at $ 863 billion and is estiesti-mated to rise to $ 1,044 billion in 2030 [1]. The American Heart Association has estimated the direct costs for CVD in the United States at $195.6 billion, approximately 61 % of the total CVD-related healthcare costs [2]. Additionally, hyperlipidemia
was among the top 10 costliest medical conditions in 2008 in the US adult population [3]. Presence of hyper-lipidemia directly correlates with the risk of developing coronary heart disease (CHD) and future cardiovascular (CV) events [4]. Less than half of adults with elevated low density lipoprotein cholesterol (LDL-C) levels re-ceive treatment or are adequately treated [5, 6] and as a result, high-risk patients continue to remain at risk for new CV events. Almost 44 % of the US population is projected to be diagnosed with some form of CVD by 2030 [2]. These factors result in a substantial clinical * Correspondence:[email protected]
1Strategic Healthcare Solutions, LLC, Monkton, MD, USA
6Strategic Healthcare Solutions, LLC, 133 Cottonwood Creek Lane, Aiken, SC
29803, USA
Full list of author information is available at the end of the article
© 2016 Fox et al. Open Access This article is distributed under the terms of the Creative Commons Attribution 4.0 International License (http://creativecommons.org/licenses/by/4.0/), which permits unrestricted use, distribution, and reproduction in any medium, provided you give appropriate credit to the original author(s) and the source, provide a link to the Creative Commons license, and indicate if changes were made. The Creative Commons Public Domain Dedication waiver (http://creativecommons.org/publicdomain/zero/1.0/) applies to the data made available in this article, unless otherwise stated. Fox et al. BMC Cardiovascular Disorders (2016) 16:13
and economic burden in terms of direct healthcare utilization and costs.
While several studies have examined the economic bur-den of CV events [7–12], to our knowledge contemporary and long-term analyses concerning these event costs incurred by hyperlipidemic patients across a range of CVD risk levels is not available. Previous studies focused on short-term healthcare costs due to CV events [13–17] and investigated patient populations diagnosed with acute coronary syndrome [13, 14], hypertension [15], athero-sclerosis [16] or diabetes [17], but not hyperlipidemia. Furthermore, prior studies focused only on the initial CV event and therefore, limited data are available regarding re-current and subsequent CV event costs. Prior studies have investigated the economic burden of CV events over vari-ous time periods [10]; however, incremental costs among hyperlipidemic patients with and without CV events, and in particular, costs stratified by CVD risk level and associ-ated with myocardial infarction (MI), ischemic stroke (IS) unstable angina (UA), coronary artery bypass graft (CABG), percutaneous coronary intervention (PCI), heart failure (HF) and transient ischemic attack (TIA), all in one study, have not been previously examined. Therefore, the present study is one of the first to estimate the short-term and long-term (up to 3 years) direct clinical and economic bur-den of new CV events among hyperlipidemic patients at different CVD risk levels and by specific CV event type.
Methods Study design
We conducted a retrospective cohort study including patients with a hyperlipidemia diagnosis who had a new CV event matched to patients without new CV events, using the IMS LifeLink PharMetrics Plus dataset for the study period January 1, 2006 through June 30, 2012. This nationally-representative longitudinal database contains medical and pharmacy claims for over 50 million commercially-insured patients throughout the United States [7, 18, 19]. All claims data were from a limited data-set with de-identified patient information. No patients were directly involved in the study; therefore, this study was exempt from an Institutional Review Board review.
Study population
Patients (age ≥18) were included in the study if they had ≥1 medical claims for hyperlipidemia (International Classification of Diseases, 9th Revision Clinical Modifica-tions [ICD-9-CM] code 272) [20] from January 1, 2006 through June 30, 2009. The first diagnosis claim date was designated as the hyperlipidemia diagnosis date. As detailed in Appendix 1, patients were required to have at least one inpatient medical claim for a new CV event (MI, IS, UA, TIA, HF, CABG and PCI) after the hyperlipidemia diagnosis date and during the identification period
(January 1, 2007 through June 30, 2009). For hyperlip-idemic patients with a new CV event, the earliest inpatient claim date was designated as the index date. If a patient had more than one inpatient claim for a new CV event on the index date, only one CV event was selected, according to the following hierarchy: MI, IS, UA, HF, TIA, CABG and then PCI, based on the clinical importance (e.g. acute/urgency) of CV events and CV-related procedures. The comparison group included patients with no new CV event after the hyperlipidemia diagnosis and through the end of the study period (June 30, 2012). Baseline period of the 12 months prior to the index date was utilized to characterize patients’ CV risk level (e.g. history of CVE or diabetes) and comorbidity status. Patients were followed from the index date through 3 years post-index date to estimate short-term (first 30 days and 1 year) and longer-term (2 years and 3 years) direct costs.
Matching was completed in a two-step approach. The first step was 1:1 match (age, gender, US region) to assign an index date for patients without a new CV event and de-fine the baseline period for quantifying baseline characteris-tics (CV risk level, comorbidities). These initially matched patients with no new CV event were then assigned the same index date as that of their matched patients who had a new CV event. This assignment of index date to patients with no new CV event provided the same baseline and follow-up time periods for the comparison of outcomes be-tween patients with and without new CV events.
The second step of matching, propensity score matching (PSM) with 0.01 calipers, was applied to control the differences in baseline clinical and demographic factors between patients with and without new CV events within each risk cohort [21, 22]. A standardized difference (STD) of >10 % was used to assess significant practical differ-ences in the case–control comparison [23]. The baseline variables adjusted in the model were age group, gender, US region, Charlson comorbidity index (CCI) score, Chronic Disease Score (CDS), individual comorbid condi-tions (hypertension, arrhythmias, metabolic syndrome, liver disease, obesity, and chronic kidney disease) and number of inpatient admissions per patient per month (PPPM). The methods used in this study have also been published in prior literature [7, 10]. The CCI score is based on ICD-9 codes and CDS uses pharmacy dispensation in-formation for specific drug classes to estimate the burden of comorbidities [24]. The CCI and CDS score have been widely used in many retrospective studies [25–28].
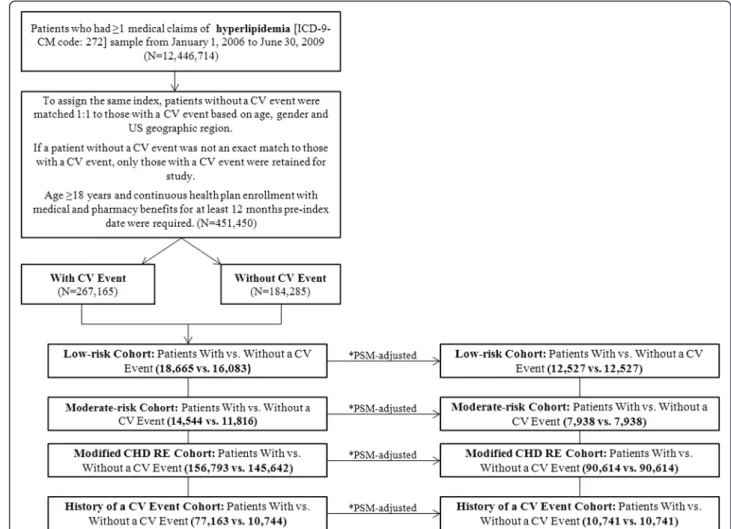
Based on the risk level during the 12-month pre-index (baseline period), the study sample was subdivided into the following CVD risk cohorts: history of CV event, modified CHD risk equivalent (RE), moderate risk and low risk (Fig. 1). Risk levels were defined based on the National Cholesterol Education Program (NCEP) Adult Treatment Panel (ATP) III guidelines [29] (Appendix 2).
The history of CV event cohort included patients with MI, UA, CABG, PCI or IS, the modified CHD RE cohort included patients with peripheral arterial disease, abdom-inal aortic aneurysm, coronary artery disease, diabetes or dyslipidemia. Patients with at least two of the following three risk factors a) hypertension and/or pharmacy claim for blood pressure-lowering medication, b) aged ≥45 for men and aged ≥55 for women, c) pre-index high-density lipoprotein cholesterol <40 mg/dl were included in the moderate risk cohort, and patients with zero or one risk factor were included in the low risk cohort [see Appendix 2 for detailed ICD-9-CM codes]. Outcome measures in-cluded distribution of CV event type, healthcare utilization, and direct incremental costs (obtained from claims) in-curred during the acute (first 1 month post-index date), and long-term (1, 2, 3 years post-index date) follow-up pe-riods for hyperlipidemia patients, stratified by CVD risk level. Healthcare utilization included inpatient, outpatient, outpatient office, emergency room and pharmacy visits and direct costs associated with healthcare utilization were
computed from health plan- and patient-paid amounts. Total costs included inpatient, outpatient and pharmacy costs. Costs were adjusted to 2012 US dollars using the an-nual medical care component of the consumer price index (CPI) to reflect inflation.
Statistical analysis Descriptive analysis
Descriptive analysis was conducted to compare demographic and clinical characteristics between patients with and with-out a new CV event within each risk cohort. The direct total incremental costs were calculated as the difference in total costs for patients with a new CV event and total costs for patients without a CV event. Negative incremental costs indicate that the total costs were lower for patients with new CV events than for patients without new CV events.
Multivariate analysis
The differences in economic outcomes for each risk cohort were compared among PSM cases and controls. Patients
Fig. 1 Patient Selection Flowchart. *Propensity score matching was applied for each cardiovascular disease risk cohort using covariates: age group, gender, US region, baseline Charlson comorbidity index score, Chronic Disease Score, comorbidities and number of inpatient admissions per patient per month. CV: cardiovascular; CHD RE: coronary heart disease risk equivalent; PSM: propensity score matching
without new CV events were designated as the reference group (controls). All analyses were performed using SAS® version 9.3 (SAS® Institute Inc., Cary, NC).
Results
Among patients with a new CV event, a large propor-tion had two or more new CV events (65.8 %) during the 3-year follow-up period. Second and subsequent CV events during follow-up were often the same event type as the first event. A total of 451,450 patients were eligible for the study, among which 267,165 patients had a new CV event, and 184,285 patients had no new CV event before 1:1 matching. A total of 184,285 hyperlipidemic patients with new CV events from January 1, 2006 through June 30, 2009 were matched according to age, gender and US region to 184,285 hyperlipidemic patients without a new CV event (Fig. 1).
Baseline demographic and clinical characteristics
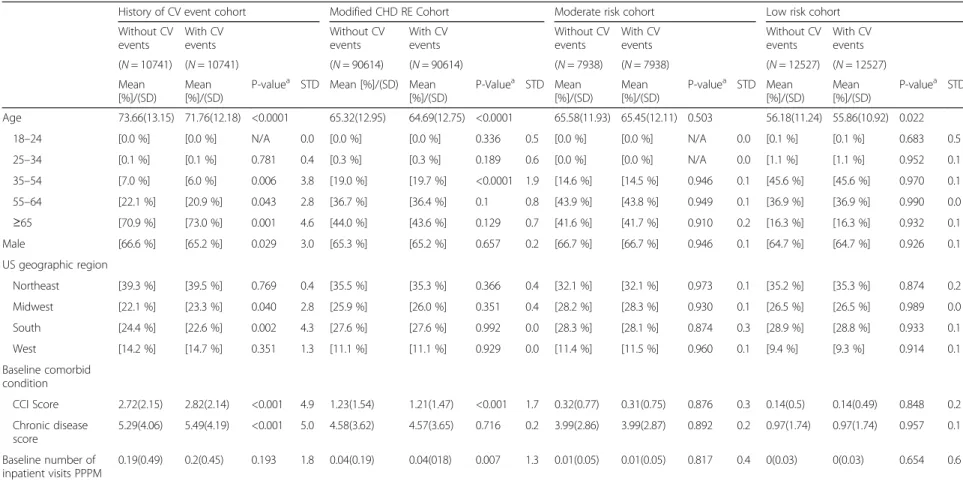
Baseline demographic and characteristics of un-matched patients with a new CV event (N = 267,165) and patients without a new CV event (N = 184,285) are provided in Appendix 3. Baseline demographic and clinical characteristics for propensity score-matched patients with a new CV event (N = 121,820) and patients without a new CV event (N = 121,820), stratified by CVD risk level, are provided in Table 1. Patients without CV events were well-matched with patients with new CV event within each risk cohort, since the STD was <10 % for all variables included in the PSM. The majority of patients were classified in the modified CHD RE cohort (74.4 %), followed by the history of CV event cohort (8.8 %). Overall, the average age of patients with a new CV event (N = 121,820) ranged from 56 to 72 years; 65–67 % were male; and hypertension was the most common baseline comor-bidity (4.7–84.4 %).
Clinical burden
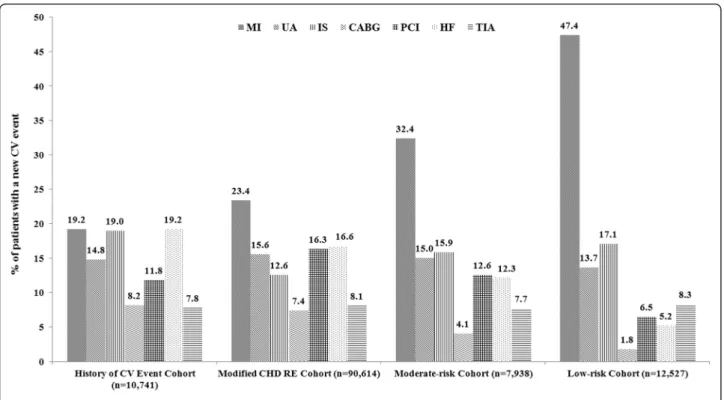
MI was more commonly diagnosed than other CV event types among patients in the low-risk, moderate-risk and modified CHD RE cohorts. Frequency of MI, IS and HF was similar among patients in the history of CV event cohort (Fig. 2).
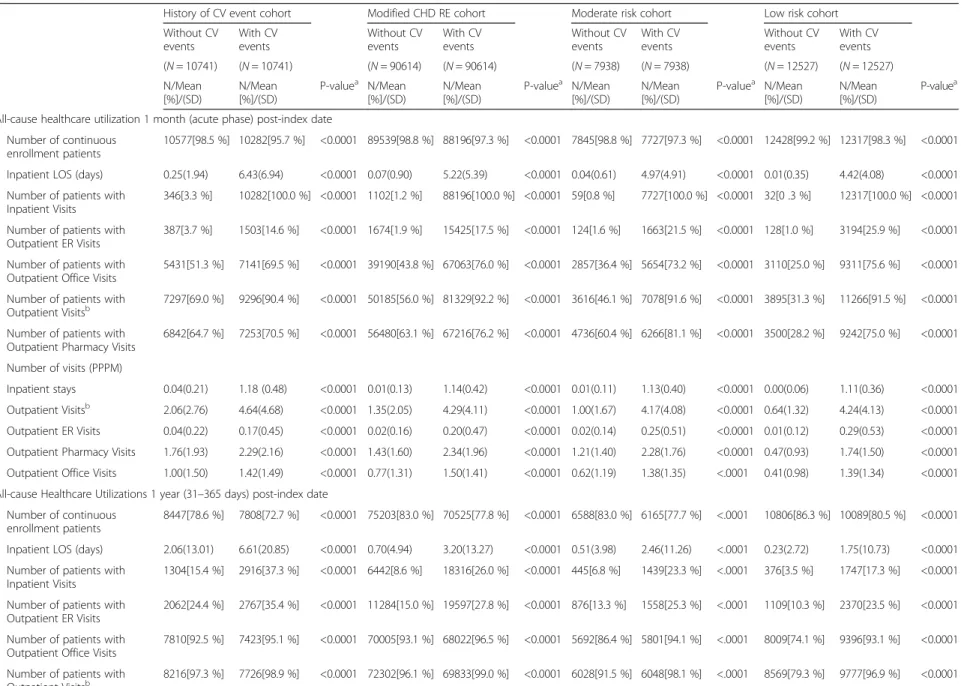
During the 1 month post-index date, among patients with history of a CV event (n = 10,741), the mean inpatient length of stay (LOS) was significantly longer among hyperlipidemic patients with a new CV event compared to those without (6.4 vs. 0.25 days, p < 0.0001, Table 2). This trend was observed across all risk cohorts. The inpatient LOS remained longer during the short-and long-term follow-up periods among patients with a new CV event, compared to those without, for all risk
cohorts (e.g. history of CV event cohort inpatient LOS in year 2 = 4.14 vs. 1.50 days, p < 0.0001, and in year 3 = 3.72 vs. 1.38 days, p < 0.0001) (Table 3).
During the 1 month post-index date, patients with history of a CV event (n = 10,741) had significantly more outpatient emergency room (ER) visits PPPM compared to patients without a new CV event (0.17 vs. 0.04 visits, p < 0.0001, Table 2). This trend contin-ued across all risk cohorts and during all follow-up periods (Tables 2 & 3). Among hyperlipidemic pa-tients with new CV events, all resource utilization components were highest during the 1-month post-index follow-up phase for all risk cohorts, indicating that the highest healthcare utilization occurred during the first month post-CV event. However, healthcare resource utilization during years 2 and 3 of the follow-up period remained significantly higher for patients with a new CV event than for those without, across all risk cohorts (e.g. history of CV event cohort ER visits PPPM during year 2 =0.05 vs. 0.03 visits, p < 0.0001; and year 3 = 0.05 vs. 0.03 visits, p < 0.0001).
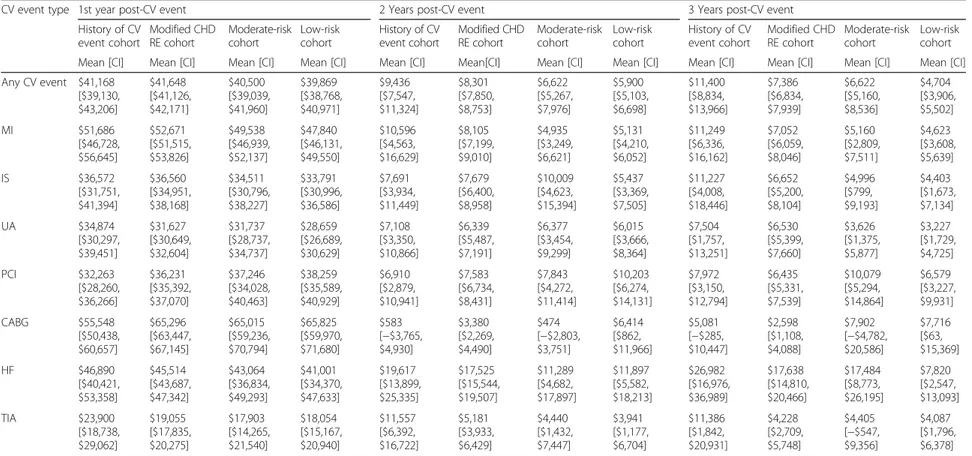
Economic burden
Across all CV event type and risk cohorts, the direct incremental costs ranged from $17,903 to $65,825 in the first year of follow-up period, $474 to $19,617 during the second year post-CV event and $2,598 to $26,982 during the third year post-CV event (Table 4).
Direct incremental costs categorized by CV event type varied in relation to the duration of the follow-up period. The direct incremental costs accrued during the 1-month post-index phase represented approximately 45-90 % of first-year costs (data not shown). During the first year post-CV event, CABG costs were highest ($55,548–$65,825) for all risk cohorts, followed by MI ($47,840–$51,686) and HF ($41,001–$46,890). During years 2 and 3 post-index date, patients diagnosed with HF incurred the highest cost burden (year 2: $11,289–$19,617; year 3: $7,820–$26,982) among all risk cohorts. The direct incremental costs during these years were mainly driven by heart failure. For all CV event types, first-year incremental costs were higher compared to those accrued in the second and third post-CV event years; second- and third-year costs were always higher for hyperlipidemic patients with new CV events than for their matched patients without CV events.
Discussion
Our study showed that the long-term clinical and economic burden associated with CV events among hyperlipidemic patients was substantial across all risk cohorts, but especially among high-risk cohorts (i.e. patients with history of a CV event and prior CHD RE diagnosis). Our mean healthcare resource
Table 1 PSM-adjusted 12-month pre-index demographic and clinical characteristics for hyperlipidemic patients with and without new CV events
History of CV event cohort Modified CHD RE Cohort Moderate risk cohort Low risk cohort Without CV events With CV events Without CV events With CV events Without CV events With CV events Without CV events With CV events (N = 10741) (N = 10741) (N = 90614) (N = 90614) (N = 7938) (N = 7938) (N = 12527) (N = 12527) Mean [%]/(SD) Mean [%]/(SD)
P-valuea STD Mean [%]/(SD) Mean [%]/(SD) P-Valuea STD Mean [%]/(SD) Mean [%]/(SD) P-valuea STD Mean [%]/(SD) Mean [%]/(SD) P-valuea STD Age 73.66(13.15) 71.76(12.18) <0.0001 65.32(12.95) 64.69(12.75) <0.0001 65.58(11.93) 65.45(12.11) 0.503 56.18(11.24) 55.86(10.92) 0.022 18–24 [0.0 %] [0.0 %] N/A 0.0 [0.0 %] [0.0 %] 0.336 0.5 [0.0 %] [0.0 %] N/A 0.0 [0.1 %] [0.1 %] 0.683 0.5 25–34 [0.1 %] [0.1 %] 0.781 0.4 [0.3 %] [0.3 %] 0.189 0.6 [0.0 %] [0.0 %] N/A 0.0 [1.1 %] [1.1 %] 0.952 0.1 35–54 [7.0 %] [6.0 %] 0.006 3.8 [19.0 %] [19.7 %] <0.0001 1.9 [14.6 %] [14.5 %] 0.946 0.1 [45.6 %] [45.6 %] 0.970 0.1 55–64 [22.1 %] [20.9 %] 0.043 2.8 [36.7 %] [36.4 %] 0.1 0.8 [43.9 %] [43.8 %] 0.949 0.1 [36.9 %] [36.9 %] 0.990 0.0 ≥65 [70.9 %] [73.0 %] 0.001 4.6 [44.0 %] [43.6 %] 0.129 0.7 [41.6 %] [41.7 %] 0.910 0.2 [16.3 %] [16.3 %] 0.932 0.1 Male [66.6 %] [65.2 %] 0.029 3.0 [65.3 %] [65.2 %] 0.657 0.2 [66.7 %] [66.7 %] 0.946 0.1 [64.7 %] [64.7 %] 0.926 0.1 US geographic region Northeast [39.3 %] [39.5 %] 0.769 0.4 [35.5 %] [35.3 %] 0.366 0.4 [32.1 %] [32.1 %] 0.973 0.1 [35.2 %] [35.3 %] 0.874 0.2 Midwest [22.1 %] [23.3 %] 0.040 2.8 [25.9 %] [26.0 %] 0.351 0.4 [28.2 %] [28.3 %] 0.930 0.1 [26.5 %] [26.5 %] 0.989 0.0 South [24.4 %] [22.6 %] 0.002 4.3 [27.6 %] [27.6 %] 0.992 0.0 [28.3 %] [28.1 %] 0.874 0.3 [28.9 %] [28.8 %] 0.933 0.1 West [14.2 %] [14.7 %] 0.351 1.3 [11.1 %] [11.1 %] 0.929 0.0 [11.4 %] [11.5 %] 0.960 0.1 [9.4 %] [9.3 %] 0.914 0.1 Baseline comorbid condition CCI Score 2.72(2.15) 2.82(2.14) <0.001 4.9 1.23(1.54) 1.21(1.47) <0.001 1.7 0.32(0.77) 0.31(0.75) 0.876 0.3 0.14(0.5) 0.14(0.49) 0.848 0.2 Chronic disease score 5.29(4.06) 5.49(4.19) <0.001 5.0 4.58(3.62) 4.57(3.65) 0.716 0.2 3.99(2.86) 3.99(2.87) 0.892 0.2 0.97(1.74) 0.97(1.74) 0.957 0.1 Baseline number of inpatient visits PPPM 0.19(0.49) 0.2(0.45) 0.193 1.8 0.04(0.19) 0.04(018) 0.007 1.3 0.01(0.05) 0.01(0.05) 0.817 0.4 0(0.03) 0(0.03) 0.654 0.6
Propensity score matching was applied for each cardiovascular disease risk cohort using covariates: age group, gender, US region, baseline Charlson comorbidity index score, Chronic Disease Score, comorbidities (hypertension, arrhythmias, metabolic syndrome, liver disease, obesity and chronic kidney disease) and number of inpatient admissions per patient per month.
CHD RE coronary heart disease risk equivalent, SD standard deviation, STD standardized difference, CV cardiovascular, CVD cardiovascular disease, PPPM per patient per month, PSM propensity score matching
a
Chi-square tests were used to evaluate the statistical significance of differences in categorical variables; student t-tests were used for the continuous variables
Fox et al. BMC Cardiova scular Disorders (2016) 16:13 Page 5 of 15
utilization analysis demonstrated that during the acute follow-up period, hyperlipidemic patients with new CV events had an additional +4.4 to +6.2 (days) inpatient LOS and +2.6 to +3.6 outpatient visits PPPM, compared to patients without CV events. The clinical burden remained over the long-term, and was substantial for patients with a new CV event (year 2 incremental inpatient LOS: +0.5 to +2.6, out-patient visits PPPM: +0.2 to +0.3; year 3 incremental inpatient LOS: +0.4 to +2.3, outpatient visits PPPM: +0.1 to +0.3). The pattern of long term healthcare resource utilization among patients with new CV events may be attributable to the higher long term HF costs. Our study also reported that a large pro-portion (65.8 %) of patients with a new CV event had more than one new CV event during the follow-up period, adding to the long-term clinical burden of CV events on hyperlipidemic patients. These are only the direct medical costs of care; total costs would be larger if other indirect costs associated with CVE were accounted for. A prior study did show that new CVE were associated with increased indirect costs [30].
Previous studies have reported that inpatient hos-pital stays and ER visits are expensive, resource inten-sive and impose a great clinical burden on patients
[31, 32]. Higher healthcare resource utilization is a major component of increased healthcare costs. Healthcare costs were higher among hyperlipidemic patients with a new CV event in the acute phase, compared to patients without a new CV event. Our re-sults are similar to the Chapman et al. study, which con-cluded that patients with new CV events incurred the highest follow-up costs during the acute phase, and acute phase costs were much higher than those in years 2 and 3 [7]. However, our study also determined that incremental costs remained higher through 3 years of follow-up (year 1: $39,869 to $41,648 higher; year 2: $5,900 to $ 9,436 higher; year 3: $4,704 to $11,400 higher), for all risk co-horts of hyperlipidemic patients with a new CV event, compared to those without, emphasizing a sustained economic burden. Compared with the Chapman et al. [7] study with cost estimates from 2001–2006, the present study also provides more recent estimates for healthcare resource utilization and costs across the CVD risk spectrum (history of CV events through low risk) rather than excluding the highest risk cohort (i.e. patients with a history of CV events) as in the Chap-man et al. study. Our study also captures the cost of care for multiple CV events thereby providing a more accurate estimate of the direct cost of care for patients experiencing new CV events rather than estimating the cost for each
Fig. 2 PSM-adjusted Distribution of Index CV Event According to CVD Risk Level. CV: cardiovascular; CVD: cardiovascular disease; PSM: propensity score matching; MI: myocardial infarction; UA: unstable angina; IS: ischemic stroke; CABG: coronary artery bypass graft; PCI: percutaneous coronary intervention; HF: heart failure; TIA: transient ischemic attack; CHD RE: coronary heart disease risk equivalent
Table 2 PSM-adjusted follow-up (short and long-term) healthcare utilization for hyperlipidemic patients with and without new CV events, categorized by CVD risk level History of CV event cohort Modified CHD RE cohort Moderate risk cohort Low risk cohort
Without CV events With CV events Without CV events With CV events Without CV events With CV events Without CV events With CV events (N = 10741) (N = 10741) (N = 90614) (N = 90614) (N = 7938) (N = 7938) (N = 12527) (N = 12527) N/Mean [%]/(SD) N/Mean [%]/(SD) P-valuea N/Mean [%]/(SD) N/Mean [%]/(SD) P-valuea N/Mean [%]/(SD) N/Mean [%]/(SD) P-valuea N/Mean [%]/(SD) N/Mean [%]/(SD) P-valuea
All-cause healthcare utilization 1 month (acute phase) post-index date Number of continuous
enrollment patients
10577[98.5 %] 10282[95.7 %] <0.0001 89539[98.8 %] 88196[97.3 %] <0.0001 7845[98.8 %] 7727[97.3 %] <0.0001 12428[99.2 %] 12317[98.3 %] <0.0001 Inpatient LOS (days) 0.25(1.94) 6.43(6.94) <0.0001 0.07(0.90) 5.22(5.39) <0.0001 0.04(0.61) 4.97(4.91) <0.0001 0.01(0.35) 4.42(4.08) <0.0001 Number of patients with
Inpatient Visits
346[3.3 %] 10282[100.0 %] <0.0001 1102[1.2 %] 88196[100.0 %] <0.0001 59[0.8 %] 7727[100.0 %] <0.0001 32[0 .3 %] 12317[100.0 %] <0.0001 Number of patients with
Outpatient ER Visits
387[3.7 %] 1503[14.6 %] <0.0001 1674[1.9 %] 15425[17.5 %] <0.0001 124[1.6 %] 1663[21.5 %] <0.0001 128[1.0 %] 3194[25.9 %] <0.0001 Number of patients with
Outpatient Office Visits
5431[51.3 %] 7141[69.5 %] <0.0001 39190[43.8 %] 67063[76.0 %] <0.0001 2857[36.4 %] 5654[73.2 %] <0.0001 3110[25.0 %] 9311[75.6 %] <0.0001 Number of patients with
Outpatient Visitsb 7297[69.0 %] 9296[90.4 %] <0.0001 50185[56.0 %] 81329[92.2 %] <0.0001 3616[46.1 %] 7078[91.6 %] <0.0001 3895[31.3 %] 11266[91.5 %] <0.0001
Number of patients with Outpatient Pharmacy Visits
6842[64.7 %] 7253[70.5 %] <0.0001 56480[63.1 %] 67216[76.2 %] <0.0001 4736[60.4 %] 6266[81.1 %] <0.0001 3500[28.2 %] 9242[75.0 %] <0.0001 Number of visits (PPPM)
Inpatient stays 0.04(0.21) 1.18 (0.48) <0.0001 0.01(0.13) 1.14(0.42) <0.0001 0.01(0.11) 1.13(0.40) <0.0001 0.00(0.06) 1.11(0.36) <0.0001 Outpatient Visitsb 2.06(2.76) 4.64(4.68) <0.0001 1.35(2.05) 4.29(4.11) <0.0001 1.00(1.67) 4.17(4.08) <0.0001 0.64(1.32) 4.24(4.13) <0.0001 Outpatient ER Visits 0.04(0.22) 0.17(0.45) <0.0001 0.02(0.16) 0.20(0.47) <0.0001 0.02(0.14) 0.25(0.51) <0.0001 0.01(0.12) 0.29(0.53) <0.0001 Outpatient Pharmacy Visits 1.76(1.93) 2.29(2.16) <0.0001 1.43(1.60) 2.34(1.96) <0.0001 1.21(1.40) 2.28(1.76) <0.0001 0.47(0.93) 1.74(1.50) <0.0001 Outpatient Office Visits 1.00(1.50) 1.42(1.49) <0.0001 0.77(1.31) 1.50(1.41) <0.0001 0.62(1.19) 1.38(1.35) <.0001 0.41(0.98) 1.39(1.34) <0.0001 All-cause Healthcare Utilizations 1 year (31–365 days) post-index date
Number of continuous enrollment patients
8447[78.6 %] 7808[72.7 %] <0.0001 75203[83.0 %] 70525[77.8 %] <0.0001 6588[83.0 %] 6165[77.7 %] <.0001 10806[86.3 %] 10089[80.5 %] <0.0001 Inpatient LOS (days) 2.06(13.01) 6.61(20.85) <0.0001 0.70(4.94) 3.20(13.27) <0.0001 0.51(3.98) 2.46(11.26) <.0001 0.23(2.72) 1.75(10.73) <0.0001 Number of patients with
Inpatient Visits
1304[15.4 %] 2916[37.3 %] <0.0001 6442[8.6 %] 18316[26.0 %] <0.0001 445[6.8 %] 1439[23.3 %] <.0001 376[3.5 %] 1747[17.3 %] <0.0001 Number of patients with
Outpatient ER Visits
2062[24.4 %] 2767[35.4 %] <0.0001 11284[15.0 %] 19597[27.8 %] <0.0001 876[13.3 %] 1558[25.3 %] <.0001 1109[10.3 %] 2370[23.5 %] <0.0001 Number of patients with
Outpatient Office Visits
7810[92.5 %] 7423[95.1 %] <0.0001 70005[93.1 %] 68022[96.5 %] <0.0001 5692[86.4 %] 5801[94.1 %] <.0001 8009[74.1 %] 9396[93.1 %] <0.0001 Number of patients with
Outpatient Visitsb 8216[97.3 %] 7726[98.9 %] <0.0001 72302[96.1 %] 69833[99.0 %] <0.0001 6028[91.5 %] 6048[98.1 %] <.0001 8569[79.3 %] 9777[96.9 %] <0.0001 Fox et al. BMC Cardiova scular Disorders (2016) 16:13 Page 7 of 15
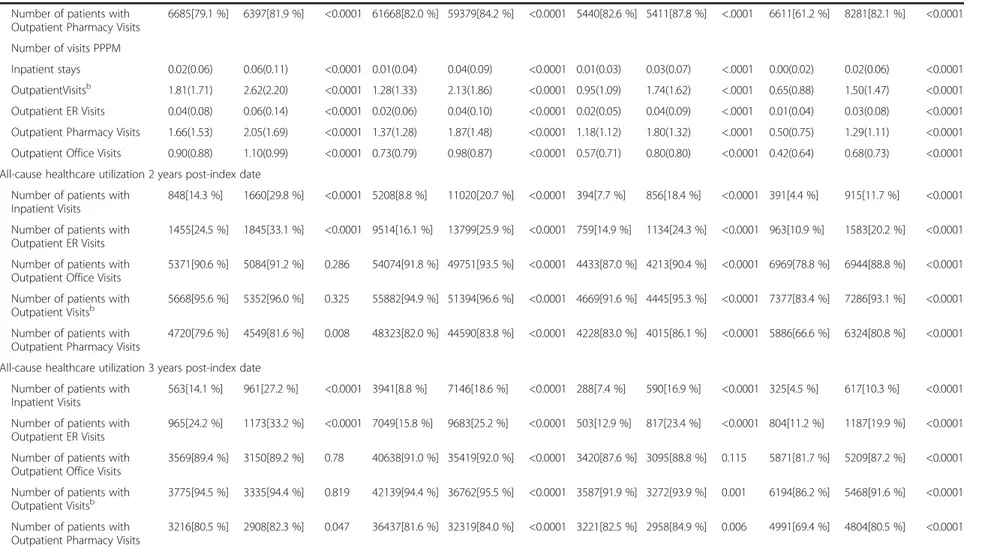
Table 2 PSM-adjusted follow-up (short and long-term) healthcare utilization for hyperlipidemic patients with and without new CV events, categorized by CVD risk level (Continued)
Number of patients with Outpatient Pharmacy Visits
6685[79.1 %] 6397[81.9 %] <0.0001 61668[82.0 %] 59379[84.2 %] <0.0001 5440[82.6 %] 5411[87.8 %] <.0001 6611[61.2 %] 8281[82.1 %] <0.0001 Number of visits PPPM
Inpatient stays 0.02(0.06) 0.06(0.11) <0.0001 0.01(0.04) 0.04(0.09) <0.0001 0.01(0.03) 0.03(0.07) <.0001 0.00(0.02) 0.02(0.06) <0.0001 OutpatientVisitsb 1.81(1.71) 2.62(2.20) <0.0001 1.28(1.33) 2.13(1.86) <0.0001 0.95(1.09) 1.74(1.62) <.0001 0.65(0.88) 1.50(1.47) <0.0001
Outpatient ER Visits 0.04(0.08) 0.06(0.14) <0.0001 0.02(0.06) 0.04(0.10) <0.0001 0.02(0.05) 0.04(0.09) <.0001 0.01(0.04) 0.03(0.08) <0.0001 Outpatient Pharmacy Visits 1.66(1.53) 2.05(1.69) <0.0001 1.37(1.28) 1.87(1.48) <0.0001 1.18(1.12) 1.80(1.32) <.0001 0.50(0.75) 1.29(1.11) <0.0001 Outpatient Office Visits 0.90(0.88) 1.10(0.99) <0.0001 0.73(0.79) 0.98(0.87) <0.0001 0.57(0.71) 0.80(0.80) <0.0001 0.42(0.64) 0.68(0.73) <0.0001 All-cause healthcare utilization 2 years post-index date
Number of patients with Inpatient Visits
848[14.3 %] 1660[29.8 %] <0.0001 5208[8.8 %] 11020[20.7 %] <0.0001 394[7.7 %] 856[18.4 %] <0.0001 391[4.4 %] 915[11.7 %] <0.0001 Number of patients with
Outpatient ER Visits
1455[24.5 %] 1845[33.1 %] <0.0001 9514[16.1 %] 13799[25.9 %] <0.0001 759[14.9 %] 1134[24.3 %] <0.0001 963[10.9 %] 1583[20.2 %] <0.0001 Number of patients with
Outpatient Office Visits
5371[90.6 %] 5084[91.2 %] 0.286 54074[91.8 %] 49751[93.5 %] <0.0001 4433[87.0 %] 4213[90.4 %] <0.0001 6969[78.8 %] 6944[88.8 %] <0.0001 Number of patients with
Outpatient Visitsb 5668[95.6 %] 5352[96.0 %] 0.325 55882[94.9 %] 51394[96.6 %] <0.0001 4669[91.6 %] 4445[95.3 %] <0.0001 7377[83.4 %] 7286[93.1 %] <0.0001
Number of patients with Outpatient Pharmacy Visits
4720[79.6 %] 4549[81.6 %] 0.008 48323[82.0 %] 44590[83.8 %] <0.0001 4228[83.0 %] 4015[86.1 %] <0.0001 5886[66.6 %] 6324[80.8 %] <0.0001 All-cause healthcare utilization 3 years post-index date
Number of patients with Inpatient Visits
563[14.1 %] 961[27.2 %] <0.0001 3941[8.8 %] 7146[18.6 %] <0.0001 288[7.4 %] 590[16.9 %] <0.0001 325[4.5 %] 617[10.3 %] <0.0001 Number of patients with
Outpatient ER Visits
965[24.2 %] 1173[33.2 %] <0.0001 7049[15.8 %] 9683[25.2 %] <0.0001 503[12.9 %] 817[23.4 %] <0.0001 804[11.2 %] 1187[19.9 %] <0.0001 Number of patients with
Outpatient Office Visits
3569[89.4 %] 3150[89.2 %] 0.78 40638[91.0 %] 35419[92.0 %] <0.0001 3420[87.6 %] 3095[88.8 %] 0.115 5871[81.7 %] 5209[87.2 %] <0.0001 Number of patients with
Outpatient Visitsb
3775[94.5 %] 3335[94.4 %] 0.819 42139[94.4 %] 36762[95.5 %] <0.0001 3587[91.9 %] 3272[93.9 %] 0.001 6194[86.2 %] 5468[91.6 %] <0.0001 Number of patients with
Outpatient Pharmacy Visits
3216[80.5 %] 2908[82.3 %] 0.047 36437[81.6 %] 32319[84.0 %] <0.0001 3221[82.5 %] 2958[84.9 %] 0.006 4991[69.4 %] 4804[80.5 %] <0.0001
Refer to Table3for length of stay and number of visits per patient per month during years 2 and 3 of the follow-up period
PSM propensity score matching, CVD cardiovascular disease, CV cardiovascular, CHD RE coronary heart disease risk equivalent, SD standard deviation, LOS length of stay, PPPM per patient per month, ER emergency room
a
Chi-square tests were used to evaluate the statistical significance of differences in categorical variables; student t-tests were used for the continuous variables
b
Outpatient visits included emergency room, laboratory/pathology, radiology, outpatient surgical or diagnostic procedure and office visits
Fox et al. BMC Cardiova scular Disorders (2016) 16:13 Page 8 of 15
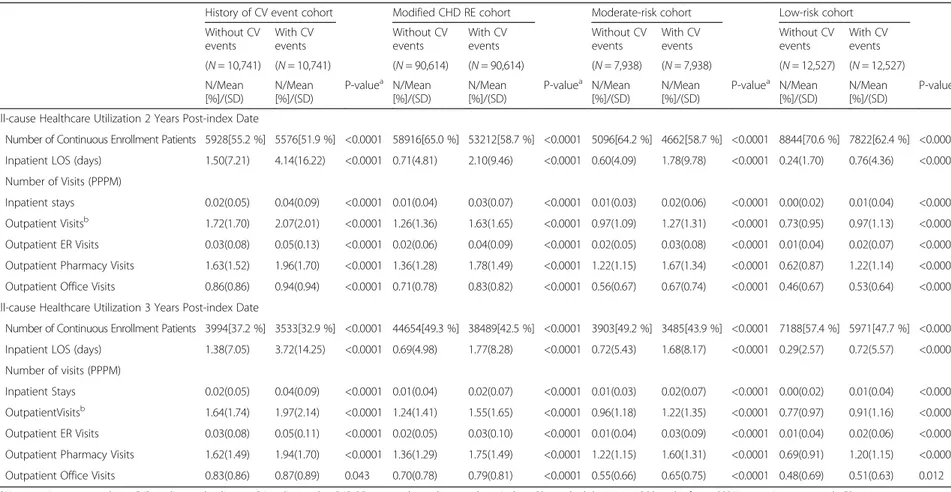
Table 3 PSM-adjusted follow-up (2 years and 3 years) healthcare utilization for hyperlipidemic patients with and without new CV events, categorized by CVD risk level History of CV event cohort Modified CHD RE cohort Moderate-risk cohort Low-risk cohort Without CV events With CV events Without CV events With CV events Without CV events With CV events Without CV events With CV events (N = 10,741) (N = 10,741) (N = 90,614) (N = 90,614) (N = 7,938) (N = 7,938) (N = 12,527) (N = 12,527) N/Mean [%]/(SD) N/Mean [%]/(SD) P-valuea N/Mean [%]/(SD) N/Mean [%]/(SD) P-valuea N/Mean [%]/(SD) N/Mean [%]/(SD) P-valuea N/Mean [%]/(SD) N/Mean [%]/(SD) P-valuea
All-cause Healthcare Utilization 2 Years Post-index Date
Number of Continuous Enrollment Patients 5928[55.2 %] 5576[51.9 %] <0.0001 58916[65.0 %] 53212[58.7 %] <0.0001 5096[64.2 %] 4662[58.7 %] <0.0001 8844[70.6 %] 7822[62.4 %] <0.0001 Inpatient LOS (days) 1.50(7.21) 4.14(16.22) <0.0001 0.71(4.81) 2.10(9.46) <0.0001 0.60(4.09) 1.78(9.78) <0.0001 0.24(1.70) 0.76(4.36) <0.0001 Number of Visits (PPPM)
Inpatient stays 0.02(0.05) 0.04(0.09) <0.0001 0.01(0.04) 0.03(0.07) <0.0001 0.01(0.03) 0.02(0.06) <0.0001 0.00(0.02) 0.01(0.04) <0.0001 Outpatient Visitsb 1.72(1.70) 2.07(2.01) <0.0001 1.26(1.36) 1.63(1.65) <0.0001 0.97(1.09) 1.27(1.31) <0.0001 0.73(0.95) 0.97(1.13) <0.0001 Outpatient ER Visits 0.03(0.08) 0.05(0.13) <0.0001 0.02(0.06) 0.04(0.09) <0.0001 0.02(0.05) 0.03(0.08) <0.0001 0.01(0.04) 0.02(0.07) <0.0001 Outpatient Pharmacy Visits 1.63(1.52) 1.96(1.70) <0.0001 1.36(1.28) 1.78(1.49) <0.0001 1.22(1.15) 1.67(1.34) <0.0001 0.62(0.87) 1.22(1.14) <0.0001 Outpatient Office Visits 0.86(0.86) 0.94(0.94) <0.0001 0.71(0.78) 0.83(0.82) <0.0001 0.56(0.67) 0.67(0.74) <0.0001 0.46(0.67) 0.53(0.64) <0.0001 All-cause Healthcare Utilization 3 Years Post-index Date
Number of Continuous Enrollment Patients 3994[37.2 %] 3533[32.9 %] <0.0001 44654[49.3 %] 38489[42.5 %] <0.0001 3903[49.2 %] 3485[43.9 %] <0.0001 7188[57.4 %] 5971[47.7 %] <0.0001 Inpatient LOS (days) 1.38(7.05) 3.72(14.25) <0.0001 0.69(4.98) 1.77(8.28) <0.0001 0.72(5.43) 1.68(8.17) <0.0001 0.29(2.57) 0.72(5.57) <0.0001 Number of visits (PPPM)
Inpatient Stays 0.02(0.05) 0.04(0.09) <0.0001 0.01(0.04) 0.02(0.07) <0.0001 0.01(0.03) 0.02(0.07) <0.0001 0.00(0.02) 0.01(0.04) <0.0001 OutpatientVisitsb 1.64(1.74) 1.97(2.14) <0.0001 1.24(1.41) 1.55(1.65) <0.0001 0.96(1.18) 1.22(1.35) <0.0001 0.77(0.97) 0.91(1.16) <0.0001
Outpatient ER Visits 0.03(0.08) 0.05(0.11) <0.0001 0.02(0.05) 0.03(0.10) <0.0001 0.01(0.04) 0.03(0.09) <0.0001 0.01(0.04) 0.02(0.06) <0.0001 Outpatient Pharmacy Visits 1.62(1.49) 1.94(1.70) <0.0001 1.36(1.29) 1.75(1.49) <0.0001 1.22(1.15) 1.60(1.31) <0.0001 0.69(0.91) 1.20(1.15) <0.0001 Outpatient Office Visits 0.83(0.86) 0.87(0.89) 0.043 0.70(0.78) 0.79(0.81) <0.0001 0.55(0.66) 0.65(0.75) <0.0001 0.48(0.69) 0.51(0.63) 0.012
PSM propensity score matching, CVD cardiovascular disease, CV cardiovascular, CHD RE coronary heart disease risk equivalent, SD standard deviation, LOS length of stay, PPPM per patient per month, ER emergency room
a
Chi-square tests were used to evaluate the statistical significance of differences in categorical variables; student t-tests were used for the continuous variables
b
Outpatient visits included emergency room, laboratory/pathology, radiology, outpatient surgical or diagnostic procedure and office visits
Fox et al. BMC Cardiova scular Disorders (2016) 16:13 Page 9 of 15
Table 4 Total annual incremental costs for hyperlipidemic patients with new CV events categorized by post-event periods
CV event type 1st year post-CV event 2 Years post-CV event 3 Years post-CV event
History of CV event cohort Modified CHD RE cohort Moderate-risk cohort Low-risk cohort History of CV event cohort Modified CHD RE cohort Moderate-risk cohort Low-risk cohort History of CV event cohort Modified CHD RE cohort Moderate-risk cohort Low-risk cohort Mean [CI] Mean [CI] Mean [CI] Mean [CI] Mean [CI] Mean[CI] Mean [CI] Mean [CI] Mean [CI] Mean [CI] Mean [CI] Mean [CI] Any CV event $41,168 [$39,130, $43,206] $41,648 [$41,126, $42,171] $40,500 [$39,039, $41,960] $39,869 [$38,768, $40,971] $9,436 [$7,547, $11,324] $8,301 [$7,850, $8,753] $6,622 [$5,267, $7,976] $5,900 [$5,103, $6,698] $11,400 [$8,834, $13,966] $7,386 [$6,834, $7,939] $6,622 [$5,160, $8,536] $4,704 [$3,906, $5,502] MI $51,686 [$46,728, $56,645] $52,671 [$51,515, $53,826] $49,538 [$46,939, $52,137] $47,840 [$46,131, $49,550] $10,596 [$4,563, $16,629] $8,105 [$7,199, $9,010] $4,935 [$3,249, $6,621] $5,131 [$4,210, $6,052] $11,249 [$6,336, $16,162] $7,052 [$6,059, $8,046] $5,160 [$2,809, $7,511] $4,623 [$3,608, $5,639] IS $36,572 [$31,751, $41,394] $36,560 [$34,951, $38,168] $34,511 [$30,796, $38,227] $33,791 [$30,996, $36,586] $7,691 [$3,934, $11,449] $7,679 [$6,400, $8,958] $10,009 [$4,623, $15,394] $5,437 [$3,369, $7,505] $11,227 [$4,008, $18,446] $6,652 [$5,200, $8,104] $4,996 [$799, $9,193] $4,403 [$1,673, $7,134] UA $34,874 [$30,297, $39,451] $31,627 [$30,649, $32,604] $31,737 [$28,737, $34,737] $28,659 [$26,689, $30,629] $7,108 [$3,350, $10,866] $6,339 [$5,487, $7,191] $6,377 [$3,454, $9,299] $6,015 [$3,666, $8,364] $7,504 [$1,757, $13,251] $6,530 [$5,399, $7,660] $3,626 [$1,375, $5,877] $3,227 [$1,729, $4,725] PCI $32,263 [$28,260, $36,266] $36,231 [$35,392, $37,070] $37,246 [$34,028, $40,463] $38,259 [$35,589, $40,929] $6,910 [$2,879, $10,941] $7,583 [$6,734, $8,431] $7,843 [$4,272, $11,414] $10,203 [$6,274, $14,131] $7,972 [$3,150, $12,794] $6,435 [$5,331, $7,539] $10,079 [$5,294, $14,864] $6,579 [$3,227, $9,931] CABG $55,548 [$50,438, $60,657] $65,296 [$63,447, $67,145] $65,015 [$59,236, $70,794] $65,825 [$59,970, $71,680] $583 [−$3,765, $4,930] $3,380 [$2,269, $4,490] $474 [−$2,803, $3,751] $6,414 [$862, $11,966] $5,081 [−$285, $10,447] $2,598 [$1,108, $4,088] $7,902 [−$4,782, $20,586] $7,716 [$63, $15,369] HF $46,890 [$40,421, $53,358] $45,514 [$43,687, $47,342] $43,064 [$36,834, $49,293] $41,001 [$34,370, $47,633] $19,617 [$13,899, $25,335] $17,525 [$15,544, $19,507] $11,289 [$4,682, $17,897] $11,897 [$5,582, $18,213] $26,982 [$16,976, $36,989] $17,638 [$14,810, $20,466] $17,484 [$8,773, $26,195] $7,820 [$2,547, $13,093] TIA $23,900 [$18,738, $29,062] $19,055 [$17,835, $20,275] $17,903 [$14,265, $21,540] $18,054 [$15,167, $20,940] $11,557 [$6,392, $16,722] $5,181 [$3,933, $6,429] $4,440 [$1,432, $7,447] $3,941 [$1,177, $6,704] $11,386 [$1,842, $20,931] $4,228 [$2,709, $5,748] $4,405 [−$547, $9,356] $4,087 [$1,796, $6,378]
CI Confidence interval, CV cardiovascular, CHD RE coronary heart disease risk equivalent, MI myocardial infarction, IS ischemic stroke, UA unstable angina, PCI percutaneous coronary intervention, CABG coronary artery bypass graft, HF heart failure, TIA transient ischemic attack
Fox et al. BMC Cardiova scular Disorders (2016) 16:13 Page 10 of 15
specific CV event type. Setting potentially arbitrary time cut-points to distinguish between different CV events among patients with multiple events may produce artifi-cial cost results, as some CV events may occur with little time gap and the cost of one event is entwined with the cost of the next event.
Our study also brings to light the noteworthy clin-ical and economic burden among patients in the high-risk cohorts (i.e., history of CV event and modified CHD RE cohorts). Inpatient LOS was, on average, 0.09 to 4.89 days longer among patients with history of a CV event or modified CHD RE, compared to those at moderate or lower risk, during all follow-up time periods, suggesting that high-risk patients have greater healthcare resource needs. Dur-ing the long-term post-CV event periods (1, 2 and 3 years follow-up), patients with a new CV event in the higher risk cohorts utilized more incremental ER visits PPPM, compared to those in the moderate- and low-risk cohorts, demonstrating the potential for a higher health-care cost burden during the longer-term post-CV event periods. Future research is warranted to more specifically determine the underlying reasons for the sustained differ-ence in clinical and economic burden between high-risk hyperlipidemic patients with a CV event and those with-out a CV event.
Our study results were similar to a study done by Karan et al., indicating similarity in findings that CVD had more outpatient and inpatients stays and economic burden of CVD is large [33]. However, this study utilized a national survey of households in India and focused on out-of-pocket spending and non-medical spending for CVD, whereas our present study focused on a patient-level perspective of direct medical costs for new CV events. Although previous studies provide a general frame of reference, the cost estimates are not directly comparable to the incremental direct costs in the present study since the studies differed in study design (matched cohorts versus survey sample) [34] and composition of the study population (US hyperlipidemia patients versus hypertension or solely acute coronary syndrome patients including those residing in devel-oping countries) [33, 34], sample size (n = 10,741 vs. 4,669) [10], CVD risk level (low through high CV risk vs. exclusion of high secondary prevention patients) [7, 8] and contemporaneous cost estimates (2009–2013 vs. 2001–2006) [7]. Due to considerable variation in costs by CV event type, the results of our analysis strengthen the importance of evaluating total and individual CV event costs, as this specific information may be essential for secondary prevention and treatment decisions for high-risk patients.
Our present study demonstrated the sustained high economic and clinical burden associated with the
occurrence of CV events among hyperlipidemic patients. In patients who have already experienced or who are at high risk for experiencing a CV event, lifestyle intervention strategies alone may not be sufficient to maximally reduce CVD risk [35, 36]. Current US treatment guidelines recommend lipid-lowering therapy in addition to lifestyle modifications to lower LDL-C levels for primary and secondary prevention for high-risk individuals [37]. Although statins are widely prescribed for elevated LDL-C levels, 9 %–20 % of treated patients, especially high-risk patients, continue to have elevated LDL-C and remain at risk for new CV events [38]. Potential new pharmacological treatments (e.g. anti-proprotein con-vertase subtilisin/kexin type 9 [PCSK9] monoclonal antibodies) aimed at significantly lowering LDL-C beyond that of current available treatment options [39], could potentially help to reduce the substantial clinical and economic burden.
Limitations
Our study limitations were primarily related to the retrospective use of claims data [7, 15]. Misclassifica-tion of CV risk, although it cannot be quantified, is likely to be low since the ICD-9-CM codes utilized to capture history of CVD included codes for old MI, stroke sequelae, etc. that would include a history of CVD beyond the baseline period. Similarly, im-portant patient information, including blood pres-sure, smoking history and family history was not available in the claims data to more accurately classify patients within the CHD RE cohort. Also, administrative claims data do not offer information on whether an elective procedure (CABG, PCI) was planned, thus planned procedures could not be com-pletely excluded from the study. Nevertheless, utilization of the PSM method reduced the differ-ences between patients with and without new CV events and created a balanced study cohort, such that healthcare utilization and incremental costs were more accurately compared.
Conclusion
Substantial incremental costs and healthcare resource utilization 1 month up to 3 years post-CV event highlight the short- and long-term economic and clin-ical burden especially on high-risk hyperlipidemic pa-tients and the US healthcare system. Interventions used to prevent or reduce the occurrence of CV events among patients with hyperlipidemia may result in substantial cost savings and reduce the clinical burden in the United States.
Appendix 1
Appendix 2
Appendix 3
Table 6 Cardiovascular risk levels and codes, modified based on NCEP ATP III guidelines
Risk Level Code
History of CV event Myocardial infarction ICD-9-CM: 410, 412
Unstable angina ICD-9-CM: 411.1, 411.81, 411.89
Coronary artery bypass graft CPT-4: 33503-33545
Percutaneous coronary intervention ICD-9 Procedure: 00.66, 36.09
Ischemic Stroke ICD-9 CM: 434, 436, 437.0, 437.1, 438, 997.02
Modified CHD RE Peripheral arterial disease ICD-9-CM: 440.0x-440.4x, 440.8x-440.9x, 443.81, 443.9x
Abdominal aortic aneurysm ICD-9-CM: 441.3x-441.4x
Coronary artery disease ICD-9-CM: 433.1x
Diabetes ICD-9-CM: 249.xx-250.xx
Dyslipidemia ICD-9-CM: 272.0x-272.4x
Moderate risk At least two of the following three risk factors identifiable from administrative claims data:
a) hypertension (ICD-9-CM code or pharmacy claim for a blood pressure–lowering agent),
b) age 45 years or older for men and 55 years or older for womenc) pre-index high-density lipoprotein (HDL) cholesterol below 40 mg/dl.
Hypertension: ICD-9-CM codes 401.1-401.9, 642.00-642.04, 401.0, 437.2, 402.00-405.99, 642.10-642.24, 642.70-642.94
Low risk Zero or one risk factor
CHD RE coronary heart disease risk equivalent, CV cardiovascular, ICD-9-CM International Classifications of Diseases, 9th
Revision Clinical Modifications, CPT Current Procedural Terminology, NCEPATP III National Cholesterol Education Program Adult Treatment Panel III
Table 5 Cardiovascular event identification codes
Cardiovascular events Diagnosis/Procedure codes
Myocardial Infarction ICD-9-CM: 410.xx
Unstable Angina ICD-9-CM: 411.1x, 411.8x
Ischemic Stroke ICD-9-CM: 433.x1, 434.x1
Coronary Artery Bypass Graft CPT: 33510-33514, 33516-33519, 33521-33523, 33530, 33533-33536 HCPCS: S2205-S2209
ICD-9-CM: 36.10-36.17, 36.19 Percutaneous Coronary Intervention ICD-9-CM: 00.66, 36.06, 36.07, 17.55
CPT: 92980, 92981, 92982, 92984-92996, 92973 HCPCS: G0290, G0291
Transient Ischemic Attack ICD-9-CM: 435.0x, 435.1x, 435.8x, 435.9x
Heart Failure ICD-9-CM: 428.xx
CPT Current Procedural Terminology, HCPCS Healthcare Common Procedural Coding System, ICD-9-CM International Classification of Diseases, Ninth Revision, Clinical Modification
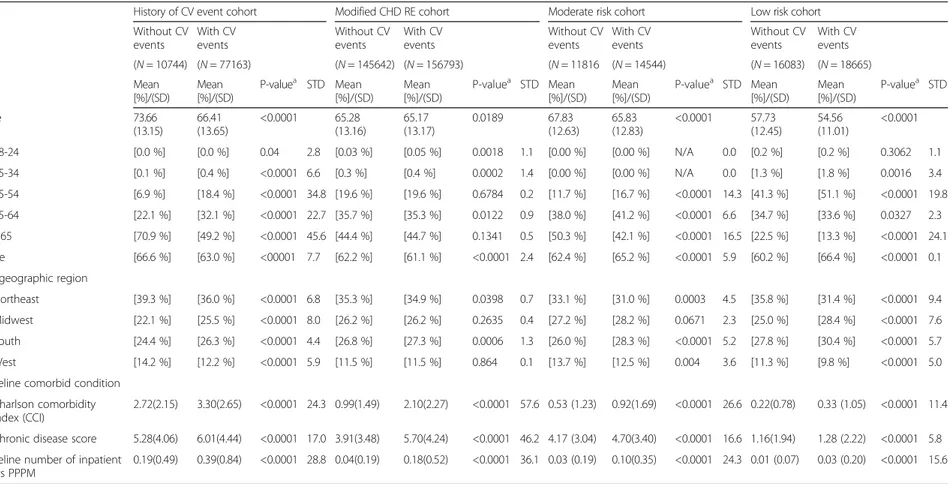
Table 7 12-month Pre-index demographic and clinical characteristics for hyperlipidemic patients with and without new CV events before matching History of CV event cohort Modified CHD RE cohort Moderate risk cohort Low risk cohort Without CV events With CV events Without CV events With CV events Without CV events With CV events Without CV events With CV events (N = 10744) (N = 77163) (N = 145642) (N = 156793) (N = 11816 (N = 14544) (N = 16083) (N = 18665) Mean [%]/(SD) Mean [%]/(SD) P-valuea STD Mean [%]/(SD) Mean [%]/(SD) P-valuea STD Mean [%]/(SD) Mean [%]/(SD) P-valuea STD Mean [%]/(SD) Mean [%]/(SD) P-valuea STD Age 73.66 (13.15) 66.41 (13.65) <0.0001 65.28 (13.16) 65.17 (13.17) 0.0189 67.83 (12.63) 65.83 (12.83) <0.0001 57.73 (12.45) 54.56 (11.01) <0.0001 18-24 [0.0 %] [0.0 %] 0.04 2.8 [0.03 %] [0.05 %] 0.0018 1.1 [0.00 %] [0.00 %] N/A 0.0 [0.2 %] [0.2 %] 0.3062 1.1 25-34 [0.1 %] [0.4 %] <0.0001 6.6 [0.3 %] [0.4 %] 0.0002 1.4 [0.00 %] [0.00 %] N/A 0.0 [1.3 %] [1.8 %] 0.0016 3.4 35-54 [6.9 %] [18.4 %] <0.0001 34.8 [19.6 %] [19.6 %] 0.6784 0.2 [11.7 %] [16.7 %] <0.0001 14.3 [41.3 %] [51.1 %] <0.0001 19.8 55-64 [22.1 %] [32.1 %] <0.0001 22.7 [35.7 %] [35.3 %] 0.0122 0.9 [38.0 %] [41.2 %] <0.0001 6.6 [34.7 %] [33.6 %] 0.0327 2.3 ≥65 [70.9 %] [49.2 %] <0.0001 45.6 [44.4 %] [44.7 %] 0.1341 0.5 [50.3 %] [42.1 %] <0.0001 16.5 [22.5 %] [13.3 %] <0.0001 24.1 Male [66.6 %] [63.0 %] <00001 7.7 [62.2 %] [61.1 %] <0.0001 2.4 [62.4 %] [65.2 %] <0.0001 5.9 [60.2 %] [66.4 %] <0.0001 0.1 US geographic region Northeast [39.3 %] [36.0 %] <0.0001 6.8 [35.3 %] [34.9 %] 0.0398 0.7 [33.1 %] [31.0 %] 0.0003 4.5 [35.8 %] [31.4 %] <0.0001 9.4 Midwest [22.1 %] [25.5 %] <0.0001 8.0 [26.2 %] [26.2 %] 0.2635 0.4 [27.2 %] [28.2 %] 0.0671 2.3 [25.0 %] [28.4 %] <0.0001 7.6 South [24.4 %] [26.3 %] <0.0001 4.4 [26.8 %] [27.3 %] 0.0006 1.3 [26.0 %] [28.3 %] <0.0001 5.2 [27.8 %] [30.4 %] <0.0001 5.7 West [14.2 %] [12.2 %] <0.0001 5.9 [11.5 %] [11.5 %] 0.864 0.1 [13.7 %] [12.5 %] 0.004 3.6 [11.3 %] [9.8 %] <0.0001 5.0 Baseline comorbid condition
Charlson comorbidity index (CCI)
2.72(2.15) 3.30(2.65) <0.0001 24.3 0.99(1.49) 2.10(2.27) <0.0001 57.6 0.53 (1.23) 0.92(1.69) <0.0001 26.6 0.22(0.78) 0.33 (1.05) <0.0001 11.4 Chronic disease score 5.28(4.06) 6.01(4.44) <0.0001 17.0 3.91(3.48) 5.70(4.24) <0.0001 46.2 4.17 (3.04) 4.70(3.40) <0.0001 16.6 1.16(1.94) 1.28 (2.22) <0.0001 5.8 Baseline number of inpatient
visits PPPM
0.19(0.49) 0.39(0.84) <0.0001 28.8 0.04(0.19) 0.18(0.52) <0.0001 36.1 0.03 (0.19) 0.10(0.35) <0.0001 24.3 0.01 (0.07) 0.03 (0.20) <0.0001 15.6
CHD RE coronary heart disease risk equivalent, SD standard deviation, STD standardized difference, CV cardiovascular, CVD cardiovascular disease, PPPM per patient per month
a
Chi-square tests were used to evaluate the statistical significance of differences in categorical variables; student t-tests were used for the continuous variables
Fox et al. BMC Cardiova scular Disorders (2016) 16:13 Page 13 of 15
Competing interests
The current study was sponsored by Amgen Inc. R.G.W.Q. and S.R.G. are employees of Amgen, Inc. L.W., L.L. and O.B. are employees of STATinMED Research, which is a paid consultant to Amgen, Inc. K.M.F. is an independent consultant who received research funds from Amgen, Inc.
Authors’ contributions
RGWQ and SRG are employees of Amgen Inc. and participated in the study design, and provided data interpretation and critical review of the study results and manuscript. LW, OB and LL are employees of STATinMED Research, which is a paid consultant to Amgen Inc, and participated in the design of the study, interpretation of data, drafting of the manuscript, and performed the statistical analysis. KMF received research funds from Amgen Inc. and participated in the study design, data interpretation, and critical review of the study results and manuscript. All authors read and approved the final manuscript.
Acknowledgments
The authors would like to thank Sulena Shrestha and Elizabeth Vivier of STATinMED Research for assistance with the writing and editing, respectively, of this manuscript.
Author details
1Strategic Healthcare Solutions, LLC, Monkton, MD, USA.2STATinMED
Research, Plano, TX, USA.3Amgen Inc, Thousand Oaks, CA, USA.4Center for
Innovation & Outcomes Research, Department of Surgery, Columbia University, New York, NY, USA.5MEF University, Istanbul, Turkey.6Strategic
Healthcare Solutions, LLC, 133 Cottonwood Creek Lane, Aiken, SC 29803, USA.
Received: 3 March 2015 Accepted: 8 January 2016
References
1. Bloom DE, Cafiero ET, Jané-Llopis E, Abrahams-Gessel S, Bloom LR, Fathima S, et al., editors. The Global Economic Burden of Non-communicable Diseases. Geneva: World Economic Forum; 2011. http://www.hsph.harvard.edu/program-on-the-global-demography-of-aging/WorkingPapers/2012/PGDA_WP_87.pdf. Accessed 14 July 2015.
2. Mozaffarian D, Benjamin EJ, Go AS, Arnett DK, Blaha MJ, et al. American Heart Association Statistics Committee and Stroke Statistics Subcommittee: Heart disease and stroke statistics–2015 update: A report from the American Heart Association. Circulation. 2015;131:e29–e322.
3. Soni A. Top 10 most costly condition among men and women 2008: estimates for the U.S. civilian noninstitutionalized adult population, age 18 and older. Medical Expenditure Panel Survey. Statistical Brief #331. http://meps.ahrq.gov/mepsweb/data_files/publications/st331/stat331.shtml. Accessed 14 July 2014.
4. Willerson JT, Ridker PM. Inflammation as a cardiovascular risk factor. Circulation. 2004;109(21 Suppl 1):II2–10.
5. American Heart Association: Heart disease and stroke statistics–2014 update: a report from the American Heart Association. Circulation. 2014;129:e28-e292. 6. Centers for Disease Control and Prevention: High Cholesterol Facts. http://
www.cdc.gov/cholesterol/facts.htm. Accessed 14 July 2014.
7. Chapman RH, Liu LZ, Girase PG, Straka RJ. Determining initial and follow-up costs of cardiovascular events in a US managed care population. BMC Cardiovasc Disord. 2011;11:11. doi:10.1186/1471-2261-11-11.
8. Grover SA, Ho V, Lavoie F, Coupal L, Zowall H, Pilote L. The importance of indirect costs in primary cardiovascular disease prevention: can we save lives and money with statins? Arch Intern Med. 2003;163(3):333–9. 9. Trogdon JG, Finkelstein EA, Nwaise IA, Tangka FK, Orenstein D. The
economic burden of chronic cardiovascular disease for major insurers. Health Promot Pract. 2007;8(3):234–42.
10. O’Sullivan AK, Rubin J, Nyambose J, Kuznik A, Cohen DJ, Thompson D. Cost estimation of cardiovascular disease events in the US. Pharmacoeconomics. 2011;28(8):693–704.
11. Engelgau MM, Karan A, Mahal A. The economic impact of non-communicable diseases on households in India. Global Health. 2012;8:9. doi:10.1186/1744-8603-8-9.
12. Leeder S, Raymond S, Greenberg H, Liu H, Esson K. A Race against Time: The Challenge of Cardiovascular Disease in Developing Countries. New York: Columbia University Press; 2004.
13. Eisenstein EL, Shaw LK, Anstrom KJ, Nelson CL, Hakim Z, Hasselblad V, et al. Assessing the clinical and economic burden of coronary artery disease: 1986–1998. Med Care. 2001;39(8):824–35.
14. Etemad LR, McCollam PL. Total first-year costs of acute coronary syndrome in a managed care setting. J Manag Care Pharm. 2005;11(4):300–6. 15. Duh MS, Fulcher NM, White LA, Jayawant SS, Ramamurthy P, Moyneur E, et
al. Costs associated with cardiovascular events in patients with hypertension in US managed care settings. J Am Soc Hypertens. 2009;3(6):403–15. 16. Ohsfeldt RL, Gandhi SK, Fox KM, Bullano MF, Davidson M. Medical and cost
burden of atherosclerosis among patients treated in routine clinical practice. J Med Econ. 2010;13(3):500–7.
17. Straka RJ, Liu LZ, Girase PS, DeLorenzo A, Chapman RH. Incremental cardiovascular costs and resource use associated with diabetes: an assessment of 29,863 patients in the US managed-care setting. Cardiovasc Diabetol. 2009;8:53. doi:10.1186/1475-2840-8-53.
18. Stellhorn R, Ciniglio C, Sengupta N. Risk of cardiovascular and major bleeding event rehospitalizations and cost of care among ACS patients in the US. Circ Cardiovas Qual Outcomes. 2012;5:A318.
19. Vlachopoulos CV, Terentes-Printzios DG, Loakeimidis NK, Aznaouridis KA, Stefanadis CI. Prediction of cardiovascular events and all-cause mortality with erectile dysfunction. Circ Cardiovasc Qual Outcomes. 2013;6(1):99–109. 20. Chuang CS, Yang T, Muo CH, Su H, Sung F, Kao C. Hyperlipidemia, statin use
and the risk of developing depression: a nationwide retrospective cohort study. General Hospital Psychiatry. 2014;36:497–501.
21. Parsons LS, Ovation Research Group, Seattle, WA. Reducing bias in a propensity score matched-pair sample using greedy matching techniques. Paper 214–26. http://www2.sas.com/proceedings/sugi26/p214-26.pdf. Accessed 14 July 2014.
22. Austin PC. An introduction to propensity score methods for reducing the effects of confounding in observational studies. Multivariate Behav Res. 2011;46(3):399–424.
23. Normand ST, Landrum MB, Guadagnoli E, Ayanian JZ, Ryan TJ, Cleary PD, et al. Validating recommendations for coronary angiography following acute myocardial infarction in the elderly: A matched analysis using propensity scores. J Clin Epidemiol. 2001;54(4):387–98.
24. Asche CV, Kim J, Kulkarni AS, Chakravarti P, Andersson KE. Assessment of association of increased heart rates to cardiovascular events among healthy subjects in the United States: Analysis of a primary care electronic medical records database. Cardiology. Cardiology. 2011;2011:924343. doi: 10.5402/ 2011/924343.
25. Charlson ME, Charlson RE, Peterson JC, Marinopoulos SS, Briggs WM, Hollenberg JP. The Charlson comorbidity index is adapted to predict costs of chronic disease in primary care patients. J Clin Epidemiol. 2008;61(12):1234–40. 26. Petersen LA, Pietz K, Woodard LD, Byrne M. Comparison of the predictive
validity of diagnosis-based risk adjusters for clinical outcomes. Med Care. 2005;43(1):61–7.
27. Von Korff M, Wagner EH, Saunders K. A chronic disease score from automated pharmacy data. J Clin Epidemiol. 1992;45(2):197–203. 28. McGregor JC, Kim PW, Perencevich EN, et al. Utility of the Chronic Disease
Score and Charlson Comorbidity Index as comorbidity measures for use in epidemiologic studies of antibiotic-resistant organisms. Am J Epidemiol. 2005;161(5):83–493.
29. Expert Panel on Detection, Evaluation, and Treatment of High Blood Cholesterol in Adults. Executive Summary of the Third Report of the National Cholesterol Education Program (NCEP) Expert Panel on Detection, Evaluation, and treatment of high blood cholesterol in Adults (Adult Treatment Panel III). JAMA. 2001;285(19):2486–97.
30. Song X, Quek RG, Gandra SR, Cappell KA, Fowler R, Cong Z. Productivity loss and indirect costs associated with cardiovascular events and related clinical procedures. BMC Health Serv Res. 2015;15:245. doi:10.1186/s12913-015-0925-x. 31. Weiss AJ, Barrett ML, Steiner CA. Trends and projections in inpatient hospital
costs and utilization, 2003–2013. Healthcare Cost and Utilization Project (HCUP) Statistical Brief #175. July 2014. Agency for Healthcare Research and Quality, Rockville, MD. http://www.hcup-us.ahrq.gov/reports/statbriefs/ sb175-Hospital-Cost-Utilization-Projections-2013.pdf. Accessed 14 July 2014 32. Caldwell N, Srebotnjak T, Wang T, Hsia R. How much will I get charged for this? Patient charges for top ten diagnoses in the emergency department. PLoS One. 2013;8(2):e55491.
33. Karan A, Engelgau M, Mahal A. The household level economic burden of heart disease in India. Trop Med Int Health. 2014;19(5):581–91. 34. Mahal M, Karan A, Engelgau M. The economic implications for
non-communicable disease in India. HNP Discussion Paper, World Bank, January, 2010. http://siteresources.worldbank.org/HEALTHNUTRITIONANDPOPULATION/ Resources/281627-1095698140167/EconomicImplicationsofNCDforIndia.pdf. Accessed 14 January 2015
35. Bouillon K, Singh-Manoux A, Jokela M, Shipley MJ, Batty GD, Brunner EJ, et al. Decline in low-density lipoprotein cholesterol concentration: lipid-lowering drugs, diet, or physical activity? Evidence from the Whitehall II study. Heart. 2011;97(11):923–30.
36. Stone NJ, Robinson JG, Lichtenstein AH, Bairey Merz CN, Blum CB, Eckel RH, et al. ACC/AHA guideline on the treatment of blood cholesterol to reduce atherosclerotic cardiovascular risk in adults: A report of the American College of Cardiology/American Heart Association Task Force on Practice Guidelines. Circulation. 2014;129:S1–45.
37. National Cholesterol Education Program. Detection, evaluation, and treatment of high blood cholesterol in adults (Adult Treatment Panel III). http://www.nhlbi.nih.gov/files/docs/guidelines/atp3xsum.pdf. Accessed 17 June 2014.
38. Sampson UK, Fazio S, Linton MF. Residual cardiovascular risk despite optimal LDL-cholesterol reduction with statins: The evidence, etiology and therapeutic challenges. Curr Atheroscler Rep. 2010;14(1):1–10.
39. Dadu RT, Ballantyne CM. Lipid lowering with PCSK9 inhibitors. Nat Rev Cardiol. 2014;11(10):563–75.
• We accept pre-submission inquiries
• Our selector tool helps you to find the most relevant journal
• We provide round the clock customer support
• Convenient online submission
• Thorough peer review
• Inclusion in PubMed and all major indexing services
• Maximum visibility for your research Submit your manuscript at
www.biomedcentral.com/submit