Time - Cost Relationships for Superstructure
Projects in Turkey
* Murat SÖNMEZ1 S. Ümit DİKMEN2 Rıfat AKBIYIKLI3 ABSTRACTThe concept of time-cost relationship in construction projects was first introduced by Bromilow, using the data of the 328 superstructure projects completed in Australia. The aim of this study is to determine the time-cost relationship of superstructure projects in Turkey. Time and cost data of 460 superstructure projects completed between the years of 1999-2018 was used in the study. Data was grouped primarily on the basis of the intended use of buildings (individual buildings, educational buildings, hospitals, industrial buildings and social housing), and then time-cost relationships were separately determined for each group through statistical analysis. In addition, the effects of the parameters such as exchange rates and the number of non-working days on the time-cost relationship were investigated statistically, as well. As a result of this study, highly meaningful time-cost relationships (R2 =0,60) are determined for the construction projects in Turkey, excluding disaster relief
projects, which is not part of this study. It has also been determined that while the hospital projects in Turkey has the highest coefficient of determination (R2= 0,87), social housing projects has the lowest (R2= 0,54).
Keywords: Bromilow’s time-cost (BTC) model, building projects, construction
management, duration estimation, regression analysis.
Abbreviations
BTC : Bromilow's time - cost CBRT : Central Bank of Turkey
C : Cost ER : Exchange Rate
Note:
- This paper has been received on September 03, 2018 and accepted for publication by the Editorial Board on March 18, 2019.
- Discussions on this paper will be accepted by xxxxxxx xx, xxxx.
https://dx.doi.org/10.18400/tekderg.456761
1 Sakarya University, Institute of Natural Sciences, Sakarya, Turkey - [email protected] - https://orcid.org/0000-0003-2328-6817
2 MEF University, Civil Engineering Department, Istanbul, Turkey - [email protected] - https://orcid.org/0000-0002-4003-1368
3 Duzce University, Civil Engineering Department, Duzce, Turkey - [email protected] - https://orcid.org/0000-0003-1584-9384
LTF : Love et al.'s Time-Floor NWD : Non-Working Days
PPI : Producer Price Index PRI : Private
PUB : Public T : Time
TOKİ : Public Housing Administration 1. INTRODUCTION
In construction, the prediction of a reasonably accurate time and cost relationship is necessary for a successful planning at all phases of the projects [1]. The idea of investigating the time-cost relationship of construction projects was first proposed by Bromilow in 1969 [2]. Bromilow suggested that there is a strong relationship between the realization times of the projects and their cost in his study on building projects in Australia. This relationship proposed by the researcher is known as Bromilow's time - cost (BTC) model in the literature. This result is undoubtedly a very important guide both for the investors and the contractors in estimating the duration of the project as far as possible [3]. Bromilow has also stated that the time and cost variables of the BTC model can be affected and varied at various levels by a number of factors such as the type of project, the climate conditions of the location where the project is realized, the changes in the exchange rate, and the terms of the contract [2]. Subsequently, the model proposed by Bromilow has been studied by numerous researchers at different parts of the world, especially taking into account the influence of local factors [2, 3]. Although several new approaches such as using Artificial Neural Networks [4], reference group class [5], genetic algorithms [6] etc., proposed for predicting time cost relationship in construction projects, the BTC approach still is the widely accepted approach due to its simplicity.
The aim of this study is to determine the time-cost relationship of superstructure projects in Turkey utilizing the data of the projects completed by public and private sectors between years 1999-2018. In the study, data of these projects are categorized under five different major types, namely hospitals, educational buildings, social housing, individual buildings and industrial building projects. In the study, the effects of the periodical exchange rates and the number of non-working days were also investigated. In this context, the data of the 460 completed projects were analyzed. Consequently, remarkably good results were obtained which can be utilized in the construction sector for project planning in Turkey.
2. RELATED WORK
2.1. Bromilow’s Time - Cost Model
As mentioned above, the idea of a possible relationship between the realization cost and the construction duration of projects was first proposed and researched by Bromilow [2]. In his study in 1969, Bromilow examined the time-cost relationship of 328 superstructure projects in Australia. The researcher mathematically expressed the relationship between the cost and construction time of the projects by the following equation,
where, T is the time period between the calendar day that the project starts with the contract signing and ends with the substantial completion of the project. C is the final cost for the project to owner, namely the investor at the end of the project. In other words, it is the total payment received by the contractor. On the other hand, K and B are the coefficients that correlate time and cost. K is a characteristic of the construction time performance (depending on the country), and B is the value that shows the performance of the construction time versus the financial sensitivity. Though Equation (1) is an exponential equation, it can readily be transformed into a linear form as follows,
ln 𝑇 = ln 𝐾 + 𝐵 ln 𝐶 (2)
Hence, now the coefficients K and B can easily be calculated by regression analysis. Bromilow, for Australia, determined the K coefficient as 350 and the B coefficient as 0.30 in his study (Figure 1). The researcher assigned the value of C in AU$ 1 million. Based on these coefficients, for example, a project with a cost of AU$ 1 million constructed in Australia in 1969 would require approximately 350 days.
Figure 1 - Bromilow’s original data set (1969) [1]
2.2. Related Studies in Other Countries
Numerous researchers, by using data sets from different countries, conducted studies to determine the country specific K and B values of the BTC model. A summary of these studies demonstrating K, B and R2 values is presented in Table 1. The R2, a statistical value, indicates
the strength of the relationship between the variables, namely cost and time. An R2 = 1
indicates that the time-cost relation is fully explained, whereas if the value is 0, it can be concluded that there is no relationship [8].
Love et.al. (2005) considered the physical characteristics as an important determinant of the construction time and proposed the LTF (Love et al.'s Time-Floor) model derived from the
BTC model for calculating construction time by using the total floor area and number of floors [9]. Ng et al. (2001) found that unit construction periods developed positively over time, when compared to previous findings in Australia, and they attributed this improvement to increased productivity in construction projects over time after Bromilow's study [2, 11]. Kaka and Price (1991) tested the BTC model for public and private sector projects and consequently claimed that the time cost relationship did not vary between the public and private sectors [12].
Table 1 - Equations obtained by other researchers with the Bromilow BTC Model (adapted from Kenley (2003) [40]).
Country Author Year K B R²
Num. Of
Projects P. Type Currency
Australia
Bromilow [2] 1969 287.0 0.30 - 329 Pub.+Pri. AUD Bromilow [19] 1974 313.0 0.30 - 370 Pub.+Pri. AUD Ireland [9] 1985 219.0 0.47 0.58 25 Pub.+Pri. AUD Yeong [20] 1994 269.0 0.22 - 87 Pub.+Pri. AUD Ng vd. [11] 2001 130.9 0.31 0.58 93 Pub.+Pri. AUD USA Hoffman et.al. [14] 2006 26.8 0.20 0.34 580 Pri. USD Choudhury et.al. [9] 2003 19.0 0.39 0.74 55 Pri. USD Bangladesh Choudhury et.al. [9] 2002 5.0 0.27 0.65 35 Pub. BDT Mizanur et.al. [21] 2014 156.0 0.36 0.65 63 Pub.+Pri. BDT Bosnia and
Herzegovina
Zujo ve Pusic[22] 2008 70.0 0.52 0.39 29 Pri. HRK Zujo ve Pusic[22] 2008 79.0 0.41 0.51 24 Pri. HRK Petruseva et.al. [23] 2013 0.1 0.55 0.73 75 Pri. BAM China Sun et.al. [24] 2010 42.4 0.29 0.52 72 Pri. CNY
Indonesia Sriana et.al.-Bireun[25] 2015 24.1 0.14 0.09 105 Pub. IDR
Sriana et.al.-Pidie[25] 19.0 0.15 0.12 IDR
Sriana et.al.-Utara[25] 12.8 0.26 0.83 IDR
Sriana et.al.-Selatan[25] 24.5 0.13 0.52 IDR
Sriana et.al.-Barat[25] 6.68 0.36 0.76 IDR
Sriana et.al.-Timur[25] 99.3 -0.13 0.05 IDR
Sriana et.al.-Tengah[25] 15.7 0.21 0.37 IDR
Sriana et.al.-Banda[25] 53.8 -0.03 0.01 IDR
Ghana Ameyaw . [26] 2012 3.2 0.38 0.38 62 Pri. GHS
S.Korea Le-Long et.al.. [27] 2009 341.0 0.18 0.76 34 Pub.+Pri. KRW
India Choudhury[28] 2009 4.4 0.28 0.37 50 Pri. INR
India Car ve Radujkovic[29] 2010 58.0 0.50 0.71 107 Pub. HRK Hong Kong Kumaraswamy et.al. [13] 1995 152.0 0.22 0.85 111 Pub.+Pri. HKD UK Kaka ve Price[12] 1991 486.7 0.21 0.68 661 Pub. GBP
Table 1 - Equations obtained by other researchers with the Bromilow BTC Model (adapted from Kenley (2003) [40]). (Continue)
Country Author Year K B R²
Num. Of
Projects P. Type Currency
Kuwait Jarkas[30] 2016 28.8 0.19 0.80 113 Pri. USD
7.9 0.28 0.85 74 Pri. USD
Malaysia
Yeong[20] 1994 518.0 0.35 - 51 Pri. AUD
Endut et.al. [16] 2006 328.0 0.25 - 301 Pri. MYR
Chan[15] 2001 269.0 0.32 0.41 51 Pub. MYR
Nigeria
Ojo[18] 2001 27.0 0.13 0.18 - Pri. -
Ogunsemi et.al. [17] 2006 63.0 0.26 0.21 87 Pub.+Pri. NGN
Waziri[28] 2014 2.8 0.54 0.54 32 Pub. NGN
Slovakia Mačková et.al. [32] 2014 384.0 0.26 0.77 28 Pri. EURO Mixed Özçekiç[33] 2007 137.3 46.05 0.76 209 Pri. USD Turkey Odabaşı[7] 2009 161.7 0.58 0.93 7 Pub.+Pri. AUD Bayram[3] 2016 209.0 0.35 0.26 424/530 Pub. TRY Vietnam Le-Hoai et.al. [34] 2009 98.1 0.34 0.44 77 Pub. VND Le-Hoai et.al. [34] 2009 87.2 0.35 0.38 Pri VND
Currencies are shown in accordance with ISO 4217 standard [37]. Pub.= Projects of public sector; Pri.= Projects of private sector; Pub.+Pri.= Projects of public and private sector (Table 1.) Choudhury et al. (2003) used 1000 USD for project costs in their analysis [
Kumaraswamy et al. (1995) [13] conducted a study by using the BTC model on the 111 projects in Hong Kong. They analyzed these projects in the data set under public and private sub-groups. They confirmed the usability of the model proposed by Bromilow. Hoffman et al. (2007) focused on the Air Force-financed facility projects and indicated that the BTC model represents the data set to a large extent, and they suggested that the BTC model can be used in order to determine time-cost relationship.
Kaka and Price (1991) categorized the projects as public and private sector industrial projects; Kumaraswamy et al. (1995), Chan (2001), Ng et al. (2001), Endut et al. (2006) Ogunsemi and Jagboro (2006) categorized the projects in their studies according to their intended use (residential, commercial education) [11,12,13,15,16,17]. While, in general, the existence of a time-cost relationship in the construction projects is confirmed by these studies conducted in various countries by using BTC model, some studies also suggested that such a time-cost relationship may be inadequate for some other countries.
Ojo (2001) and Ogunsemi and Jagboro (2006) stated that the BTC model has poor forecasting capability for Nigerian construction projects [17, 18]. The uncertainties in the country, the regional factors and the fluctuations in the economy have been shown as the main reasons for the weak relationship between time and cost. In this respect, the researchers investigated the projects in their data set and proposed a fragmented structure, as an alternative to BTC
model, from the breakpoints of the projects and obtained more meaningful results in terms of the studied region.
On the other hand, Ireland (1985) proposed a model to determine the speed of construction (Speed), taking into account physical factors such as gross floor area per day and number of storeys to be constructed [8, 9].
log 𝑆𝑃𝐸𝐸𝐷 = −5.72956 + 2.96889 log 𝐴𝑅𝐸𝐴 . + . (3)
All the studies carried out with different data sets are presented in Table 1, except Yeong (1994) and Chan (2001)’s studies. These researchers conducted their studies for Malaysia and used the same data set to form the BTC model, but they found different K values with the same data set as seen in the Table 1 [15, 20]. The fundamental reason for the discrepancy of the K coefficients between two studies (Yeong’s K=518 and Chan’s K= 269) is that Yeong (1994) transformed the project costs into AUD during his study [20]. On the other hand, as can be seen from Table 1, the B coefficients did not show any change when compared to the K coefficient. The main result that can be construed from this situation is that while the currency directly affects the coefficient K in the model, on the other hand currency does not affect the coefficient B in the BTC model. Additionally, it is understood that models can be compared using B coefficients, even though the models, created for different countries, use different currencies. Okere (2018) aimed to study on time-cost relationship of road projects realized in Washington State by using the BTC model. The researcher found positive correlation (R2 = 0,695) between time and cost of the road projects [35]. Adeyemi and Masalila (2016) investigated time-cost relationship of construction projects in Botswana. Researchers found that BTC model can reveal time-cost relationship (R2= 0,817) of construction projects realized in the Botswana [36].
In conclusion, as can be seen from Table 1, while there are studies that confirm the relationship between time and cost, there are also studies that show low correlation between these two variables. In the literature survey, it was found that the variability of economic conditions, working styles and technical qualifications in the regions where the data set of the studies were collected affect the time and cost relationship significantly. Therefore, taking into account these basic factors that affect the construction projects can provide more accurate results in terms of time-cost relationship.
2.3. Time - Cost Model Studies in Turkey
In Turkey, several studies were conducted. Bayram (2017) investigated the completion period of the public buildings, consisting health and educational buildings, in Turkey using both Bromilow’s time-cost (BTC) and Love's Time - Floor (LTF) models. The researcher concluded that the BTC model is superior to the LTF model, stating that "cost" is a more significant predictor of duration than number of floors and total floor area [6]. Odabaşı (2009) examined the construction projects, consisting 7 educational buildings, carried out between 2004 and 2007 at the Middle East Technical University Campus and the factors affecting the construction time. Odabaşı has suggested that the BTC model can be used in predicting time-cost relationship in construction projects [7].
3. METHODOLOGY 3.1. Data Set
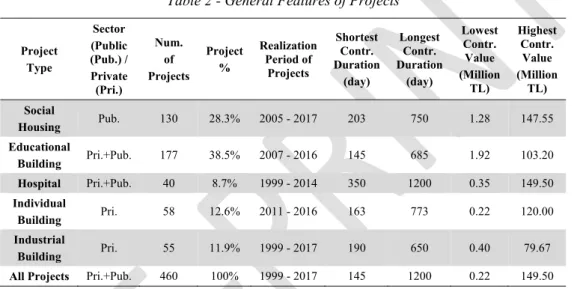
As presented in Table 1, researchers have studied data sets by classifying according to customer types, namely public and private, as well as classifying according to the function of the structure, such as hospital and educational buildings [38]. In this study, during the preparation phase of this work, data of 501 projects carried out in 56 cities in Turkey between 1999 and 2018 has been collected (Table 2).
Table 2 - General Features of Projects
Project Type Sector (Public (Pub.) / Private (Pri.) Num. of Projects Project % Realization Period of Projects Shortest Contr. Duration (day) Longest Contr. Duration (day) Lowest Contr. Value (Million TL) Highest Contr. Value (Million TL) Social Housing Pub. 130 28.3% 2005 - 2017 203 750 1.28 147.55 Educational Building Pri.+Pub. 177 38.5% 2007 - 2016 145 685 1.92 103.20 Hospital Pri.+Pub. 40 8.7% 1999 - 2014 350 1200 0.35 149.50 Individual Building Pri. 58 12.6% 2011 - 2016 163 773 0.22 120.00 Industrial Building Pri. 55 11.9% 1999 - 2017 190 650 0.40 79.67 All Projects Pri.+Pub. 460 100% 1999 - 2017 145 1200 0.22 149.50
The data collected for each project consists the date of the contract, date and place of delivery of the project, the date of completion of the work according to the contract, the contract value, date of the temporary acceptance, the location of the project, the employer and the contractor firm, the actual payments (cash flows), realization date and cost of the Project. Project data was obtained by interviewing project managers of the Public Housing Administration (Toplu Konut İdaresi-TOKİ) and 65 construction companies operating in the sector. TOKİ projects consist of TOKİ Disaster Housing projects and TOKİ Social Housing projects. However, Disaster Housing projects were excluded from this study because they were built under extraordinary conditions that occurred after the disaster. Therefore, 41 projects were removed from the data set leaving 460 projects to be used in the analysis. The project groups are hospitals (8.70%), industrial buildings (11.96%), individual buildings (12.61%), social housing (28.56%) and educational buildings (38.48%) as tabulated in Table 2. The shortest completion period in the data set is 145 days and the longest is 1200 days. The minimum and maximum contract values are 0.22 and 149.50 Million TL at the time of contract signing. The average contract value of the projects in the dataset was determined to be approximately 20 Million TL and the realized completion cost is calculated as approximately 21 Million TL. The average completion time of the projects was determined as 422 days. On the other
hand, the data set contains both private and public projects. Hence the data set used in this study is a much more comprehensive set than the earlier studies made on Turkish projects. Projects in the data set were classified in 3 main groups based on their types of use, exchange rates at the time they were built and the non-working days of the cities where they were built. These 3 main groups also have their respective sub-groups as will be explained below.
3.2. Data Analysis
The projects in the data set were realized at different times. Hence, the project costs were affected by the changing economic conditions. Within this framework, the realization cost of the projects should be free from the time effect via indexes and be made comparable on a common basis as recommended in the Bromilow’s (1969) BTC model. Therefore, the Equation (4) is used in this study in order to remove time effects from realization costs.
𝐴𝑑𝑗𝑢𝑠𝑡𝑒𝑑 𝑅𝑒𝑎𝑙 𝐶𝑜𝑠𝑡 = 𝑅𝑒𝑎𝑙 𝐶𝑜𝑠𝑡 1 + (4)
where, I1 refers to the index value at the contract date, and I2 refers to the date at which the
project costs are to be examined. Whereas, Real Cost shows the realization cost of the project at the time of delivery and the Adjusted Real Cost shows the cost of projec free from the time effects. In this study, the project costs were adjusted to April 2018 by using the producer price index (PPI) provided at the web site of TUİK.
All the data analysis was performed using Mathworks Matlab version R2017a [39].
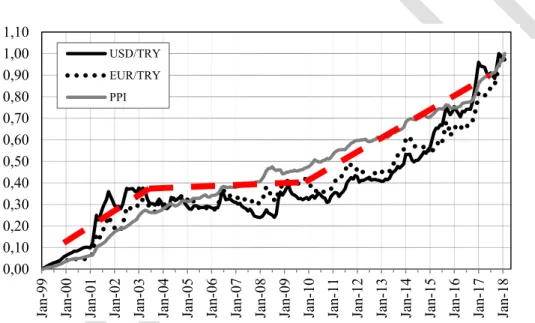
3.3. Grouping per Exchange Rates and Number of Non-Working Days
Ireland (1985) emphasized the utility of the BTC model, while underlined the fact that adding variables that measure the time, cost, and quality to the BTC model, would provide more efficient results for projects [9]. Ojo, (2001) and Ogunsemi and Jagboro (2006) showed that the BTC model cannot achieve much success because of the fluctuations and uncertainties in the construction sector and also put forward that alternative mathematical approaches that fit with conditions, could be used for predicting time-cost relationship [17, 18]. Kumaraswamy and Chan (1995) reported that the construction duration was affected by the project location [10]. Finally, Kenley (2003) suggested that the implications and roles of project classifications in prediction models should be addressed by researchers in further works [40]. On the other hand, it is known that the construction sector in Turkey is affected by the exchange rates due to high use of imported materials [41, 42]. Hence, examination of the effect of exchange rates is important. To study their potential effect, exchange rate information was obtained from the website of the Central Bank of Turkey (CBRT). The exchange rates were normalized dividing by the January 2018 rates (Figure 2) [42]. As can be seen from Figure 2, there are 3 different periods in terms of exchange rate trends. Between 1999 and 2003 is the first period when exchange rates displayed a continuous rising trend, on the other hand between 2003 and 2010 is the second period when exchange rates stayed relatively stable. In the third and the last period, between 2010 and 2018, exchange
rates had both fluctuating and rising trends. At first, it had been planned to analyze projects under 3 different periods mentioned above. However, the 1999-2003 period was not taken as a separate group because this period is very short compared to the other two and there was not sufficient amount of data to evaluate the effect of exchange rates. As a result, the exchange rates were separated into two periods according to the exchange rate movements and are indicated by the dashed line in Figure 2. In this study, the period of 2003-2010, in which the exchange rates are relatively stable, was defined as the first group, and the fluctuating period of 2010-2018 was defined as the second group. It is considered that the grouping of the projects according to two periods mentioned above will also help to understand the effect of exchange rate and to give more accurate results.
Figure 2 - Normalized USD/TRY, EUR/TRY ER and the PPI between 1999 -2018
In Figure 2, the variation of PPI by years is also demonstrated. When the trend of the index is examined, it can be seen that PPI has a tendency to increase continuously similar to the exchange rates.
The number of non-working days signifies the number of days that cannot be worked due to climatic conditions in construction projects. In order to be able to investigate the effect of the time component, which is one of the two main components of the BTC model, on the completion of the project, the number of non-working days is included in the analysis. The number of non-working days (NWD) is determined by the Ministry of Environment and Urbanization for each province in Turkey [44]. Using this parameter, a grouping was made according to non-working days determined within the scope of the circular published by the Ministry according to conditions of the provinces where the projects take place.
0,00 0,10 0,20 0,30 0,40 0,50 0,60 0,70 0,80 0,90 1,00 1,10 Jan-99 Jan-00 Jan-01 Jan-02 Jan-03 Jan-04 Jan-05 Jan-06 Jan-07 Jan-08 Jan-09 Jan-10 Jan-11 Jan-12 Jan-13 Jan-14 Jan-15 Jan-16 Jan-17 Jan-18 USD/TRY EUR/TRY PPI
4. ANALYSIS AND RESULTS 4.1. Basic Analysis
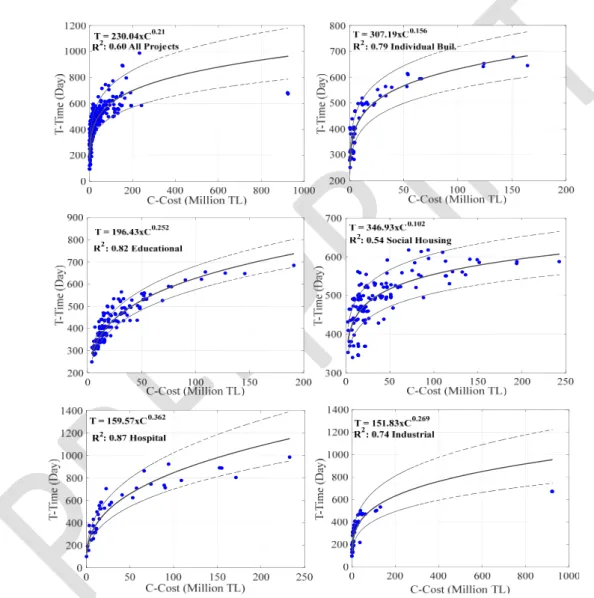
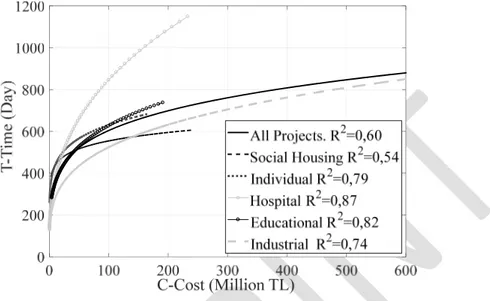
Figure 3 shows the time-cost relationship of the building groups according to their intended use. The vertical axis defines the time data in calendar days, while the horizontal axis represents the project costs in Million Turkish Liras. Dashed lines represent +/- one standard deviation values for the data sets. Standard deviation ranges have been found to be higher in hospital and industrial building projects compared other groups. This is due to the fact that whilst there are hospital projects with costing approximately 1 million TL, there are also hospital projects costing of 164 million TL in the data set. This situation obviously causes the standard deviation to rise especially in terms of the hospital and industrial projects. The BTC model coefficients for all projects and individual groups are shown in Table 3 and the time-cost curves are shown in Figure 3. There is a strong correlation between the time and cost for all groups with R² values ranging from 0.74 to 0.87. However, the results indicate that social housing projects differentiate from other projects with somewhat lower R² value (0.54). The project durations of these projects do not increase at the same pace when the curve of social housing projects costs are higher than 30 Million TL, adjusted value. This is due to the fact that social housing projects are composed of multiple buildings and the duration is mostly influenced by the building having the longest construction period within the project.
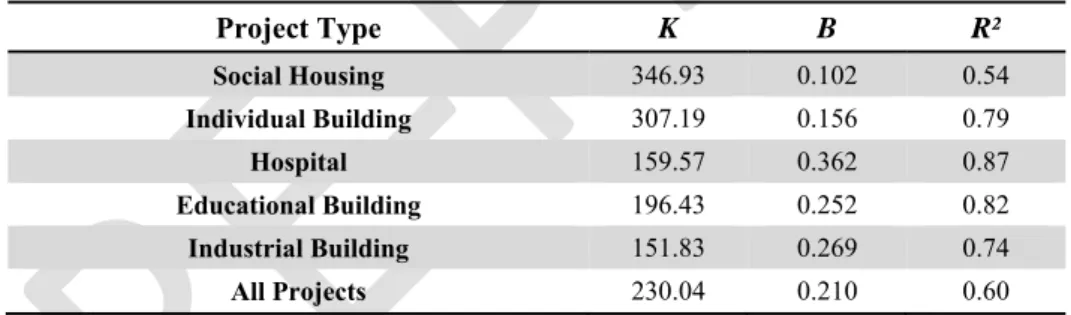
Table 3 - BTC Model Analysis Results According to Project Types (S=460)
Project Type K B R² Social Housing 346.93 0.102 0.54 Individual Building 307.19 0.156 0.79 Hospital 159.57 0.362 0.87 Educational Building 196.43 0.252 0.82 Industrial Building 151.83 0.269 0.74 All Projects 230.04 0.210 0.60
When the projects are analyzed according to their completion times, K coefficients obtained for industrial and hospital projects differ from other projects. However, when B coefficients are examined, it is observed that the hospital projects (B=0.362) have a higher value than industrial projects (B=0.269). As B coefficient is a constant that indicates the sensitivity of
time performance to cost level, it has been concluded that while costs of hospital projects,
with the highest B value, have increased, the construction periods of these projects have increased more than the other project groups. In Figure 3, it has been seen that with the increase in cost, construction times of hospital projects reach approximately1000 calendar days and differentiate from other projects.
The main reason for the decomposition of the hospital projects on the graph is that the cost of hospital projects increases and the construction time tends to increase more rapidly compared to the other groups. Particularly when the data of the hospital projects are examined
in detail, it is seen that the realization period of the projects mostly exceeded the contract period. The curves of the groups are also compared in Figure 4. As can be seen from the figure the hospital projects exhibit a different trend at higher project values compared to the other groups due to their high B coefficient. On the other hand, one of the noteworthy findings obtained in this study is that for the other project groups BTC curves demonstrate a very similar trend.
Figure 4 - BTC Model Curves According to Project Groups
As mentioned earlier Bayram (2017) studied time-cost relationships of public buildings in Turkey. While 82% of his data set consisted of educational buildings, 11% of the data set was hospital projects [3]. The equations obtained for the projects of the educational building (Equation 6), the hospitals (Equation 7) and the equation proposed by Bayram (2017) (Equation 5) can be compared as follows;
𝑇 = 209𝐶 . (5)
𝑇 = 196.43𝐶 . (6)
𝑇 = 159.57𝐶 . (7)
When K coefficients of this study and Bayram’s are compared, Bayram’s coefficient (2017) is higher. When the B coefficients that shows the slope of the curve are examined, the obtained coefficient in the study of Bayram (2017) is B = 0.350 for hospital projects, while the obtained coefficient is B = 0.362 in this study for the same project type. As a result, although coefficient K, obtained from Bayram (2017), is similar to coefficient K for the educational buildings in this study, coefficient B, obtained from Bayram (2017)’s study is similar to coefficient B of hospital projects in this study. It is worth to mention that in Bayram’s (2017) data set is a composition of 530 public projects which mainly consist of educational buildings (432) and hospital projects (56), therefore direct comparison with this study will not yield accurate results, since all the projects are analyzed together [3].
4.2. BTC Model Analysis According to Different Parameters
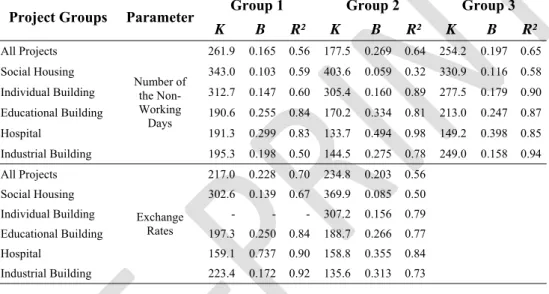
Apart from the groupings made in the previous section, the data was further analyzed for non-working days (3 groups) and Exchange Rate (2 groups). The time-cost relationship analysis results of the BTC model for the five building groups, examined with the non-working days and exchange rate parameters considered are summarized in Table 4 and presented in detail in the following sub-sections.
Table 4 - Results of BTC Model Analysis According to NWD and ER Parameters, (S=460)
Project Groups Parameter Group 1 Group 2 Group 3
K B R² K B R² K B R² All Projects Number of the Non-Working Days 261.9 0.165 0.56 177.5 0.269 0.64 254.2 0.197 0.65 Social Housing 343.0 0.103 0.59 403.6 0.059 0.32 330.9 0.116 0.58 Individual Building 312.7 0.147 0.60 305.4 0.160 0.89 277.5 0.179 0.90 Educational Building 190.6 0.255 0.84 170.2 0.334 0.81 213.0 0.247 0.87 Hospital 191.3 0.299 0.83 133.7 0.494 0.98 149.2 0.398 0.85 Industrial Building 195.3 0.198 0.50 144.5 0.275 0.78 249.0 0.158 0.94 All Projects Exchange Rates 217.0 0.228 0.70 234.8 0.203 0.56 Social Housing 302.6 0.139 0.67 369.9 0.085 0.50 Individual Building - - - 307.2 0.156 0.79 Educational Building 197.3 0.250 0.84 188.7 0.266 0.77 Hospital 159.1 0.737 0.90 158.8 0.355 0.84 Industrial Building 223.4 0.172 0.92 135.6 0.313 0.73
4.2.1. The Effect of Non-Working Days on Time-Cost Relationship of All Projects In construction projects, especially due to adverse weather conditions such as rain, snow and humidity, there can be non-working (NWD) days within the contract period [44]. Thus, the non-working days reflect the climatic characteristics of the geographical zones. The effect of non-working days on time-cost relationship for the projects in the data set were analyzed according to the circular published by the Ministry of Public Works and Settlement on 07/07/1982 and with the number B-01/İh.İş.Mr.Gr.3/99-2/101156-B [41].
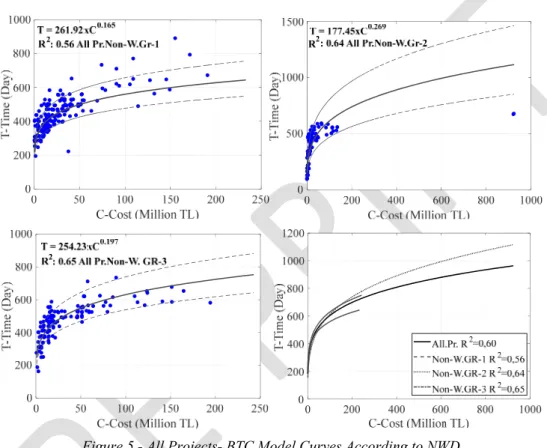
The circular assigned a NWD value for every city as 0, 60, 75, 90, 105, 120, 135, 150 or 165 days. For the purpose of observing regional effect, the number of non-working days has been examined in 3 groups: the cities with 0 and 60 NWD values are in the Group 1, while 75, 90 and 105 NWD values are in Group 2, and the remaining are in Group 3.
The results obtained for each group are shown in Figure 5. One would expect that the projects in Group 3, with the highest NWD, will be realized in the longest time. However, the coefficient B (0.269) obtained for the Group 2 projects is higher than the other groups, which means that the project completion times will be longer with increasing costs in Group 2 projects. The projects in the Group 3 are completed in a longer period than the projects in Group 2 up to the limit of TL 150 Million. However, it is understood that the projects in
Group 2 costing 150 Million TL and more will be completed longer than the projects in the Group 3. It is seen in Figure 5 that the projects in Group 1, which have the least non-working days (0-60 days), are completed in a shorter period than the other groups. Since the coefficient B is lower than the other two groups, it is seen in the related graph that the increasing cost has less effect on the total number of days for the Group 1.
Figure 5 - All Projects- BTC Model Curves According to NWD
4.2.2. The Effect of Non-Working Days on Time-Cost Relationship of Social Housing Projects
Social housing projects were analyzed according to the non-working days and the results obtained are shown graphically in Figure 6.
For the projects in Group 2, the determinant of time-cost relationship (R2 = 0.32) is lower
than the determinant of time-cost relationship (for Group 1 R2 = 0.59 and for Group 3 R2 =
0.58) obtained for the other groups is lower. Additionally, Group 2 has a quite large standard deviation than other groups because of the fact that social housing projects in the Group 2 have time and cost values that are highly diverse from each other as seen in the Figure 5. Social housing projects carried out in the provinces with the highest number of non-working days, are completed in a longer period than in the provinces with the least number of
non-working days (Group 1, 0 and 60 days). However, no significant difference in project completion times was determined for both two social housing project groups. The most important reason for this situation can be interpreted, as social housing projects are very similar in structure and completed with a certain systematic method. In terms of all three groups, projects with the cost of approximately 35 million TL can be completed in about 500 days on average.
Figure 6 - Social Housing Projects - BTC Model Curves According to NWD
4.2.3. The Effect of Non-Working Days on Time-Cost Relationship of Individual Building Projects
The individual building projects were analyzed according to the non-working days and the results obtained are shown in Figure 7. According to results, in the first analysis of the individual building projects without the effect of non-working days, determinant of the time-cost relationship of the BTC model was found R² = 0.79. However, in the analysis with the non-working days parameter, the time-cost relationship for individual building projects in the Groups 2 and 3 (for group 2, R2 = 0.89 and for Group 3, R2 = 0.90) was found to increase.
For the Group 1, the time-cost relationship was found to be lower (R2 = 0.60). When the BTC
to non-working days parameter are examined, it was determined that there is not a significant difference in terms of time-cost relationship. In this context, it can be understood from Figure 7 that the time-cost relationship of the individual building projects carried out by the private sector is not affected by the number of non-working days.
Figure 7 - Individual Building Projects - BTC Model Curves According to NWD
4.2.4. The Effect of Non-Working Days on Time-Cost Relationship of Educational Building Projects
The educational building projects were analyzed according to the non-working days and the results obtained are shown in Figure 8. According to this analysis, the time-cost relationship for all groups was found to be 81% and above. The coefficient B (0.334) of the projects in the Group 2 is higher than those of the other groups as seen in the Figure 8.
In this context, it is understood that if the high-cost educational building projects are built in the second group, the projects will be completed longer than those in the Groups 1 and 3. The projects in the Group 1, which have the least non-working days, received close values for the K (196,43) and B (0,252) coefficients to the coefficients (K = 190,57, b = 0,255) obtained for all educational building projects before grouping. Projects in Group 3 have the highest
determination coefficient (R² = 0.87) which explains the time-cost relationship higher than those of other two groups. However, according to analysis after grouping made according to non-working days, it can be understood that the projects in the Group 1 (0-60 days) can be completed in a shorter period than the other groups.
Figure 8 - Educational Building Projects - BTC Model Curves According to NWD
4.2.5. The Effect of Non-Working Days on Time-Cost Relationship of Hospital Projects The results of the analysis for hospital projects according to the non-working days are shown in Figure 9. According to results, the determination coefficient levels of BTC models (Group 1 R² = 0.83; Group 2 R²=0.98; Group 3 R²=0.85) obtained from analysis after grouping, are similar to the coefficient (R²=0.87) for hospital projects before grouping according to non-working days. It can be understood from Figure 9 that the projects in the Group 1 can be completed in a shorter time than the projects in the Group 3.
In this context, in the case of hospital projects, it is understood that as long as the number of non-working days increases, the average completion times of the projects increases. On the other hand, the time-cost relationship level (98%) of the projects in the second group is obtained significantly higher than the other groups. However, it is important to note that the number of projects in this group was limited to four projects, which in turn may not yield accurate results.
Figure 9. Hospital Projects - BTC Model Curves According to NWD
4.2.6. The Effect of Non-Working Days on Time-Cost Relationship of Industrial Building Projects
Figure 10 - Industrial Building Projects - BTC Model Curves According to NWD (continue)
The analysis results for the industrial building projects according to the non-working days parameter are shown in Figure 10. Accordingly, strong time-cost relationship was identified in all projects except the projects in the Group 1. The BTC model curves of the industrial projects in Group 2 and 3 seem to be similar. However, the projects in the Group 1 are separated in the graph with their longer construction time. In this context, for industrial building projects, it is seen that as the number of non-working days increases, the completion time of the projects seems to increase.
4.2.7. The Effect of Exchange Rates on Time-Cost Relationship of All Projects
The results of the analysis obtained for all the projects after the grouping according to the exchange rates parameter are shown in Figure 11. According to these results, the time-cost relationship level of projects carried out in the period 2003-2010, when the exchange rates were more stable, is determined as R² = 0.70, on the other hand, in the period 2010-2018,
Figure 11 - All Projects - BTC Model Curves According to Exchange Rates (continue)
when the exchange rates were in an increasing trend, R² is determined as 0.56. This shows that time-cost relationship of projects in the first period can be explained stronger than in the second. However, when the effect of the exchange rates parameter is examined in terms of project completion times, it can be seen that the projects are completed in a shorter period in the period of 2010-2018. Especially, in case of the project costs higher than 50 million TL, it is observed that the construction durations of the projects during the period between years 2010-2018 are less than those in the projects carried out in the previous period.
4.2.8. The Effect of Exchange Rates on Time-Cost Relationship of Social Housing Projects The results obtained for social housing projects after the grouping according to the exchange rates parameter are shown in Figure 12. The level of the time cost relationship for the projects carried out in the period 2003-2010 is R² = 0.67, while it is R² = 0.50 for the period 2010-2018. Projects in Group 1, up to the limit of 40 Million TL cost, can be completed in a shorter time than the other groups, while projects in the Group 2 can be completed in a shorter time when the costs exceed 40 Million TL.
Figure 12 - Social Housing Projects - BTC Model Curves According to Exchange Rates (continue)
4.2.9. The Effect of Exchange Rates on Time-Cost Relationship of Educational Building Projects
Figure 13 - Educational Building Projects - BTC Model Curves According to Ex. Rates
The time-cost relationship of educational building projects under the exchange rate effect has been examined and the analysis results are shown in Figure 13. Accordingly, it seems that the BTC model explains the time-cost relationship in both two periods. As seen in the graphics, the time-cost relationship level of the educational building projects realized in the period of 2003-2010 are at a higher level than that of the projects of 2010-2018 period. It can
also be concluded that the educational building projects carried out in the period of 2003-2010 were completed in a shorter period than the educational building projects built between 2010 and 2018.
4.2.10. The Effect of Exchange Rates on Time-Cost Relationship of Hospital Projects The time cost relationship of hospital projects under the exchange rate effect has shown in Figure 14 as a result of the analysis. The projects in both groups, which are formed according to the exchange rate parameters, did not show any distinction until the cost of approximately of 25 Million TL. However, it can be understood from Figure 14 that the projects, with the cost of over 25 Million TL, can be completed in a shorter period from 2010 to 2018 than in the first period. As a result of this analysis, the higher R2 values obtained for both periods
show that the time-cost relationship level is higher.
Figure 14 - Hospital Projects - BTC Model Curves According to Exchange Rates
4.2.11. The Effect of Exchange Rates on Time-Cost Relationship of Industrial Building Projects
The time-cost relationship of the industrial building projects, under the exchange rate effect, has been examined and the analysis results are shown in Figure 15. Industrial building projects in Group 1 have a more significant time-cost relationship like in the other type of
projects when compared to projects built in 2010-2018 period. However, unlike other building groups, industrial projects are completed in a shorter period in the period when foreign exchange is stable (2003-2010). On the other hand, in the period of 2010-2018 when the foreign exchange is in a rising trend, the industrial projects can be completed considerably longer. Companies that are operating in the industrial sector in our country are also vulnerable to exchange rates, and this situation may lead to a deterioration of the payment balance of infrastructure investments [45]. On the other hand, the construction cost of the industrial building projects are basically a function of the main construction materials used, namely reinforcing steel, structural steel and concrete [46]. Whereas, the prices of these materials are all indexed to the exchange rates.
Figure 14 - Industrial Building Projects - BTC Model Curves According to Exchange Rates
4.2.12. The Effect of Exchange Rates on Time-Cost Relationship of Individual Building Projects
The grouping with the foreign exchange parameter could not be applied for individual building projects group since the data of the building projects are distributed only between the years 2010-2018. In this context, there could be no possibility of comparison between two periods in order to reveal the effect of exchange rates on the time-cost relationship of these projects.
5. DISCUSSION
The effects of the number of non-working days and exchange rate parameters on time-cost relationship of the Project groups are summarized in Table 4. As a result of the analysis carried out according to non-working days, the time-cost relationship levels in all groups for all other projects except social housing projects are significantly explained in the 59-98% range. On the other hand, in the period of 2010-2018, it is seen that the level of explanation of time-cost relationship of the BTC Model is lower than in the period of 2003-2010 due to the increase of the exchange rates against Turkish Lira. In this context, it has been determined that the time-cost relationship is also influenced by the fluctuation of the exchange rate, since this fluctuation affects project costs.
The fact that the time-cost relation between the periods of 2003-2010, when the foreign exchange is stable, is higher compared to the period 2010-2018 when the foreign exchange is fluctuating shows the effect of the exchange rates on the Turkish Construction Sector. The reason for this is the fact that the equipment used in the construction sector and some of the raw materials are imported with using foreign currencies [41]. Similarly, it is understood that the number of non-working days is an important factor affecting the time-cost relationship. The higher the tender prices affect hospital projects at the highest level in terms of duration. As the project cost increase for these building groups, the delivery time is also increasing remarkably. On the other hand, social housing projects with the cost of 50 million TL and above, are seen to have a shorter period of completion than the other building groups. Despite the high tender prices in this type of construction projects, delivery times are not affected at the same time. When compared to other building groups, the BTC model has the lowest level of determination (R² = 0.56) for the time-cost relationship for social housing projects. However, it has been found that the level of time-cost relationship in the projects built by the private sector is higher than that of the projects built by TOKİ (Public). It is found that the time-cost relationship for this study varies for both the public and private sectors, according to the results the performance of private projects is better than the public in this study as Le-Hoai et al. (2009) [34] revealed the same conclusion in their respective study. Some of the reasons for the low performance of public projects may be change orders to the projects, such as concept changes, design problems, and other unidentified causes as Albalushi et al. (2013) mentioned in his study [47]. According to Kaka and Price (1991), the reason for the lower performance of public projects than the private projects is the high level of the interest and concern of the private sector customers on the time and the cost of the projects [12]. This is a very critical and sensitive issue for investors to have the projects start the operation phase within the planned budget as soon as possible. The results of this study also support the results of Kaka and Price (1991).
The effects of the non-working days on the time-cost relationship is analyzed in this study and it has been revealed that the completion times of the projects are shorter in the cases where the non-working days are the lowest (Group 1, 0-60 days). On the other hand, no remarkable effect of non-working days was observed on the time-cost relationship of the private sector building projects. The results of the analysis have revealed that the industrial projects were directly affected by the exchange rate fluctuation (Figure 15). Projects built between 2010 and 2018, except the industrial building projects, were completed in a shorter period than projects between 2003 and 2010. On the other hand, it is understood from this study that BTC model reveals the time-cost relationship for all project groups at a very high
level between 2003 and 2010. The fact that BTC model explains time-cost relationship in the period with stable Exchange rates better than the in the period with increasing Exchange rates, indicates that the sector is affected by the exchange rate fluctuations
6. CONCLUSION
In this study, the time-cost relationship of the building projects realized in Turkey was investigated based on the Bromilow’s time-cost prediction model. The data set used was comprised of 460 projects intended for different uses at climatic regions of the country. The time-cost relationship curves of each group, as well as all the projects as a group, were determined taking into consideration the changes in the exchange rate and the number of non-working days (namely the climatic effects). Subsequently, it is concluded that the consideration of the number of non-working days and the exchange rates can have strong impact on the time –cost relationship. Also, the curves can be refined further by using larger data sets.
References
[1] Barrie, D. S., & Paulson, B. C., Professional construction management: including CM, design-construct, and general contracting. McGraw-Hill Science/Engineering/Math. 1992.
[2] Bromilow, F. J., Contract Time Performance Expectations and the Reality. Building Forum, 1, 70-80, 1969.
[3] Bayram, S.. Duration prediction models for construction projects: In terms of cost or physical characteristics?. KSCE Journal of Civil Engineering, 2017, 21.6: 2049-2060. [4] Petruseva, S., Pusic, D. C., & Pancovska, V. Z. Model for Predicting Construction Time
by Using General Regression Neural Network. International Scientific Conference People, Buildings and Environment 2016 (PBE2016) 29 September – 1 October, 2016, Luhacovice, Czech Republic, 2016.
[5] Bayram, S. & Al-Jibouri, S. Reference Class Forecasting Method in Predicting Construction Project Duration. Süleyman Demirel University Journal of Natural and Applied Sciences, 22 (3), pp.1132-1142, 2018
[6] Ariful Haque, K.M., & Hasin, M.A.A. Genetic algorithm for project time-cost optimization in fuzzy environment. Journal of Industrial Engineering and Management, 5(2), pp.364-381, 2012.
[7] Odabaşı, E., Models for Estimating Construction Duration: An Application for Selected Buildings on the METU Campus. Ankara: Ortadoğu Teknik Üniversitesi Uygulamalı Bilimler Enstitüsü, 2009.
[8] Love, P. E. D., Tse, R. Y. C., & Edwards, D. J., Time-cost relationships in Australian building construction projects. Journal of Construction Engineering and Management (ASCE), Vol. 131, No. 2, pp. 187-194, 2005.
[9] Ireland, V., The Role of Managerial Actions in the Cost Time and Quality Performance of High-Rise Commercial Building Projects. Construction Management and Economics, 3(1), 59-87, 1985.
[10] Choudhury, I. & Rajan, S. S. Time-Cost Relationship for Residential Construction in Texas. CIB, 2003.
[11] Ng, S., Mak, M., Skitmore, R. & Varnam, M. The Predictive Ability of Bromilow’s Time-Cost Model. Construction Management and Economics, 19(2), 165-173, 2001. [12] Kaka, A., & Price, A. D., Relationship between value and duration of construction
projects. Construction Management and Economics, 9(4), 383-400, 1991.
[13] Kumaraswamy, M., Chan, D., Determinants of Construction Duration Construction Management and Economics, 13(3), 209-217, 1995.
[14] Hoffman, G. J., Thal Jr., A. E., Webb, T. S. & Weir, J. D., Estimating Performance Time for Construction Projects. 23, 193-199, 2006.
[15] Chan, A., Time-Cost Relationship of public sector projects in Malaysia. International Journal of Project Management, 19, 223-229, 1999.
[16] Endut I.R., Akintoye, A. & Kelly, J., Relationship Between Duration and Cost of Malaysian Construction projects”, Proceedings of the International Conference in the Built Environment in the 21st Century, Kuala Lumpur (ICiBE). 2006.
[17] Ogunsemi, D. R. & Jagboro, G. O., Time-Cost Model for Building Projects in Nigeria. Construction Management and Economics, 253-258(3), 2006.
[18] Ojo, G., A Study of the Relationship Between Contract Period and Tender Sum of Construction Projects in South-Western Nigeria. M.Sc. Thesis, Obafemi Awolowo University, Ile-Ife. 2001.
[19] Bromilow, F.J. & Henderson, J.A., Procedures for reckoning and valuing the performance of building contracts. The Chartered Builder, 10(9), 57. 1976.
[20] Yeong, C., Time and Cost Performance of Building Contracts in Australia And Malaysia. University of South Australia. M.Sc. Thesis, University of South Australia School of Building and Planning, 1994.
[21] Mizanur, R. M., Dai, L. Y., Khanh, H. D. & Hyun, C. Y., Development of Time-Cost Models for Building Construction Projects in Bangladesh. 3 (4, Issue 3,). Korea: Korean Institute of Construction Engineering and Management, 2014.
[22] Zujo, V. & Pusic, D. C., Application of "Time-cost" Model in Construction Project Management. Abstracts of the 8th International Conference Organization, Technology and Management in Construction and 5th SENET Conference (s. 1-7). Umag, Hrvatska, 2008.
[23] Petruseva, S., Zujo, V. & Pancovska, V. Z. Neural Network Prediction Model for Construction Project Duration. International Journal of Engineering Research & Technology (IJERT), 2(11), 1646-1654. 2013.
[24] Sun, C., Xu, J., Estimation of Time for Wenchuan Earthquake Reconstruction in China. Journal of Construction Engineering and Management, 137(3), 179-187, 2010. [25] Sriana, T. & Hayati, K., Time-Cost Relationship Model on the Construction of
Education Building in Aceh Province. Journal of Asian Scientific Research, 5(7), 328-339, 2015.
[26] Ameyaw, C., Mensah, S. & Diss, Y. Applicability of Bromilow's Time-Cost Model on Building Projects in Ghana. 4th West Africa Built Environment Research (Waber) Conference, Abuja, Nigeria, 24-26, 2012.
[27] Le, Long, L.-H. Y., Bromilow’s Time-Cost Equation for Building Projects in Korea. Korean Society of Civil Engineers, (7) 812-815, 2009.
[28] Choudhury, I. Time-Cost Relationship for Infrastructure Projects in India. (s.14.1270.1). American Society for Engineering Education, 2009.
[29] Car-Pušić, D. & Radujković, M., Model for Proposed Construction Time for Transportation Facilities. Suvremeni Promet, 30(1/2), 127-130, 2010.
[30] Jarkas, A. M., Predicting Contract Duration For Building Construction: Is Bromilow’s Time-Cost Model a Panacea?, 1 (32). Safat, Kuwait: Journal of Management in Engineering, 2016.
[31] Waziri, B. & Nurudeen, Y. Application of Bromilow's Time-Cost (BTC) Model to Highway Projects in Nigeria. Arid Zone Journal of Engineering, Technology and Environment, 10, 1-11, 2014.
[32] Mačková, D. & Bašková R., Applicability of Bromilow´s Time-cost Model for Residential Projects in Slovakia, SSP - Journal of Civil Engineering Vol. 9, Issue 2,5-12, 2014.
[33] Özçekiç, A. F., Türk Yüklenicilerin Uluslararası Teklif Aşamasında Kullanabileceği Bir Süre Maliyet Modeli, Yüksek Lisans Tezi, İstanbul Teknik Üniversitesi Fen Bilimleri Enst. Bilim ve Teknoloji Enstitüsü., İstanbul, 2007.
[34] Le-Hoai, L., & Dai Lee, Y. Time-cost relationships of building construction project in Korea. Facilities, 27 (13/14), 549-559, 2009.
[35] Okere, G. An Evaluation of a Predictive Conceptual Method for Contract Time Determination on Highway Projects Based on Project Types. International Journal of Civil Engineering, pp.1-17, 2018.
[36] Adeyemi, A. Y., & Masalila, K. Delay factors and time-cost performance of construction projects in Gaborone City Council, Botswana. Journal for the Advancement of Performance Information & Value, 8(1), 1-18, 2016.
[37] ISO 4217, obtained from https://www.currency-iso.org/en/home.html. web address on 03.03.2018.
[38] Martin, J., Burrows, T. K. & Pegg, I. Predicting Construction Duration of Building Projects. XXIII FIG Congress. Munich, Germany, 2006.
[40] Kenley, R., Financing Construction: Cash flows and cash farming. Routledge. 2003. [41] Kılıç, E., & Yıldırım, K., Sektörel reel döviz kuru volatilitesinin Türk imalat sanayi
ihracatı üzerine etkileri. Anadolu Üniversitesi Sosyal Bilimler Dergisi, 15(1), pp.13-25, 2015.
[42] TCMB (Central Bank of the Republic of Turkey) Foreign currency information,
according to periods, is obtained from
https://evds2.tcmb.gov.tr/index.php?/evds/seriemarket web address on 03.03.2018. [43] Ministry of Environment and Urbanization. Circular issued on 07/07/1982 and
numbered B-01 / İh.ş.Mr.Gr.3 / 99-2 / 101156-B, 1982
[44] Thorpe, D., & Karan, E. P., Method for calculating schedule delay considering weather conditions. In Proceedings of the 24th annual conference of the Association of Researchers in Construction Management (ARCOM 2008) (Vol. 2, pp. 809-818). Association of Researchers in Construction Management (ARCOM). 2008.
[45] TOBB, (2011). Türkiye İnşaat Malzemeleri Sektör Görünüm Raporu, 2011.
[46] Dikmen, S. Ü., & Özek, S. Deprem bölgelerinde zemin sınıfının sanayi yapılarının maliyetine etkisi. İMO Teknik Dergi, 22 (108), 5543-5558, pp.2011.
[47] Albalushi, I., Usman, F., & Alnuaimi, A. S., Construction Cost Overrun and Variations: Investigation on its Causes and Consequences. Australian Journal of Basic and Applied Sciences, 7(14), 311-323, 2013.
![Figure 1 - Bromilow’s original data set (1969) [1]](https://thumb-eu.123doks.com/thumbv2/9libnet/3724725.25765/3.892.149.672.505.856/figure-bromilow-s-original-data-set.webp)
![Table 1 - Equations obtained by other researchers with the Bromilow BTC Model (adapted from Kenley (2003) [40])](https://thumb-eu.123doks.com/thumbv2/9libnet/3724725.25765/4.892.158.724.418.1022/table-equations-obtained-researchers-bromilow-model-adapted-kenley.webp)
![Table 1 - Equations obtained by other researchers with the Bromilow BTC Model (adapted from Kenley (2003) [40])](https://thumb-eu.123doks.com/thumbv2/9libnet/3724725.25765/5.892.172.721.268.604/table-equations-obtained-researchers-bromilow-model-adapted-kenley.webp)