© 2020 Indian Journal of Ophthalmology | Published by Wolters Kluwer - Medknow
Original Article
Comparison of structural and functional tests in primary open angle glaucoma
Umut Karaca, Ozan Dagli
1, Gokhan Ozge
2, Tarkan Mumcuoglu
3, Atilla Bayer
4Access this article online Website: www.ijo.in DOI: 10.4103/ijo.IJO_921_19 PMID: *****
Quick Response Code: Purpose: To comparatively analyze the structural and functional tests used in the diagnosis and follow‑up
of glaucoma. Methods: Eighty eyes of 40 patients with primary open angle glaucoma (POAG) and 46 eyes of 23 healthy individuals were included in the study. Transient pattern electroretinography (PERG), steady‑state PERG (ssPERG), computerized visual field (VF) screening, and examination of retinal nerve fiber layer (RNFL) and macular thickness on optical coherence tomography (OCT) were undertaken. The results were compared between the groups. Results: 80 eyes belonging to 40 patients with a diagnosis of POAG (23 female, 17 male) (18 mild 22 moderate POAG) with a mean of 57.37 (±8.6) years, and 46 eyes of 23 healthy individuals (14 female, 9 male) with a mean age of 55.30 (±8.09) years were included in the study. PERG P50 and N95 and ssPERG latency revealed a significant delay in the POAG group. When the wave amplitudes were examined, they were found to be significantly lower in both PERG and sSPERG tests for the POAG group, but the results were more pronounced in ssPERG. The latency values of PERG and ssPERG tests were not significantly correlated with any of the parameters of the remaining tests. However, the amplitude values of these tests had a positive correlation with the mean deviation value and negative correlation with the pattern standard deviation value of VF. All associated parameters were significant for the amplitude value of the ssPERG test. Conclusion: For the proper management of glaucoma, rather than approaching damage simply as the loss of retinal ganglion cells or the neuroretinal rim, it is necessary to focus on the ongoing anatomical and functional relationship and evaluate structural and functional tests together. In addition, ssPERG test, which is not widely adopted in routine practice, provides valuable information and is significantly correlated with OCT parameters.
Key words: Electroretinography, optical coherence tomography, primary open angle glaucoma, visual field
Isparta Suleyman Demirel University Faculty of Medicine Department of Ophthalmology Isparta, 1Katip Celebi University Department of Ophthalmology Izmir, 2University of Medical Sciences, Gulhane Education and Research Hospital, Department of Ophthalmology, Ankara, 3TOBB ETU University Faculty of Medicine Department of Ophthalmology Ankara, 4DünyaGöz Hospitals Group Ankara/Turkey Correspondence to: Dr. Umut Karaca, Suleyman Demirel Univercity Faculty of Medicine Department of Ophthalmology Isparta/Turkey. E‑mail: [email protected]
Received: 18‑May‑2019 Revision: 12‑Sep‑2019 Accepted: 27‑Oct‑2019 Published: 20‑Apr‑2020
Glaucoma is defined as a progressive chronic optic neuropathy that causes atrophy of the optic nerve head, retinal ganglion cell (RGC) damage, and distinctive visual field losses. These changes are usually accompanied by elevated intraocular pressure (IOP). Although the major risk factor in glaucoma is increased IOP values, it has been suggested that glaucoma is a multifactorial disease since glaucomatous changes in the optic nerve head and progressive visual field defects are also
detected in eyes with normal tension.[1,2]
Today, there is an ongoing search for non‑invasive, practical and objective diagnostic methods for the early diagnosis of glaucoma. One of these diagnostic methods are electrophysiological tests that provide the clinician with very important information via the measurement of electrical activity in the visual pathways from the retina plane to the cortex. There is extensive research on the use of electrophysiological tests in the diagnosis of glaucoma as well as pioneering studies involving case series. Nevertheless, electrophysiological tests have not yet achieved their well‑deserved place in routine
practice. In addition to automated visual field (VF) screening, which is used as the gold standard for the determination of the presence of glaucoma, tests that allow for the structural examination of the optic nerve head and retinal nerve fiber
layer are generally preferred.[3,4]
In this study, we aimed to compare the results obtained from functional tests transient pattern electroretinography (PERG) and steady‑state PERG (ssPERG), functional but subjective test VF, and optic coherence test (OCT), which structurally evaluates the optic nerve head and retina, in healthy individuals and primary open angle glaucoma (POAG) cases and to determine the sensitivity and selectivity of glaucoma of these tests by identifying the test parameters that significantly differed between the two groups.
Methods
The study was conducted with patients that were followed up with a diagnosis of POAG and fulfilled the inclusion criteria, and healthy individuals that satisfied the control group criteria between January 2008 and September 2009 in the Department
Cite this article as: Karaca U, Dagli O, Ozge G, Mumcuoglu T, Bayer A. Comparison of structural and functional tests in primary open angle glaucoma. Indian J Ophthalmol 2020;68:805-11.
This is an open access journal, and articles are distributed under the terms of the Creative Commons Attribution‑NonCommercial‑ShareAlike 4.0 License, which allows others to remix, tweak, and build upon the work non‑commercially, as long as appropriate credit is given and the new creations are licensed under the identical terms.
of Ophthalmology, Glaucoma Division of our University. Prior to the study, the approval of Local Ethics Committee was obtained, and the participants were informed about the study and provided their informed consent, which was conducted in accordance with the tenets of the Helsinki Declaration.
The inclusion criteria for the POAG group were as follows: being diagnosed with POAG, being aged 40 to 70 years, having a mild to moderate glaucomatous visual field defect according to the Hodapp‑Anderson‑Parrish (HAP) grading system, presence of typical glaucomatous optic disc changes consistent with a visual field defect, no history of eye surgery, no pupillary anomaly, and no refractive error based on the spherical equivalent of greater than ±3.0 diopters.
The control group comprised individuals aged 40 to 70 years, having no glaucomatous visual field defect according to HAP, healthy optic disc appearance, no systemic or ophthalmologic disease, no history of eye surgery, an IOP of 21 mm Hg or below, no pupillary anomaly, and no refractive error based on the spherical equivalent of greater than ±3.0 diopters. The participants who were not able to comply with the tests or had a high level of artifacts despite repeated tests, as well as those that wanted to withdraw from the study were excluded.
VF, OCT (RNFL and macular thickness measurements) and PERG and ssPERG tests were applied to both groups. The mean deviation (MD) and pattern standard deviation (PSD) values, the Glaucoma Hemifield Test (GHT) classification (normal, borderline, abnormal), PERG N35, P50 and N95 wave latencies and N35‑P50, P50‑N95 amplitudes, and ssPERG wave and amplitude were recorded. 5 values for the RNFL thickness examination performed with OCT (temporal, superior, nasal and inferior quadrants of the optic nerve head and their average) and nine values for macular thickness (central 1 mm area, the temporal, superior, nasal and inferior quadrants of the central 3 mm ring, the temporal, superior, nasal and inferior quadrants of the central 6 mm ring) were obtained. The average of the data obtained from all these tests were compared between the 2 groups. For the parameters that were found significant, the sensitivity, selectivity and areas under the receiver operating characteristic (ROC) curve for glaucoma were calculated. In addition, the correlations between PERG and ssPERG parameters and the parameters of other tests were explored.
For all participants, the order of procedures was as follows: PERG and ssPERG, visual field, and OCT. Due to the length of the procedures, PERG and ssPERG tests were performed in the morning, and VF and OCT in the afternoon.
Due to the possible differences in the electrophysiological test measurements performed at different times of the day, the study and control group test measurements were undertaken at similar hours. Furthermore, care was taken to ensure that the ages of the participants in the study and control groups were similar. Again, taking into account studies that advocate the effect of gender on electrophysiological measurements, we gender‑matched participants in both groups.
VF
In the evaluation of the visual field, we used the 24‑2 threshold program (stimulus: White White, background: 31.5 asb, strategy: SITA‑FAST) of the Humphrey 750i VF device
(Carl Zeiss Ophthalmic System, Humphrey Division, Dublin,
California USA). Near vision corrections of the participants were
applied using perimeter software according to the age of the individuals. As the reliability criteria, 20% was used for fixation loss, false positive response, and false negative response. The MD and PSD values and GHT classification were evaluated. The results of VF were classified according to the HAP system.
PERG and ssPERG
PERG and ssPERG were performed in accordance with ISCEV 2007 standards using Roland‑Consult RETIPORT (Germany). The responses were recorded with reference electrodes placed 2 cm from the outer canthus with conductive gel, earth electrodes in the middle of the forehead, and
Dawson‑Trick‑Litzkow (DTL)‑type electrodes in the lower
fornixes of both eyes. No topical anesthetic was used during this procedure. Stimulation was displayed as reversing black and white checkerboard patterns with a red central fixation point (lighting 255 cd/m², contrast 99%, pattern change 3 Hz for PERG and 8 Hz for ssPERG, pattern size 1˚) on a 20” CRT monitor (40 cm wide, 30 cm long) (Sony Multiscan G520TM, Japan).
The pupils did not expand during binocular scanning (3‑4 mm). The refraction error was corrected before the procedure. Raw images at 1‑100 Hz (artifact level 5%) were converted to evaluable data by passing them through the band‑pass filter. Imaging was performed at a distance of 1 m from the screen (viewing angle 5.7˚ vertical, 8.5˚ horizontal). The evaluation was based on N35, P50, and N95 wave latencies (ms) and N35‑P50 and P50‑N95 amplitudes (µV) for transient PERG and the latency (ms) and amplitude (µV) of the first positive wave for ssPERG.
OCT
The OCT test was performed using a Carl Zeiss Model 3000 system (Carl Zeiss Meditec Inc. Dublin CA, USA). All patients were informed about the procedure to adapt to the test. During the test, a 0.5% tropicamide drop (0.5% Tropamid, 5 ml drop, Bilim Pharmaceuticals) was applied to the eyes which were considered to have an insufficient pupil diameter. In all cases, RNFL (fast RNFL analysis) and macular thickness measurements were performed. The imaging quality was adjusted using the ‘optimized’ mode. A check was undertaken to determine whether the device correctly detected the limits of the RNFL and optic nerve head structures, and if not, the imaging procedure was repeated. Only images with a quality of 8 or above were included in further analysis. After scanning and selecting appropriate sections, the values were recorded in microns.
Statistical analysis
SPSS package program v. 15.0 (SPSS Inc., Chicago, IL, USA) was used for the data analysis. In the presentation of descriptive statistics, the mean and standard deviation (mean ± ss) values were used. An independent samples t‑test was employed for the comparisons between the two groups for all parameters except gender. The gender‑related comparison was undertaken by a Chi‑square test. The relationships between the parameters were investigated by the Pearson correlation. To determine the predictive power of the clinical measurements for glaucoma diagnosis, the ROC curve was generated based on the sensitivity and specificity of each test, and AUC was calculated and compared to identify the test parameter that
most accurately predicted the presence of glaucoma in the POAG group. The best cut off point for each clinical indicator and the sensitivity and selectivity values for this point were obtained. The probability level was chosen as 0.05, and P values equal to or lower than this level were interpreted to indicate statistically significant difference.
Results
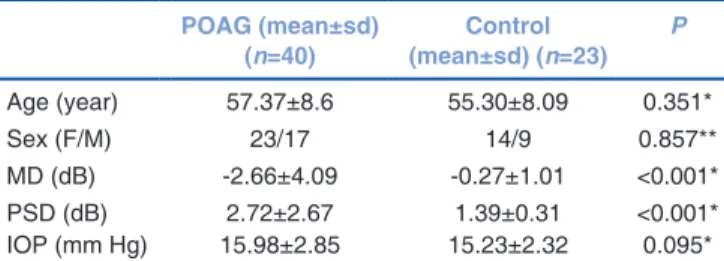
80 eyes belonging to 40 patients with a diagnosis of POAG (23 female, 17 male) (18 mild 22 moderate POAG) with a mean of 57.37 (±8.6) years, and 46 eyes of 23 healthy individuals (14 female, 9 male) with a mean age of 55.30 (±8.09) years were included in the study. There was no statistically significant difference between the POAG and control groups in terms of age, gender, refraction error, or IOP values. However, the MD and PSD of visual field significantly differed between the two groups [Table 1]. Also, there was no statistically significant difference between the mild and moderate POAG patients. 8 participants who were not able to comply with the tests or had a high level of artifacts despite repeated tests as well as those that wanted to withdraw from the study were excluded.
The mean and standard deviation values of the latency and amplitudes of PERG and ssPERG tests were compared between the POAG and control groups [Table 2]. There was no significant difference in PERG N35 latency between the two groups. In PERG P50, N95 and ssPERG latencies, a significant delay was determined for both tests in the POAG group. Furthermore, the wave amplitudes in the POAG group were found to be significantly lower for both tests, and even more
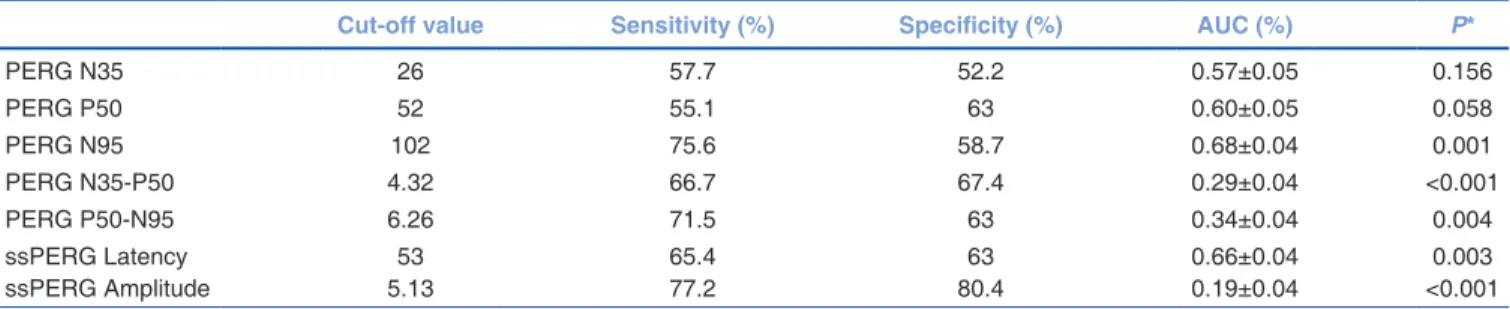
prominent in ssPERG. Along with the sensitivity and selectivity of the parameters of both tests, ROC AUC was examined [Table 3 and Fig. 1]. In addition, the relationship of PERG and ssPERG with other tests used for the diagnosis and follow‑up of glaucoma, namely VF and OCT, were also evaluated.
Among all parameters examined, PERG N95 latency (for the cut‑off value of 102), PERG N35‑P50 (cut‑off value of 4.32), and ssPERG amplitude (cut‑off value 5.13) were found to have the most significant sensitivity and selectivity values for glaucoma diagnosis (p ≤ 0.001). The widest ROC AUC belonged to the ssPERG amplitude (0.810).
The correlation of PERG and ssPERG tests with the MD and PSD values of VF was examined [Table 4]. None of the latency values obtained from both tests were correlated with the VF parameters. However, the amplitudes of both PERG and ssPERG were correlated positively with MD and negatively with PSD. This correlation was stronger for the ssPERG amplitude, and the most prominent of all results was the correlation of the ssPERG amplitude with MD (r: 0.507,
P < 0.001).
The correlation of PERG and ssPERG tests with the temporal, superior, nasal and inferior quadrants and the mean RNFL thickness measured by OCT was analyzed [Table 4]. There was no significant correlation between the latency values of both tests and OCT parameters. The PERG N35‑P50 and P50‑N95 amplitudes were correlated with all OCT values except RNFL thickness in the temporal quadrant (P < 0.001). Compared to the PERG amplitudes, the ssPERG amplitude was more strongly correlated with the mean RNFL thickness and all quadrants except the temporal quadrant, for which the correlation was mild. The correlation between the ssPERG amplitude and OCT was also stronger than that of the PERG N35‑P50 and P50‑N95 amplitudes. The overall results showed that the ssPERG amplitude had a very strong correlation with the mean RNFL thickness (r = 0.75, P < 0.001). This suggested that ssPERG was more effective in functional demonstration of structural losses.
The correlation of PERG and ssPERG tests with the macular thickness measured from the temporal, superior, nasal and inferior quadrants in the central 1 mm, 3 mm and 6 mm of the OCT macular map was examined [Table 5]. There was a poor correlation between the latency values of both tests and
Table 1: Demographic characteristics of the two groups POAG (mean±sd) (n=40) (mean±sd) (n=23)Control P Age (year) 57.37±8.6 55.30±8.09 0.351* Sex (F/M) 23/17 14/9 0.857** MD (dB) ‑2.66±4.09 ‑0.27±1.01 <0.001* PSD (dB) 2.72±2.67 1.39±0.31 <0.001* IOP (mm Hg) 15.98±2.85 15.23±2.32 0.095* *Independent samples t‑test, **Chi‑square test. POAG: Primary Open Angle
Glaucoma, sd: Standard deviation, MD: Mean Deviation, PSD: Pattern Standard Deviation, IOP: Intraocular pressure, dB: Decibel
Table 2: The amplitude and latency parameters of PERG and ssPERG for the POAG and control groups
POAG (mean±sd) (n=40) Control (mean±sd) (n=23) P PERG N35 (ms) 28.08±5.11 26.84±3.04 0.137 PERG P50 (ms) 54.06±6.01 51.93±3.17 0.028 PERG N95 (ms) 107.51±10.03 101.82±8.44 0.002 PERG N35‑P50 (µV) 3.75±1.43 4.48±0.59 0.001 PERG P50‑N95 (µV) 5.62±1.89 6.35±1.24 0.022 ssPERG Latency (ms) 55.65±6.06 52.52±4.27 0.003 ssPERG Amplitude (µV) 3.95±1.50 5.54±0.91 <0.001 POAG: Primary Open Angle Glaucoma, sd: Standard deviation, ms: Millisecond,
all values obtained from the OCT macular thickness map (r < 0.250). No significant relationship was observed between the amplitude values of the two tests and the central 1 mm area. However, a significant relationship was found with the remaining thicknesses, and this was more pronounced in the 6 mm area. The two tests also had a fair correlation with the 3 mm ring, and the inferior, superior and particularly nasal quadrants of the central and 6‑mm ring. The ssPERG amplitude had the highest correlation among all PERG and ssPERG parameters. These positive correlations suggest that both PERG and ssPERG can better identify structural changes in the retina as the distance from the central of the macula is increased.
Discussion
Glaucoma, a chronic optic neuropathy presenting with progressive atrophy and RGC damage at the optic nerve
head, is the second most common cause of blindness.[5] For the
diagnosis of glaucoma, it is necessary to assess visual field and neuroretinal rim losses in the optic disc, and the relationship between visual function and ganglion cell loss should also be well known to determine the stage and prognosis of the disease.
In glaucoma and ocular hypertension (OHT) studies conducted with transient PERG, amplitude reduction has always been more at the forefront compared to latency
delay.[6,7] Although researchers agree that amplitude is reduced
in glaucoma cases, there is no such consensus about the changes in latency. Berninger and Arden suggested that the
PERG latencies are stable and rarely affected by diseases.[8]
In contrast, there are reports of delayed latency in patients
with glaucoma.[9‑11] In the current study, using 1˚ pattern size
and 3 and 8 Hz alternating pattern for PERG and ssPERG, respectively, we found a significant delay in the PERG P50 and N95 latencies and the ssPERG latency. However, there was no significant change in the PERG N35 wave latency. This may be related to the recording parameters, such as electrode type, electrode mounting and stimulation values as well as the type and depth of damage in our glaucoma cases. In addition, some studies have shown a decrease in latencies and amplitudes with
increasing age in healthy cases.[12‑14] Thus, we paid attention to
matching the mean age of the participants for the POAG and control groups.
In glaucoma cases, PERG amplitudes show a decreasing
tendency in line with the increase in the level of damage.[15,16]
After the first publication on PERG by May et al. in 1982,[17] there
has been a growing interest in this topic. In a study conducted by Trick, when flash‑elicited electroretinograms were used in
glaucoma cases, the depression in wave amplitudes reached the
highest level.[18] In the years following this publication, there
was an increase in the number of studies showing that ssPERG responses were more useful in the treatment of glaucoma, and as a results, ssPERG has become the preferred method
in recent studies.[19,20] One of the latest studies concerning the
subject belongs to Porciatti and Ventura,[21] who developed
a new PERG called PERGLA in which skin electrodes and reversing at 16 pattern reversal gratings per second were used. The comparative analysis in the current study revealed the superiority of the ssPERG amplitude over the PERG amplitudes in all parameters in the determination of glaucomatous damage. Rapid stimulus change appears to be more effective in detecting the problem in the affected cells. This is similar to the case in the electroretinograms of patients with early‑stage cone‑rod dystrophy, revealing a good single flash cone response but
a suppressed 30‑Hz flicker response.[22] Researchers have
also attempted to provide a metabolic explanation for the superiority of ssPERG over transient PERG in eyes affected by glaucoma. It has been suggested that fast alternating gratings would release more energy in RGCs than slow alternating gratings and a metabolically suppressed glaucomatous retina
may not be able to handle this load.[21,23,24]
In cases with early onset glaucoma, 15‑50% loss of RGCs constitutes an important problem prior to the development of
a visual field defect.[25,26] Some researchers suggested that PERG
is more sensitive in detecting early glaucomatous damage and the presence of RGH damage in patients with known glaucomatous damage in the visual field and an IOP within the
normal range.[27,28] In our study, we did not investigate whether
or not glaucomatous damage can be detected by PERG in cases where VF or structural tests fail. Rather, we identified which parameters of PERG/ssPERG differed in patients with known glaucomatous damage and explored the possible correlation between these test parameters and structural tests. As a result, we found significant changes in wave amplitudes in the POAG group compared to the control group. We observed a similar decrease in both wave amplitudes of transient PERG. In contrast, some studies reported that the P50‑N95 amplitude
was more affected in glaucoma patients.[29] However, similar
to the current study, Bach also found that the two amplitudes
were similarly affected in glaucoma cases.[23] In the literature,
the second amplitude is generally used probably because it is considered that the first amplitude provides more information
on the macula and the second on optic nerve functions.[30]
Electrophysiology and perimeter tests assess visual function in different ways. PERG is an objective method that
Table 3: The sensitivity and specificity of the PERG and ssPERG parameters
Cut‑off value Sensitivity (%) Specificity (%) AUC (%) P*
PERG N35 26 57.7 52.2 0.57±0.05 0.156 PERG P50 52 55.1 63 0.60±0.05 0.058 PERG N95 102 75.6 58.7 0.68±0.04 0.001 PERG N35‑P50 4.32 66.7 67.4 0.29±0.04 <0.001 PERG P50‑N95 6.26 71.5 63 0.34±0.04 0.004 ssPERG Latency 53 65.4 63 0.66±0.04 0.003 ssPERG Amplitude 5.13 77.2 80.4 0.19±0.04 <0.001
Table 4: The correlation of PERG and ssPERG with VF and OCT (RNFL) parameters. (Independent
sample t‑test was used for comparison and
Pearson correlation
test was used for correlation analysis)
MD PSD Temporal RNFL Superior RNFL Nasal RNFL Inferior RNFL Central RNFL P r P r P r P r P r P r P r PERG N35 0,058 ‑0,242 0,219 0,158 0.185 ‑0.171 0.005 ‑0.250 0.053 ‑0.247 0.045 ‑0.255 0.009 ‑0.227 PERG P50 0,464 ‑0,95 0,189 0,169 0.068 ‑0.234 0.966 0.005 0.169 0.177 0.834 ‑0.027 0.982 0.003 PERG N95 0,214 ‑0,257 0,095 0,214 0.343 ‑0.122 0.005 ‑0.252 0.232 ‑0.154 0.871 0.021 0.158 ‑0.181 PERG N35‑P50 0,002 0,381 0,029 ‑0,277 0.077 0.227 <0.001 0.475 <0.001 0.575 <0.001 0.569 <0.001 0.612 PERG P50‑N95 0,001 0,413 0,015 ‑0,308 0.017 0.303 <0.001 0.464 <0.001 0.458 <0.001 0.522 <0.001 0.572 ssPERG Latency 0,095 ‑0,214 0,146 0,187 0.297 ‑0.135 0.253 ‑0.147 0.758 ‑0.040 0.913 ‑0.014 0.475 ‑0.092 ssPERG Amplitude <0,001 0,507 0,002 ‑0,387 0.003 0.376 <0.001 0.691 <0.001 0.683 <0.001 0.569 <0.001 0.755
MD: Mean Deviation, PSD: Pattern Standard Deviation, RNFL: Retinal Nerve Fiber Layer,
P
: Statistically significance value,
r: Pearson correlation coefficient
Table
5: The
correlation of
PERG and
ssPERG with
the macular thickness map values obtained
by OCT
(Independent
sample t‑test was used for comparison and
Pearson correlation
test was used for correlation analysis) Central
Temporal 3 mm Superior 3 mm Nasal 3 mm Inferior 3 mm Temporal 6 mm Superior 6 mm Nasal 6 mm Inferior 6 mm P r P r P r P r P r P r P r P r P r PERG N35 0.836 0.031 0.546 0.091 0.026 0.328 0.468 0.110 0.745 0.049 0.267 0.167 0.081 0.249 0.624 0.074 0.736 0.051 PERG P50 0.189 0.197 0.752 0.048 0.097 0.248 0.573 0.085 0.707 0.057 0.237 0.178 0.058 0.242 0.234 0.179 0.480 0.107 PERG N95 0.775 0.043 0.557 0.089 0.448 0.115 0.447 0.115 0.670 0.065 0.481 0.106 0.558 0.089 0.631 0.073 0.308 0.157 PERG N35‑P50 0.871 0.025 0.023 0.334 0.011 0.372 0.082 0.259 0.029 0.322 0.005 0.411 0.003 0.454 <0.001 0.559 <0.001 0.510 PERG P50‑N95 0.287 0.161 0.007 0.392 0.002 0.444 0.018 0.348 0.022 0.336 0.001 0.474 <0.001 0.543 <0.001 0.543 0.001 0.476 ssPERG Latency 0.559 0.088 0.176 0.203 0.767 0.045 0.447 0.115 0.185 0.199 0.108 0.240 0.913 0.016 0.970 0.006 0.678 0.063 ssPERG Amplitude 0.107 0.241 0.001 0.460 0.001 0.473 0.011 0.373 0.003 0.426 0.002 0.444 <0.001 0.521 <0.001 0.640 <0.001 0.603 P
: Statistically significance value,
measures the electrical activity of RGC whereas VF allows for a subjective assessment affected by post retinal factors. In our study groups, there was a significant difference between the VF MD and PSD values. We found that the amplitudes of both PERG and ssPERG were positively correlated with MD and negatively correlated with PSD. This correlation was even more pronounced for the ssPERG amplitude (k: 0.507, P < 0.001). In cases of OHT, glaucoma suspicion, and early glaucoma, PERG can detect damage before the development of a visual
field defect as mentioned above.[23,31‑33] However, in peripheral
defects, PERG may fall behind VF if the stimulated area is not extended. In addition, if the majority of RGC in local defects in
VF are intact, PERG may not be able to detect an abnormality.[21]
Therefore, approaching these two tests as complementing each other will provide more useful information for the clinician.
Studies that undertook the structural and functional analysis of glaucoma showed a relationship between RNFL
thickness and PERG responses.[34,35] In these studies, a positive
correlation was observed between amplitudes and average RNFL thickness measured in OCT. We found that the PERG and ssPERG amplitudes were significantly correlated with RNFL thickness in all quadrants and this relationship was minimal in the temporal quadrant and maximum in the mean thickness. The highest correlation was between the ssPERG amplitude and the mean RNFL thickness (r: 0.755, P < 0.001). The RNFL being normally thinner in the temporal quadrant compared to the other quadrants can explain why it had a lower level of correlation based on the proportionally fewer changes that would have occurred in this quadrant. When the relationship of PERG with macular thickness was examined, a significant correlation was found between the amplitude values and all thickness values except the central macular thickness, and this correlation was more marked for the 6 mm ring. Among all PERG and ssPERG parameters, the ssPERG amplitude had the highest correlation with macular thickness. This positive correlation suggests that the relationship between structural and functional changes in the retina becomes stronger as we move away from the central macula. Similar to the case in RNFL thickness, the weak correlation of the central thickness value with electrophysiology can be explained by the macula being thinner in this segment compared to the other macular areas.
PERG reveals the RGC function, but reduced amplitude in cases with glaucoma may also be due to RGC dysfunction, as well as RGC loss. This should be considered when investigating the relationship between anatomy and function. Amplitude loss may not be reflected on anatomy at the early stage. In other words, anatomical loss may occur after functional loss. In this regard, there are studies investigating the relationship between structural losses and the severity and progression of
glaucoma.[36‑40] In their study conducted with 31 OHT, 34 early
glaucoma and 16 healthy cases, Falsini et al. reported that functional loss was more prominent than anatomical loss in the OHT group whereas functional and anatomical loss was
similar in the early glaucoma group.[41]
There are several limitations in the present study. One of them is the limited number of patients. The main cause for this is the difficulty to find compatible patients to these tests at that age. Second, we did not measure the optic nerve head diameter. Unstandardized optic nerve head diameter might
have effected the OCT results and is a lack of this study. These limitation warrants further controlled studies.
Conclusion
The good correlation we found between the wave amplitude of ssPERG and the parameters of VF and OCT as well as our increased confidence in the ssPERG parameters after evaluating the results of both the current study and previous research reporting satisfactory efficacy of this test in the early diagnosis of glaucoma confirm the idea that ssPERG can be safely used in routine practice and offer additional benefits when combined with VF and other imaging techniques.
In the management of glaucoma, rather than not approaching the damage simply as RGC or neuroretinal rim loss, it is necessary to evaluate the structural and functional tests as a whole with the awareness that there is an ongoing anatomic and functional relationship. Among these tests, PERG presents as an efficient electrophysiological technique for the early diagnosis and follow‑up of glaucoma.
Financial support and sponsorship
Nil.
Conflicts of interest
There are no conflicts of interest.
References
1. Leske MC. The epidemiology of open‑angle glaucoma: A review. Am J Epidemiol 1983;118:166‑91.
2. Konstas AG, Hollo G, Astakhov YS, Teus MA, Akopov EL, Jenkins JN, et al. Factors associated with long‑term progression or stability in exfoliation glaucoma. Arch Ophthalmol 2004;122:29‑33. 3. Jonas JB, Aung T, Bourne RR, Bron AM, Ritch R, Panda‑Jonas S.
Glaucoma. Lancet. 2017;390:2183‑93.
4. Rodriguez‑Una I, Azuara‑Blanco A. New technologies for glaucoma detection. Asia Pac J Ophthalmol (Phila) 2018;7:394‑404. 5. Resnikoff S, Pascolini D, Etya’ale D, Kocur I, Pararajasegaram R,
Pokharel GP, et al. Global data on visual impairment in the year 2002. Bull World Health Organ 2004;82:844‑51.
6. Papst N, Bopp M, Schnaudigel OE. Pattern electroretinogram and visually evoked cortical potentials in glaucoma. Graefes Arch Clin Exp Ophthalmol 1984;222:29‑33.
7. Wanger P, Persson HE. Pattern‑reversal electroretinograms in ocular hypertension. Doc Ophthalmol 1985;61:27‑31.
8. Berninger TA, Arden GB. The patern electroretinogram. Eye 1988;2 Suppl:257‑83.
9. Ringens PJ, Vijfvinkel‑Bruinenga S, van Lith GH. The pattern‑elicited electroretinogram. I. A tool in the early detection of glaucoma? Ophthalmologica 1986;192:171‑5.
10. van Lith G, Ringens P, de Heer LJ. Pattern electroretinogram and glaucoma. Dev Ophthalmol 1984;9:133‑9.
11. Parisi V, Manni G, Centofanti M, Gandolfi SA, Olzi D, Bucci MG. Correlation between optical coherence tomography, pattern electroretinogram, and visual evoked potentials in open‑angle glaucoma patients. Ophthalmology 2001;108:905‑12.
12. Porciatti V, Ventura LM. Normative data for a user‑friendly paradigm for pattern electroretinogram recording. Ophthalmology 2004;111:161‑8.
13. Trick GL, Nesher R, Cooper DG, Shields SM. The human pattern ERG: Alteration of response properties with aging. Optom Vis Sci 1992;69:122‑8.
14. Porciatti V, Burr DC, Morrone MC, Fiorentini A. The effects of aging on the pattern electroretinogram and visual evoked potential in humans. Vision Res 1992;32:1199‑209.
15. Stiefelmayer S, Neubauer AS, Berninger T, Arden GB, Rudolph G. The multifocal patern electroretinogram in glaucoma. Vision Res2004;44:103‑12.
16. Weinstein GW, Arden GB, Hitchings RA, Ryan S, Calthorpe CM, Odom JV. The pattern electroretinogram (PERG) in ocular hypertension and glaucoma. Arch Ophthalmol 1988;106:923‑8. 17. May JG, Ralston JV, Reed JL, Van Dyk HJ. Loss in pattern‑elicited
electroretinograms in optic nerve dysfunction. Am J Ophthalmol 1982;93:418‑22.
18. Trick GL. Retinal potentials in patients with primary open‑angle glaucoma: Physiological evidence for temporal frequency tuning deficits. Invest Ophthalmol Vis Sci 1985;26:1750‑8.
19. Bach M, Speidel‑Fiaux A. Pattern electroretinogram in glaucoma and ocular hypertension. Doc Ophthalmol 1989;73:173‑81. 20. Hiss P, Fahl G. [Changes in the pattern electroretinogram in
glaucoma and ocular hypertension are dependent on stimulus frequency]. Fortschr Ophthalmol 1991;88:562‑5.
21. Ventura LM, Porciatti V. Pattern electroretinogram in glaucoma. Curr Opin Ophthalmol 2006;17:196‑202.
22. Papathanasiou ES, Papacostas SS. Flash electroretinography: Normative values with surface skin electrodes and no pupil dilation using a standard stimulation protocol. Doc Ophthalmol 2008;116:61‑73.
23. Bach M. Electrophysiological approaches for early detection of glaucoma. Eur J Ophthalmol 2001;11(Suppl 2):S41‑9.
24. Porciatti V, Sorokac N, Buchser W. Habituation of retinal ganglion cell activity in response to steady state pattern visual stimuli in normal subjects. Invest Ophthalmol Vis Sci 2005;46:1296‑302. 25. Iwata K. Ophthalmoscopy in the detection of optic disc and retinal
nerve fiber layer changes in early glaucoma. Surv Ophthalmol 1989;33(Suppl):447‑8; discussion 9‑50.
26. Quigley HA, Dunkelberger GR, Green WR. Retinal ganglion cell atrophy correlated with automated perimetry in human eyes with glaucoma. Am J Ophthalmol 1989;107:453‑64.
27. Lee BB. Receptive field structure in the primate retina. Vision Res 1996;36:631‑44.
28. Trick GL. Pattern electroretinogram: An electrophysiological technique applicable to primary open‑angle glaucoma and ocular hypertension. J Glaucoma 1992;1:271‑9.
29. Korth M. The value of electrophysiological testing in glaucomatous diseases. J Glaucoma 1997;6:331‑43.
30. Fishman GA, Birch DG, Holder GE, Brigell MG, Electrophysiologic Testing, in Disorders of Retina, Optic Nerve and Visual Pathway, second edition, Ophthalmology Monographs II, 2001.
31. Porciatti V, Falsini B, Brunori S, Colotto A, Moretti G. Pattern electroretinogram as a function of spatial frequency in ocular hypertension and early glaucoma. Doc Ophthalmol 1987;65:349‑55. 32. Ventura LM, Porciatti V, Ishida K, Feuer WJ, Parrish RK 2nd. Pattern
electroretinogram abnormality and glaucoma. Ophthalmology 2005;112:10‑9.
33. Hood DC, Xu L, Thienprasiddhi P, Greenstein VC, Odel JG, Grippo TM, et al. The pattern electroretinogram in glaucoma patients with confirmed visual field deficits. Invest Ophthalmol Vis Sci 2005;46:2411‑8.
34. Toffoli G, Vattovani O, Cecchini P, Pastori G, Rinaldi G, Ravalico G. Correlation between the retinal nerve fiber layer thickness and the pattern electroretinogram amplitude. Ophthalmologica 2002;216:159‑63.
35. Parisi V. Correlation between morphological and functional retinal impairment in patients affected by ocular hypertension, glaucoma, demyelinating optic neuritis and Alzheimer’s disease. Semin Ophthalmol 2003;18:50‑7.
36. Ventura LM, Sorokac N, De Los Santos R, Feuer WJ, Porciatti V. The relationship between retinal ganglion cell function and retinal nerve fiber thickness in early glaucoma. Invest Ophthalmol Vis Sci 2006;47:3904‑11.
37. Schuman JS, Hee MR, Puliafito CA, Wong C, Pedut‑Kloizman T, Lin CP, et al. Quantification of nerve fiber layer thickness in normal and glaucomatous eyes using optical coherence tomography. Arch Ophthalmol 1995;113:586‑96.
38. Medeiros FA, Zangwill LM, Bowd C, Vessani RM, Susanna R Jr, Weinreb RN. Evaluation of retinal nerve fiber layer, optic nerve head, and macular thickness measurements for glaucoma detection using optical coherence tomography. Am J Ophthalmol 2005;139:44‑55.
39. Nouri‑Mahdavi K, Hoffman D, Tannenbaum DP, Law SK, Caprioli J. Identifying early glaucoma with optical coherence tomography. Am J Ophthalmol 2004;137:228‑35.
40. Wollstein G, Schuman JS, Price LL, Aydin A, Stark PC, Hertzmark E, et al. Optical coherence tomography longitudinal evaluation of retinal nerve fiber layer thickness in glaucoma. Arch Ophthalmol 2005;123:464‑70.
41. Falsini B, Marangoni D, Salgarello T, Stifano G, Montrone L, Campagna F, et al. Structure‑function relationship in ocular hypertension and glaucoma: Interindividual and interocular analysis by OCT and pattern ERG. Graefes Arch Clin Exp Ophthalmol 2008;246:1153‑62.