SAFETY MEASURES AND UNCERTAINTY REDUCTION MECHANISMS
By ERDEM ACAR
A DISSERTATION PRESENTED TO THE GRADUATE SCHOOL OF THE UNIVERSITY OF FLORIDA IN PARTIAL FULFILLMENT
OF THE REQUIREMENTS FOR THE DEGREE OF DOCTOR OF PHILOSOPHY
UNIVERSITY OF FLORIDA 2006
Copyright 2006 by Erdem Acar
This dissertation is dedicated to my family: my father Zuhuri Acar, my mother Şerife Acar, and my sister Asiye Acar.
ACKNOWLEDGMENTS
I would like to express special thanks and appreciation to Dr. Raphael T. Haftka, chairman of my advisory committee. I am grateful to him for providing me with this excellent opportunity and financial support to complete my doctoral studies under his exceptional guidance. He encouraged me to attend several conferences and assisted in finding an internship during my studies. Through our weekly meetings and his open door policy, which I definitely over-exploited, he greatly contributed to this dissertation. His limitless knowledge and patience are inspiration to me. During the past three years, he was more than my PhD supervisor; he was a friend, and sometimes like a father. I sincerely hope we will remain in contact in the future.
I would also like to thank the members of my advisory committee, Dr. Bhavani V. Sankar, co-chair of the committee, Dr. Nagaraj Arakere, Dr. Nam-Ho Kim and Dr. Stanislav Uryasev. I am grateful for their willingness to review my Ph.D. research and to provide me with the constructive comments which helped me to complete this dissertation. In particular, I would like to extend special thanks to Dr. Bhavani V. Sankar for his guidance on the papers we co-authored, and Dr. Nam-Ho Kim for his comments and suggestions during the meetings of the Structural and Multidisciplinary Group.
I also wish to express my gratitude to my M.Sc. advisor, Dr. Mehmet A. Akgun, who provided a large share of motivation for pursuing a doctorate degree. The experience he supplied me during my master’s degree studies contributed to this dissertation.
v
of the Mechanical and Aerospace Engineering Department of the University of Florida for their support, friendship and many technical discussions. In particular, I would like to thank Dr. Melih Papila, Dr. Jaco Schutte, my soul sister Lisa Schutte, Tushar Goel and Ben Smarslok for their friendship (in the order of meeting with them).
Financial support provided by NASA Cooperative Agreement NCC3-994, NASA University Research, Engineering and Technology Institute and NASA Langley Research Center Grant Number NAG1-03070 is gratefully acknowledged.
Finally, my deepest appreciation goes to my family: my father Zuhuri Acar, my mother Şerife Acar and my sister Asiye Acar. The initiation, continuation and final completion of this thesis would not have happened without their continuous support, encouragement and love. I am incredibly lucky to have them in my life.
TABLE OF CONTENTS page ACKNOWLEDGMENTS ... iv LIST OF TABLES... xi LIST OF FIGURES ...xv NOMENCLATURE ... xix ABSTRACT...xxv CHAPTER 1 INTRODUCTION ...1 Motivation...1 Objectives ...5 Methodology...6 Outline ...7 2 LITERATURE REVIEW ...12
Probabilistic vs. Deterministic Design ...12
Structural Safety Analysis ...14
Probability of Failure Estimation ...15
Analytical calculation of probability of failure ...15
Moment-based techniques...16
Simulation techniques ...17
Separable Monte Carlo simulations ...18
Response surface approximations ...19
Reliability-Based Design Optimization...20
Double loop (Nested) RBDO ...20
Single loop RBDO ...21
Error and Variability...22
Uncertainty Classification ...22
Reliability Improvement by Error and Variability Reduction...23
vii
Introduction...28
Structural Uncertainties ...30
Safety Measures...32
Design of a Generic Component...33
Design and Certification Testing...33
Effect of Certification Tests on Distribution of Error Factor e ...36
Probability of Failure Calculation by Analytical Approximation ...38
Effect of Three Safety Measures on Probability of Failure...41
Summary...51
4 COMPARING EFFECTIVENESS OF MEASURES THAT IMPROVE AIRCRAFT STRUCTURAL SAFETY ...53
Introduction...53
Load Safety Factor ...54
Conservative Material Properties ...54
Tests...54
Redundancy ...55
Error Reduction ...55
Variability Reduction ...55
Errors, Variability and Total Safety Factor ...56
Errors in Design...56
Errors in Construction ...58
Total Error Factor ...59
Total Safety Factor ...60
Variability...61
Certification Tests...62
Probability of Failure Calculation ...65
Probability of Failure Calculation by Separable MCS ...65
Including Redundancy...70
Results...70
Effect of Errors ...70
Weight Saving Due to Certification Testing and Error Reduction...73
Effect of Redundancy ...74
Additional Safety Factor Due to Redundancy...77
Effect of Variability Reduction ...78
Summary...81
5 INCREASING ALLOWABLE FLIGHT LOADS BY IMPROVED STRUCTURAL MODELING...82
Introduction...82
Structural Analysis of a Sandwich Structure ...85
Deterministic Design and B-basis Value Calculations...93
Assessment of Probability of Failure...96
Analyzing the Effects of Improved Model on Allowable Flight Loads via Probabilistic Design ...99
Summary...101
6 TRADEOFF OF UNCERTAINTY REDUCTION MECHANISMS FOR REDUCING STRUCTURAL WEIGHT...103
Introduction...104
Design of Composite Laminates for Cryogenic Temperatures ...106
Calculation of Probability of Failure ...108
Probabilistic Design Optimization...112
Probabilistic Sufficiency Factor (PSF)...112
Design Response Surface (DRS)...113
Weight Savings by Reducing Error and Employing Manufacturing Quality Control ...114
Choosing Optimal Uncertainty Reduction Combination...118
Summary...119
7 OPTIMAL CHOICE OF KNOCKDOWN FACTORS THROUGH PROBABILISTIC DESIGN...121
Introduction...122
Testing of Aircraft Structures ...123
Quantification of Errors and Variability...125
Errors in Estimating Material Strength Properties from Coupon Tests ...125
Errors in Structural Element Tests ...127
Allowable stress updating and the use of explicit knockdown factors...129
Current industrial practice on updating allowable stresses using worst-case conditions (implicit knockdown factors) ...129
Proposal for a better way to update allowable stresses: Using the average failure stress measured in the tests and using optimal explicit knockdown factors...130
Error updating via element tests...134
Errors in Design...135
Errors in Construction ...137
Total Error Factor...138
Total Safety Factor ...138
Variability...139
Simulation of Certification Test and Probability of Failure Calculation...141
Simulation of Certification Test ...141
Calculation of Probability of Failure...142
Results...144
Optimal Choice of Explicit Knockdown Factors for Minimum Weight and Minimum Certification Failure Rate...145
ix
Effect of Coupon Tests and Structural Element Tests on Error in Failure
Prediction ...150
Effect of number of coupon tests alone (for a fixed number of element tests, ne=3) ...150
Effect of number of element tests alone (for a fixed number of coupon tests, nc=40) ...151
Advantage of Variable Explicit Knockdown Factors...153
Effect of Other Uncertainty Reduction Mechanisms ...157
Effect of variability reduction ...157
Effect of error reduction...159
Effect of Number of Coupon Tests ...161
Effect of Number of Structural Element Tests ...162
Summary...164
8 RELIABILITY BASED AIRCRAFT STRUCTURAL DESIGN PAYS EVEN WITH LIMITED STATISTICAL DATA ...165
Introduction...165
Demonstration of Gains from Reliability-Based Structural Design Optimization of a Representative Wing and Tail System ...167
Problem Formulation and Simplifying Assumptions ...167
Probabilistic Optimization with Correct Statistical Data ...169
Effect of Errors in Information about Deterministic Design ...174
Errors in Coefficient of Variation of Stresses ...174
Erroneous Mean Stresses...177
Errors in Probability of Failure Estimates of Deterministic Design...179
Effect of Using Wrong Probability Distribution Type for the Stress...181
Approximate Probabilistic Design Based on Failure Stress Distributions ...182
Application of Characteristic Stress Method to Wing and Tail Problem ...186
Summary...189
9 CONCLUDING REMARKS...192
APPENDIX A A-BASIS AND B-BASIS VALUE CALCULATION...197
B PROBABILITY CALCULATIONS FOR CHAPTER 3 ...199
Calculation of Pr(CT|e), the Probability of Passing Certification Test ...199
Calculations of Mean and Standard Deviation of Probability of Failure ...200
C CONFLICTING EFFECTS OF ERROR AND VARIABILITY ON PROBABILITY OF FAILURE IN CHAPTER 3 ...202
D COMPARISON OF RESULTS OF SINGLE ERROR FACTOR AND
MULTIPLE ERROR FACTOR CASES ...204
E DETAILS OF SEPARABLE MONTE CARLO SIMULATIONS FOR PROBABILITY OF FAILURE CALCULATIONS IN CHAPTER 4...209
F CALCULATION OF THE SYSTEM FAILURE PROBABILITY USING BIVARIATE NORMAL DISTRIBUTION ...212
G TEMPERATURE DEPENDENT MATERIAL PROPERTIES FOR THE CRYOGENIC LAMINATES IN CHAPTER 6 ...214
H DETAILS OF CONSERVATIVE CUMULATIVE DISTRIBUTION FUNCTION (CDF) FITTING ...216
I DETAILS OF DESIGN RESPONSE SURFACE FITTING FOR THE PROBABILITY SUFFICIENCY FACTOR FOR THE CRYOGENIC LAMINATES IN CHAPTER 6...218
J ASSESSMENT OF THE ERROR DUE TO LIMITED NUMBER OF COUPON TESTS...222
K PROBABILITY OF FAILURE CALCULATIONS FOR CHAPTER 7 USING SEPARABLE MCS ...224
L CHANGE IN COST DUE TO INCREASE OF THE STRUCTURAL WEIGHT ..230
M RESPONSE SURFACE APPROXIMATIONS FOR RELIABILITY INDEX OF CERTIFICATION FAILURE RATE, RELIABILITY INDEX OF PROBABILITY OF FAILURE AND BUILT SAFETY FACTOR IN CHAPTER 7 ...232
N CALCULATION OF THE MEAN AND THE C.O.V. OF THE STRESS DISTRIBUTION USING PROBABILITY OF FAILURE INFORMATION...233
O RELATION OF COMPONENT WEIGHTS AND OPTIMUM COMPONENT FAILURE PROBABILITIES IN CHAPTER 8 ...236
P HISTORICAL RECORD FOR AIRCRAFT PROBABILITY OF FAILURE ...241
LIST OF REFERENCES...243
xi
Table page
3-1 Uncertainty classification...31 3-2 Distribution of random variables used for component design and certification ...36 3-3 Comparison of probability of failures for components designed using safety
factor of 1.5, mean value for allowable stress and error bound of 50%...40 3-4 Probability of failure for different bounds on error e for components designed
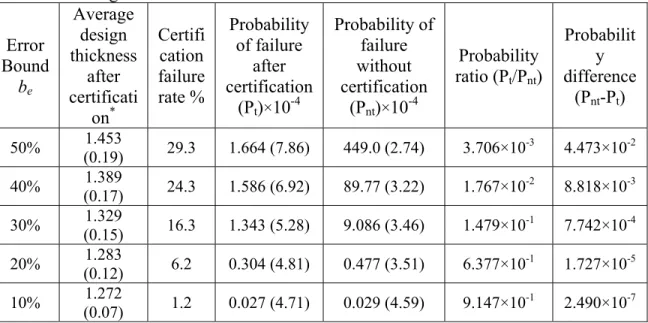
using safety factor of 1.5 and A-basis property for allowable stress ...42 3-5 Probability of failure for different bounds on error e for components designed
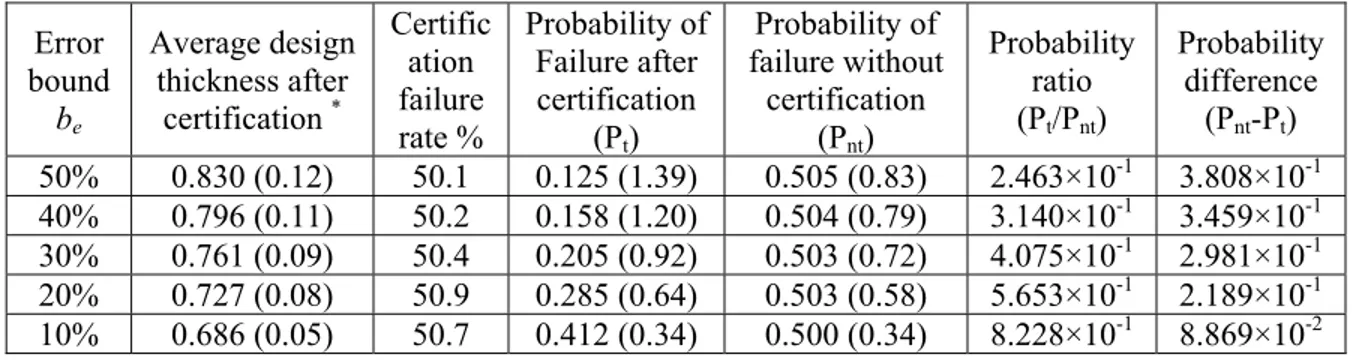
using safety factor of 1.5 and mean value for allowable stress...44 3-6 Probability of failure for different bounds on error e for safety factor of 1.0 and
A-basis allowable stress ...46 3-7 Probability of failure for different error bounds for safety factor of 1.0 and mean
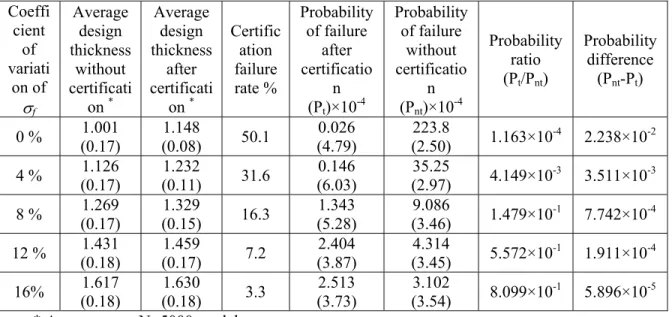
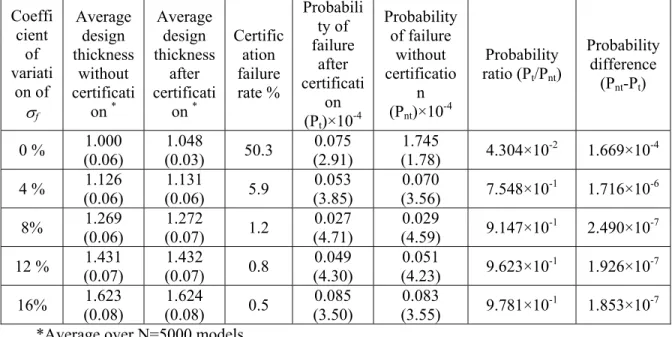
value for allowable stress ...46 3-8 Probability of failure for different uncertainty in failure stress for the
components designed with safety factor of 1.5, 50% error bounds e and A-basis allowable stress. ...47 3-9 Probability of failure for different uncertainty in failure stress for the
components designed with safety factor of 1.5, 30% error bound e and A-basis allowable stress. ...47 3.10 Probability of failure for uncertainty in failure stress for components designed
using safety factor of 1.5, 10% error bounds e and A-basis properties...48 4-1 Distribution of error factors and their bounds...59 4-2 Distribution of random variables having variability ...61 4-3 Mean and standard deviations of the built and certified distributions of the error
factor etotal and the total safety factor SF...64 4-4 Average and coefficient of variation of the probability of failure for the
4-5 Reduction of the weight of structural parts by certification testing for a given
probability of failure...74
4-6 Effect of redundancy on the probabilities of failure...75
4-7 Effect of redundancy on the effectiveness of certification testing ...76
4-8 Effect of correlation coefficient ρ on system failure probabilities and effectiveness of certification testing...77
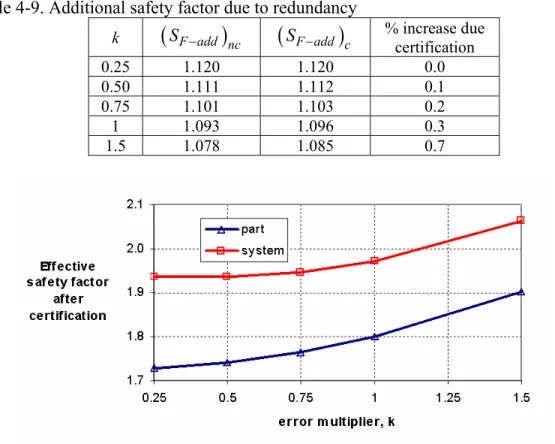
4-9 Additional safety factor due to redundancy ...78
4-10 Comparison of system failure probabilities corresponding to different variability in failure stress σf...79
5-1 Deviations between measured and fitted values of “average Gc” and “Gc with mode mixity” for different designs ...90
5-2 The mean and B-basis values of the fracture toughness of the designs analyzed....94
5-3 Allowable flight load of failure of the sandwich panels designed using deterministic approach ...96
5-4 Corresponding probabilities of failure of the sandwich panels designed using deterministic approach ...99
5-5 Allowable flight loads of the sandwich panels calculated via probabilistic approach ...101
6-1 Allowable strains for IM600/133 ...107
6-2 Deterministic optimum design ...108
6-3 Coefficients of variation of the random variables ...108
6-4 Evaluation of the accuracy of the analysis response surface...110
6-5 Comparison of probability of failure estimations for the deterministic optimum..111
6-6 Probabilistic optimum designs for different error bounds when only error reduction is applied ...114
6-7 Probabilistic optimum designs for different error bounds when both error and variability reduction are applied...116
7-1 Distribution of error factors and their bounds...138
xiii
7-4 Comparing explicit knockdown factors for minimum built safety factor for a
specified certification failure rate...148 7-5 Comparing explicit knockdown factors for minimum built safety factor for a
specified probability of failure ...150 7-6 Comparison of constant and variable explicit knockdown factors case and
corresponding area ratios, A/A0. ...154 7-7 Comparison of constant (i.e., test independent) implicit and explicit knockdown
factors and corresponding area ratios A/A0...156 7-8 Comparison of mean and coefficient of variation of total knockdown reduction
at the element test level for the cases of implicit constant knockdown factor and explicit variable knockdown factors ...157 7-9 Optimal explicit knockdown factors for minimum CFR when variability in
failure stress is reduced by half ...159 7-10 Optimal explicit knockdown factors for minimum CFR when all errors reduced
by half...161 7-11 Optimal explicit knockdown factors for minimum CFR different number of
coupon tests, nc...162 7-12 Optimal explicit knockdown factors for different number of structural element
tests, ne...163 8-1 Probabilistic structural design optimization for safety of a representative wing
and tail system...171 8-2 Probabilistic structural optimization of wing, horizontal tail and vertical tail
system...173 8-3 Errors in the ratios of failure probabilities of the wing and tail system when the
c.o.v. of the stresses under-estimated by 50%...175 8-4 Errors in the ratios of failure probabilities of the wing and tail system when the
mean stresses are under-estimated by 20% ...178 8-5 Errors in the ratios of failure probabilities of the wing and tail system when the
probability of failure of the deterministic design is under-predicted ...180 8-6 Errors in the ratios of failure probabilities of wing and tail system when the
8-7 Errors in the ratios of failure probabilities of the wing and tail system if the optimization is performed using wrong probability distribution type for the
stress ...182 8-8 Probabilistic design optimization for safety of the representative wing and tail
system using the characteristic-stress method...188 8-9 Effect of 20% under-estimate of k on the ratios of probability of failure estimate188 D-1 Equivalent error bounds for the SEF model corresponding to the same standard
deviation in the MEF model...205 D-2 Comparison of system failure probabilities for the SEF and MEF models ...206 D-3 Comparison of the total safety factor SF used in the design of structural parts for
the SEF and MEF models...207 E-1 Comparison of the probability of failure estimations...211 I-1 The ranges of variables for the three DRS constructed for PSF calculation...218 I-2 Accuracies of DRS fitted to PSF and Pf in terms of four design variables (t1, t2,
θ1 and θ2) for error bounds, be, of 0, 10%, and 20% ...219 I-3 Ranges of design variables for the three DRS constructed for probability of
failure estimation for the error and variability reduction case ...221 M-1 Accuracy of response surfaces ...232 P-1 Aircraft accidents and probability of failure of aircraft structures...242
xv
Figure page
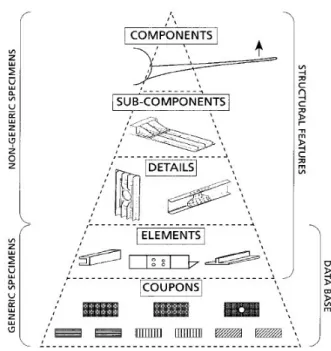
2-1 Building block approach ...26
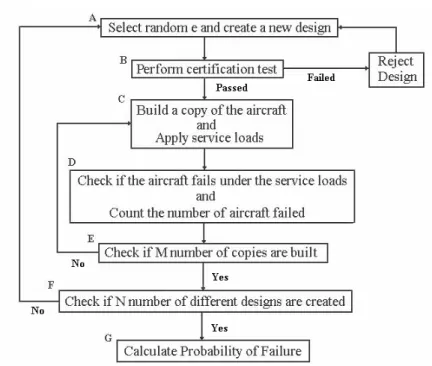
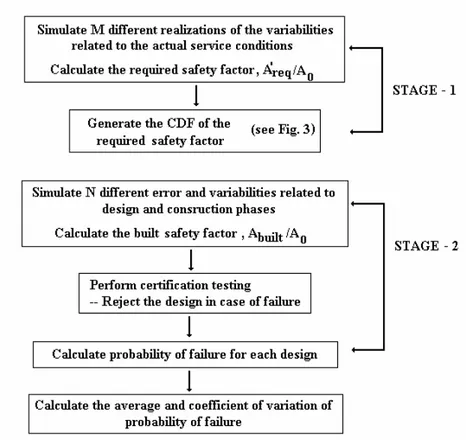
3-1 Flowchart for Monte Carlo simulation of component design and failure ...35
3-2 Initial and updated probability distribution functions of error factor e...38
3-3 Design thickness variation with low and high error bounds ...45
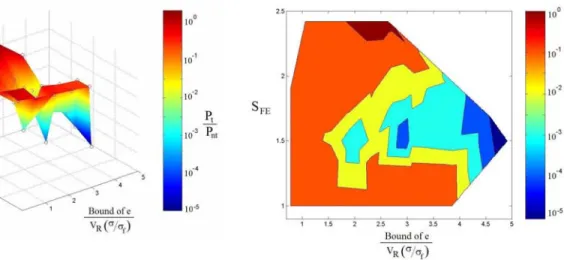
3-4 Influence of effective safety factor, error, and variability on the probability ratio (3-D view) ...50
3-5 Influence of effective safety factor, error and variability on the probability ratio (2-D plot)...50
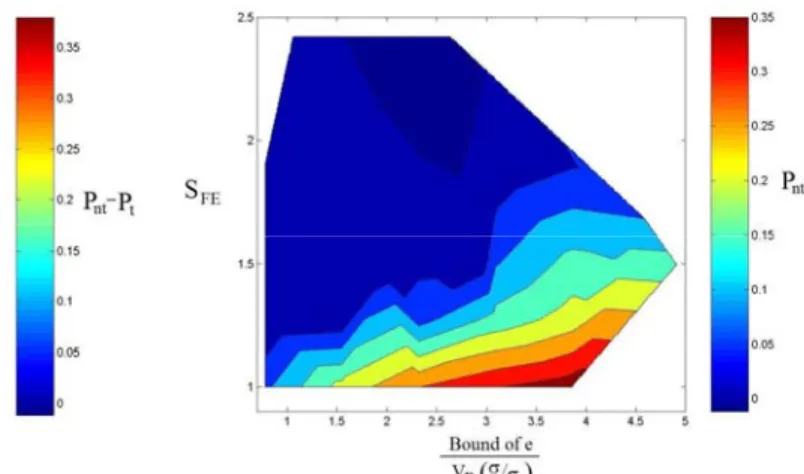
3-6 Influence of effective safety factor, error and variability on the probability difference (3-D view) ...51
3-7 Influence of effective safety factor, error and variability on the probability difference (2-D plot)...51
4-1 Comparing distributions of built and certified total error etotal of SEF and MEF models ...63
4-2 Initial and updated distribution of the total safety factor SF...64
4-3 The variation of the probability of failure with the built total safety factor...68
4-4 Flowchart for MCS of component design and failure...69
4-5 Total safety factors for MEF model for the structural part and system after certification...78
4-6 Effect of variability on failure probability ...79
5-1 The model of face-sheet/core debonding in a one-dimensional sandwich panel with pressure load...86
5-3 Comparison of actual and fitted cumulative distribution functions of variability,
dMM, of Gc. ...92
5-4 Comparison of actual and fitted cumulative distribution functions of total uncertainty (error and variability, dA) of Gc. ...92
5-5 Fitted least square lines for fracture toughness, and derived B-basis allowables ....95
6-1 Geometry and loading of the laminate with two ply angles...107
6-2 Comparison of CDF obtained via 1,000 MCS, the approximate normal distribution and conservative approximate normal distributions for ε2 on θ1 corresponding to the deterministic optimum...111
6-3 Reducing laminate thickness (hence weight) by error reduction (no variability reduction) ...115
6-4 Reducing laminate thickness by error reduction (ER) and quality control (QC)...116
6-5 Trade-off plot for the probability of failure, design thickness and uncertainty reduction measures...117
6-6 Tradeoff of probability of failure and uncertainty reduction ...119
7-1 Building-block approach for aircraft structural testing ...123
7-2 Simplified three level of tests...124
7-3 Current use of knockdown factors based on worst-case scenarios ...131
7-4 Shrinkage of the failure surface ...132
7-5 The variation of the explicit knockdown factors with ratio of the failure stress measured in the test and calculated failure stress with and without transition interval...133
7-6 Proposed use of explicit knockdown factors dependent on test results ...134
7-7 Initial and updated distribution of the total safety factor SF with and without structural element test...142
7-8 The variation of probability of failure of a structural part built by a single aircraft company...144
7-9 Optimal choice of explicit knockdown factors kcl and kch for minimum built safety factor for specified certification failure rate ...146
7-10 Comparing CFR and PF of the structures designed for minimum CFR and minimum PF...149
xvii
7-12 Effect of number of element tests on the error in failure prediction for a fixed
number of coupon tests (40 coupon tests)...152
7-13 Evolution of the mean failure stress distribution with and without Bayesian updating...153
7-14 Comparison of variable and constant explicit knockdown factor ...154
7-15 Comparison of Pareto fronts of certification failure rate and built safety factor for two different approaches while updating the allowable stress based on failure stresses measured in element tests ...155
7-16 Reducing probability of failure and certification failure rate using variability reduction...159
7-17 Reducing certification failure rate using error reduction, variability reduction and combination of error and variability reduction...160
7-18 Optimal explicit knockdown factors for different number of coupon tests for minimum CFR and PF...162
7-19 Effect of number of structural element tests, ne...163
8-1 Stress distribution s(σ) before and after redesign in relation to failure-stress distribution f(σf) ...168
8-2 The change of the ratios of probabilities of failure of the probabilistic design of Table 8-1 versus the error in c.o.v.(σ)...176
8-3 Two different stress distributions at the wing leading to the same probability of failure of 1×10⁻⁷...177
8-4 The change of the ratios of probabilities of failure with respect to the error in mean stress ...179
8-5 Calculation of characteristic stress σ* from probability of failure ...185
8-6 Comparison of approximate and exact Δ and Δ* and the resulting probabilities of failure for lognormal failure stress...186
8-7 The variation of the ratios of probabilities of failure with respect to error in k ...189
D-1 System failure probabilities for the SEF and MEF models after certification ...206
E-1 Comparison of numerical CDF with the assumed lognormal CDF for the
distribution of the required safety factor ...210
G-1 Material properties E1, E2, G12 and ν12 as a function of temperature ...214
G-2 Material properties α1 and α2 as a function of temperature...215
K-1 The variation of probability of failure with built total safety factor ...227
xix ARS = Analysis response surface
req
A′ = Minimum required cross sectional area for the component to carry the service loading without failure
A0 = Load carrying area if there is no variability and no safety measures
α1, α2 = Coefficient of thermal expansion along and transverse to fiber direction
be = Bound of error
β = Reliability index
C = Capacity of structure, for example, failure stress CFD = Cumulative distribution function
CFR = Certification failure rate CLT = Classical lamination theory c.o.v. = Coefficient of variation DRS = Design response surface
Δ* = Relative change in the characteristic stress σ* corresponding to a relative change of Δ in stress σ
e = Error factor
efc = Error in failure prediction at the coupon level
eC = Error in capacity calculation
efe = Error in failure prediction at the element level
efT = Total error in failure prediction
em = Error in material property prediction
eP = Error in load calculation
eR = Error in response calculation
eσ = Error in stress calculation
et = Error in thickness calculation
etotal = Total error factor
ew = Error in width calculation
eA = Error in facture toughness assessment if traditional (averaging) method is used
eMM = Error in facture toughness assessment if traditional (averaging) method is used
ER = Error reduction
E1, E2 = Young’s modulus along and transverse to fiber direction
ε1, ε2 = Strains in the fiber direction and transverse to the fiber direction f( ) = Probability density function of the failure stress
F( ) = Cumulative distribution function of the failure stress FAA = Federal Aviation Administration
G = Strain energy release rate
GC = Fracture toughness
G12 = Shear modulus
γ12 = Shear strain
k = Error multiplier
xxi
KI, KII = Model I and II stress intensity factors, respectively
M = Number of simulations in the first stage of MCS MCS = Monte Carlo simulation
MEF model = Multiple error factor model
N = Number of simulations in the second stage of MCS
Nx, Ny = Mechanical loading in x and y directions, respectively
nc = Number of coupon tests
ne = Number of structural element tests
pallow = Allowable flight load
P = Load
PDF = Probability density function
PSF = Probability sufficiency factor
Pd = Design load according to the FAA specifications
Pf = Probability of failure of a component
Pf* = Approximate probability of failure of probabilistic design
Pfd = Probability of failure of deterministic design
PF = Probability of failure of a system
c
P = Average probability of failure after certification test
nc
P = Average probability of failure before certification test QC = Quality control for manufacturing
ret = Ratio of failure stresses measured in test and its predicted value
RMSE = Root mean square error
RSA = Response surface approximation
R2adj = Adjusted coefficient of multiple determination ρ = Coefficient of correlation
s( ) = Probability density function of the stress SEF model = Single error factor model
Sc = Additional company safety factor
Scl = Additional company safety factor if the failure stress measured in element tests are lower than the predicted failure stress
Sch = Additional company safety factor if the failure stress measured in element tests are higher than the predicted failure stress
Sfe = Total safety factor added during structural element tests
SFL = Load safety factor of 1.5 (FAA specification)
SF = Total safety factor
σ = Stress σ * = Characteristic stress a σ = Allowable stress f σ = Failure stress t = Thickness
vt = Variability in built thickness
vw = Variability in built width
VR = Coefficient of variation
w = Width
xxiii
Φ = Cumulative distribution function of the standard normal distribution
ψ = Mode-mixity angle
Subscripts
act = The value of the relevant quantity in actual flight conditions
built = Built value of the relevant quantity, which is different than the design value due to errors in construction
calc = Calculated value of the relevant quantity, which is different from the true value due to errors
cert = The value of the relevant quantity after certification test d = Deterministic design
design = The design value of the relevant quantity spec = Specified value of the relevant qunatity target = Target value of the relevant quantity true = The true value of the relevant quantity worst = The worst value of the relevant quantity
W = Wing
T = Tail
Subscripts
ave = Average value of the relevant quantity ini = Initial value of the relevant quantity upd = Updated value of the relevant quantity
U = Upper limit of the relevant quantity L = Lower limit of the relevant quantity
xxv
of the University of Florida in Partial Fulfillment of the Requirements for the Degree of Doctor of Philosophy
AIRCRAFT STRUCTURAL SAFETY: EFFECTS OF EXPLICIT AND IMPLICIT SAFETY MEASURES AND UNCERTAINTY REDUCTION MECHANISMS
By Erdem Acar August 2006 Chair: Raphael T. Haftka
Cochair: Bhavani V. Sankar
Major Department: Mechanical and Aerospace Engineering
Aircraft structural safety is achieved by using different safety measures such as safety and knockdown factors, tests and redundancy. Safety factors or knockdown factors can be either explicit (e.g., load safety factor of 1.5) or implicit (e.g., conservative design decisions). Safety measures protect against uncertainties in loading, material and geometry properties along with uncertainties in structural modeling and analysis. The two main objectives of this dissertation are: (i) Analyzing and comparing the effectiveness of structural safety measures and their interaction. (ii) Allocating the resources for reducing uncertainties, instead of living with the uncertainties and allocating the resources for heavier structures for the given uncertainties.
Certification tests are found to be most effective when error is large and variability is small. Certification testing is more effective for improving safety than increased safety factors, but it cannot compete with even a small reduction in errors. Variability reduction is even more effective than error reduction for our examples.
The effects of structural element tests on reducing uncertainty and the optimal choice of additional knockdown factors are explored. We find that instead of using implicit knockdown factors based on worst-case scenarios (current practice), using test-dependent explicit knockdown factors may lead weight savings. Surprisingly, we find that a more conservative knockdown factor should be used if the failure stresses measured in tests exceeds predicted failure stresses in order to reduce the variability in knockdown factors generated by variability in material properties.
Finally, we perform probabilistic optimization of a wing and tail system under limited statistical data for the stress distribution and show that the ratio of the probabilities of failure of the probabilistic design and deterministic design is not sensitive to errors in statistical data. We find that the deviation of the probabilistic design and deterministic design is a small perturbation, which can be achieved by a small redistribution of knockdown factors.
1
Motivation
Traditionally, the design of aerospace structures relies on a deterministic design (code-based design) philosophy, in which safety factors (both explicit and implicit), conservative material properties, redundancy and certification testing are used to design against uncertainties. An example of explicit safety factor is the load safety factor of 1.5 (FAR 25-303), while the conservative decisions employed while updating the failure stress allowables based on structural element tests are examples for implicit safety factors. In the past few years, however, there has been growing interest in applying probabilistic methods to design of aerospace structures (e.g., Lincoln 1980, Wirsching 1992, Aerospace Information Report of SAE 1997, Long and Narciso 1999) to design against uncertainties by effectively modeling them.
Even though probabilistic design is a more efficient way of improving structural safety than deterministic design, many engineers are skeptical of probability of failure calculations of structural designs for the following reasons. First, data on statistical variability in material properties, geometry and loading distributions are not always available in full (e.g., joint distributions), and it has been shown that insufficient information may lead to large errors in probability calculations (e.g., Ben-Haim and Elishakoff 1990, Neal et al. 1992). Second, the magnitude of errors in calculating loads
and predicting structural response is not known precisely, and there is no consensus on how to model these errors in a probabilistic setting. As a result of these concerns, it is
2
possible that transition to probability based design will be gradual. An important step in this transition is to understand the way safety is built into aircraft structures now, via deterministic design practices.
One step taken in the transition to probabilistic design is in the definition of conservative material properties (A-basis or B-basis material property values depending on the failure path in the structure) by the Federal Aviation Administration (FAA) regulation (FAR 25.613). A-basis material property is one in which 99 percent of the material property distribution is better than the design value with a 95 percent level of confidence, and B-basis material property is one in which 90 percent of the material property distribution is better than the design value with a 95 percent level of confidence. The use of conservative material properties is intended to protect against variability in material properties.
In deterministic design the safety of a structure is achieved through safety factors. Even though some safety factors are explicitly specified, others are implicit. Examples of explicit safety factors are the load safety factor and material property knock-down values. The FAA regulations require a load safety factor equal to 1.5 for aircraft structures (FAR 25-303). The load safety factor compensates for uncertainties such as uncertainty in loading and errors in load calculations, structural stress analysis, accumulated damage, variations in material properties due to manufacturing defects and imperfections, and variations in fabrication and inspection standards. Safety factors are generally developed from empirically based design guidelines established from years of structural testing of aluminum structures. Muller and Schmid (1978) review the historical evolution of the load safety factor of 1.5 in the United States. Similarly, the use of A-basis or B-basis
material properties leads to a knock-down factor from the average values of the material properties measured in the tests. Note that these knock-down factors depend on the number of tests, because they compensate for both variability in material properties and uncertainty due to a finite number of tests.
As noted earlier, an important step in transition to probabilistic design is to analyze the probabilistic impact of the safety measures used in deterministic design. This probabilistic analysis requires quantification of uncertainties encountered in design, manufacturing and actual service conditions of the aircraft structures.
A good analysis of different sources of uncertainty in engineering modeling and simulations is provided by Oberkampf et al. (2000, 2002). These papers also supply good
literature reviews on uncertainty quantification and divide the uncertainty into three types: variability, uncertainty, and error. In this distinction, variability refers to aleatory uncertainty (inherent randomness), uncertainty refers to epistemic uncertainty (due to lack of knowledge), and error is defined as a recognizable deficiency in any phase or activity of modeling and simulation that is not due to lack of knowledge.
To simplify the treatment of uncertainty control, in this dissertation we combine the unrecognized (epistemic) and recognized error in the classification of Oberkampf et al.
and name it error. That is, we use a simple classification that divides the uncertainty in the failure of a structural member into two types: errors and variability. Errors reflect inaccurate modeling of physical phenomena, errors in structural analysis, errors in load calculations, or deliberate use of materials and tooling in construction that are different from those specified by the designer. Errors affect all the copies of the structural components made and are therefore fleet-level uncertainties. Variability, on the other
4
hand, reflects the departure of material properties, geometry parameters or loading of an individual component from the fleet-average values and hence are individual uncertainties.
Modeling and quantification of variability are much easier compared to that of error. Improvements in tooling and construction or application of tight quality control techniques can reduce variability. Quantification of variability control can be easily done by statistical analysis of records taken throughout process of quality control. However, quantification of errors is not as easy, because errors are largely not known before a structure is built. So, errors can only be quantified after the structure has been built. Errors can be controlled by improving accuracy of load and stress calculations, by using more sophisticated analysis and failure prediction techniques or by testing of structural components.
Testing of aircraft structural components is performed in a building block type of approach starting with material characterization tests, followed by testing of structural elements and including a final certification test. Testing of structures is discussed in detail in the next chapter.
The comparison of deterministic design and probabilistic design can be performed in many views. First of all, input and output variables of deterministic design are all deterministic values, while input and output variables of probabilistic design are random (along with some deterministic variables, of course). Here, on the other hand, we compare probabilistic design and deterministic design in terms of use of safety factors. In deterministic design uniform safety factors are used; that is, the same safety factor is used for all components of a system. However, probabilistic design allows using variable
safety factors through allowing risk and reliability allocation between different components. That is, instead of using the same safety factor for all components, probabilistic design allows to use higher factors for components or failure modes that can be controlled with low weight expenditure (Yang, 1989). This means the failure modes with small scatter and lightweight components. In addition, probabilistic design allows a designer to trade off uncertainty control for lower safety factors. That is, by reducing uncertainty, the designer can avoid using high safety factors in the design and thereby can reduce the weight of the structural system. This design paradigm allows the designer to allocate risk and reliability between different components in a rational way to achieve a safer design for a fixed weight compared to the deterministic design.
Objectives
There are two main objectives of this dissertation. The first is to analyze and compare the effectiveness of safety measure that improve structural safety such as safety factors (explicit or implicit), structural tests, redundancy and uncertainty reduction mechanisms (e.g., improved structural analysis and failure prediction, manufacturing quality control). The second objective is to explore the advantage of uncertainty reduction mechanisms (e.g., improved structural analysis and failure prediction, tighter manufacturing quality control) versus safety factors. That is, we consider the possibility of allocating the resources for reducing uncertainties, instead of living with the uncertainties and allocating the resources for designing the aircraft structures for the given uncertainties.
We aim to analyze the effectiveness of safety measures taken in deterministic design methodology and investigate the interaction and effectiveness of these safety measures with one another and also with uncertainties. In particular, the effectiveness of
6
uncertainty reduction mechanisms is analyzed and compared. The uncertainty reduction mechanisms considered in this dissertation are reduction of errors by improving the accuracy of structural analysis and failure prediction (analytically or through tests), and reduction of variability in failure stress as a result of tighter quality control.
We explore the optimal choice of additional company safety factors used on top of the FAA regulation safety factors by using probabilistic design, which provides a rational way in the analysis. Additional company safety factors we consider are the conservative decisions of aircraft companies while updating the allowable stresses based on the results of structural element tests.
We perform probabilistic design optimization for the case of limited statistical data on stress distribution and show that when the probabilistic design is achieved by taking the deterministic design as a starting point, the ratio of probabilities of failure of the probabilistic design and deterministic design is not sensitive to errors due to limited statistical data, which would lead to substantial errors in the probabilistic design if the probabilistic design starts from scratch. In addition, we propose a probabilistic design methodology in which the probability of failure calculation is confined only to stress limits, thereby eliminating the necessity for assessment of stress distribution that usually requires computationally expensive finite element analyses.
Methodology
Probability of failure calculation of structures can be performed by using either analytical techniques or simulation techniques. Analytical methods are more accurate but for complex systems they may not be practical. Simulation techniques include direct Monte Carlo simulation (MCS) as well as many variance-reduction methods including
stratified sampling, importance sampling, and adaptive importance sampling (Ayyub and McCuen 1995).
In probabilistic design of structures, the use of inverse reliability measures helps a designer to have an easy estimate of the change in structural weight from the values of probabilistic performance measure and its target value as well as computational advantages (Ramu et al. 2004). Amongst those measures we use probabilistic sufficiency
factor (PSF) developed by Qu and Haftka (2003).
Here we consider a simplified design problem for illustration purposes, so that the reliability analysis can be performed by analytical means. The effect of testing then can be analyzed by using Bayesian approach. The Bayesian approach has special importance in engineering design where the available information is limited and it is often necessary to make subjective decisions. Bayesian updating is used to obtain the updated (or posterior) distribution of a random variable upon combining the initial (or prior) distribution with new information about the random variable. The detailed theory and procedures for applying Bayesian methods in reliability and risk analysis can be found in texts by Morgan (1968) and Martz and Waller (1982).
Outline
A literature survey on the historical evolution of probabilistic design, comparison of deterministic design and probabilistic design practices, uncertainty control measures and testing of aircraft structures is given in Chapter 2.
Chapter 3 investigates the effects of error, variability, safety measures and tests on structural safety of aircraft. A simple example of point stress design and a simple error model are used to illustrate the effects of several safety measures taken in aircraft design: safety factors, conservative material properties, and certification tests. This chapter serves
8
as the opening chapter; therefore the analysis and the number of safety measures are kept at a minimum level. For instance, only certification tests are included in the analysis. The effects of coupon tests and structural element tests are delayed until Chapter 7. The simplifying assumptions in Chapter 3 allow us to perform analytical calculations for probability of failure and Bayesian updating. The interactions of the safety measures with one another and also with errors and variabilities are investigated. For instance, we find that the certification tests are most effective when errors are large and variabilities are small. We also find that as safety measures combine to reduce the probability of failure, our confidence in the probability of failure estimates is reduced.
Chapter 4 extends the analysis presented in Chapter 3 by delivering the following refinements. The effectiveness of safety measures is compared with one another in terms of safety improvement and weight savings. Structural redundancy, a safety measure which is omitted in Chapter 3, is also included in the analysis. The simple error model used in Chapter 3 is replaced with a more detailed error model in which we consider individual error components in load calculation, stress calculation, material properties and geometry parameters including the effect of damage. The analysis in Chapter 4 enables us to discover that while certification testing is more effective than increased safety factors for improving safety, it cannot compete with even a small reduction in errors. We also find that variability reduction is even more effective than error reduction.
Realizing in Chapter 4 how powerful uncertainty reduction mechanisms are, we analyze the tradeoffs of uncertainty reduction mechanisms, structural weight and structural safety in Chapters 5 and 6. The effect of error reduction (due to improved failure prediction model) on increasing the allowable flight loads of existing aircraft
structures is investigated in Chapter 5. The analysis is performed for a sandwich panel because the improved model is developed by Prof. Bhavani Sankar (co-chair of the advisory committee for this dissertation) so that we had good access to the details of experiments and computations. We find that the improved modeling can increase the allowable load of a sandwich panel on average by about 13 percent without changing the safety level of the panel when deterministic design principles is followed. The use of probabilistic design is found to double the load increase.
Similarly to improvements of accuracy in failure predictions, the improvements in the accuracy of structural analysis also lead to error reduction. The improved structural analysis through taking the chemical shrinkage of composite laminates is considered as the error reduction mechanism in Chapter 6. The work by Qu et al. (2003), which
explored the effect of variability reduction through quality control, is extended in Chapter 6 to investigate the tradeoffs of error and variability reduction mechanisms for reducing the weight of the composite laminates at cryogenic temperatures. Tradeoff plots of uncertainty reduction mechanisms, probability of failure and weight are generated that enable a designer to choose the optimal uncertainty control mechanism combination to reach a target probability of failure with minimum cost.
Chapter 7 finalizes the analysis of effects of explicit and implicit knockdown factors and uncertainty control mechanisms. In particular, Chapter 7 analyzes the optimal choice of the knockdown factors. These knockdown factors refer to conservative decisions of aircraft companies in choice of material properties and while updating the allowable stresses based on the results of structural element tests. We find that instead of using implicit knockdown factors based on worst-case scenarios (current practice), using
10
test-dependent explicit knockdown factors may lead weight savings. Surprisingly, we find that a more conservative knockdown factor should be used if the failure stresses measured in tests exceeds predicted failure stresses in order to reduce the variability in knockdown factors generated by variability in material properties. In addition, the effects of coupon tests, structural element tests and uncertainty control mechanisms (such as error reduction by improved structural modeling or improved failure prediction, variability reduction by tighter quality control) on the choice of company safety factors are investigated. Using a simple cost function in terms of structural weight, we show that decisions can be made whether to invest resources on coupon tests, structural element tests, uncertainty reduction mechanisms or extra structural weight.
The analyses presented in Chapters 3-7 show how probabilistic design can be exploited to improve aircraft structural safety by allowing a rational analysis of interactions of safety and knockdown factors and uncertainty reduction mechanisms. There are, however, two main reasons for reluctance of engineers for pursuing the probabilistic design: the sensitivity of probabilistic design to limited statistical data and computational expense associated to the probabilistic design. Besides, Chapters 3-7 include analyses of a single aircraft structural component, so in Chapter 8 the probabilistic design of an aircraft structural system is presented. We show in Chapter 8, by use of probabilistic design of a representative wing and tail system, that errors due to limited statistical data affect the probability of failure of both probabilistic and deterministic designs, but the ratio of these probabilities is quite insensitive to even very large errors. In addition, to alleviate the problem of computational expense, a probabilistic design optimization method is proposed in which the probability of failure
calculation is limited to failure stresses to dispense with most of the expensive structural response calculations (typically done via finite element analysis). The proposed optimization methodology is illustrated with the design of the wing and tail system. Chapter 8 reveals that the difference between probabilistic design and deterministic design is a small perturbation, which can be achieved by choosing the additional knockdown factors through probabilistic design, instead of choosing them based on experience. In addition, the proposed approximate method is found to lead to similar re-distribution of material between structural components and similar system probability of failure.
Finally, the dissertation culminates with Chapter 9, where the concluding remarks are listed.
CHAPTER 2 LITERATURE REVIEW
The literature review in this chapter first compares deterministic and probabilistic design methodologies. Then, we review structural safety analysis, followed by probability of failure estimation techniques. Next, reliability-based design optimization is reviewed. Then, uncertainty classifications available in the literature are discussed followed by our simplified classification based on simplifying the analysis of uncertainty reduction measures. Finally, the utilization of structural tests in probabilistic design is reviewed.
Probabilistic vs. Deterministic Design
Aircraft structural design still relies on the Federal Aviation Administration (FAA) deterministic design code. In deterministic design, conservative material properties are used and safety factors are introduced to protect against uncertainties. The FAA regulations (FAR-25.613) state that conservative material properties are characterized as A-basis or B-basis values. Detailed information on these values was provided in Chapter 8 of Volume 1 of Composite Materials Handbook (2002). The safety factor compensates for uncertainties such as uncertainty in loading and errors in load calculations, errors in structural stress analysis and accumulated damage, variations in material properties due to manufacturing defects and imperfections, and variations in fabrication and inspection standards. Safety factors are generally developed from empirically based design guidelines established from years of structural testing and flight experience. In transport aircraft design, the FAA regulations state the use of safety factor of 1.5 (FAR-25.303).
Muller and Schmid (1978) reviewed the historical evolution of the 1.5 factor of safety in the United States.
On the other hand, probabilistic design methodology deals with uncertainties by the use of statistical characterization of uncertainties and attempts to provide a desired reliability in the design. The uncertainties of individual design parameters and loads are modeled by appropriate probability density functions. The credibility of this approach depends on several factors such as the accuracy of the analytical model used to predict the structural response, the accuracy of the data and the probabilistic techniques employed. Examples of the use of probabilistic design in aerospace applications include the following.
Pai et al. (1990, 1991 and 1992) performed probabilistic structural analysis of
space truss structures for a typical space station. Murthy and Chamis (1995) performed probabilistic analysis of composite aircraft structure based on first ply failure using FORM*. The probabilistic methodology has shown some success in the design of composite structures where parameter uncertainties are relatively well known. For example, the IPACS (Integrated Probabilistic Assessment of Composite Structures) computer code was developed at NASA Glenn Research Center (Chamis and Murthy 1991). Fadale and Sues (1999) performed reliability-based design optimization of an integral airframe structure lap joint. A probabilistic stability analysis for predicting the buckling loads of compression loaded composite cylinders was developed at Delft University of Technology (Arbocz et al. 2000).
14
Although probabilistic design methodology offers the potential of safer and lighter designs than deterministic design, transition from deterministic design to probabilistic design is difficult to achieve. Zang et al. (2002) discussed the reasons for this difficulty,
and some of these reasons are given below.
• Industry feels comfortable with traditional design methods.
• Few demonstrations of the benefits of probabilistic design methods are available. • Current probabilistic design methods are more complex and computationally
expensive than deterministic methods.
• Characterization of structural imperfections and uncertainties necessary to facilitate accurate analysis and design of the structure is time-consuming and is highly dependent on structural configuration, material system, and manufacturing processes.
• Effective approaches for characterizing model form error are lacking.
• Researchers and analysts lack training in statistical methods and probabilistic assessment.
Structural Safety Analysis
In probabilistic design, the safety of a structure is evaluated in terms of its probability of failure Pf. The structures are designed such that the probability of failure of the structure is kept below a pre-specified level. The term reliability is defined in terms of probability of failure such that
1 f
Reliability= −P (2.1)
A brief history of development of the methods for probability of failure calculation for structures was presented in a report by Wirsching (1992). As Wirsching noted, the development of theories goes back some 50 to 60 years.
The modern era of probabilistic design started with the paper by Fruedenthal (1947). Most of the ingredients of structural reliability such as probability theory,
statistics, structural analysis and design, quality control existed prior to that time; however, Fruedenthal was the first to put them together in a definitive and compressive manner. The development of reliability theory progressed in 1950s and 1960s. There are three cornerstone papers in 1960’s. The first one is the paper by Cornell (1967), who suggested the use of a second moment method and demonstrated that Cornell’s safety index could be used to derive set of factors on loads and resistance. However, Cornell’s safety index had a problem of invariance in that it was not constant when the problem was reformulated in a mechanically equivalent way. Hasofer and Lind (1974) defined a generalized safety index which was invariant to mechanical formulation. The third paper is the one by Turkstra (1970), who presented structural design as a problem of decision making under uncertainty and risk. More recent papers are sophisticated extensions of these papers, and some of them are referenced in the following sections.
Probability of Failure Estimation
This section reviews the literature on probability of failure estimation. First, analytical calculation of probability of failure is discussed, followed by moment-based methods and simulation techniques.
Analytical calculation of probability of failure
In its most general form, the probability of failure can be expressed as
( )
∫
≤∫
= X x x x f d P G f 0 ) (L (2.2)where G x
( )
is the limit-state function whose negative values corresponds to failure and( )
fX x is the joint probability density function for the vector X of random variables. The
16
(Melchers 1999). First, the joint probability density function fX
( )
x is not always readilyobtainable. Second, for the cases when fX
( )
x is obtainable, the integration over thefailure domain is not easy. The calculation of probability of failure can be made more tractable by simplifying (1) the limit-state definition, (2) the integration process, and (3) the integrand fX
( )
x .Moment-based techniques
When the calculation of limit-state is expensive, moment-based techniques such as First Order Reliability Method (FORM) or Second Order Reliability Method (SORM) are used (Melchers, 1999). The basic idea behind these techniques is to transform the original random variables into a set of uncorrelated standard normal random variables, and then approximate the limit-state function linearly (FORM) or quadratically (SORM) about the most probable failure point (MPP). The probability of failure of the component is estimated in terms of reliability index β such that
( )
−βΦ =
f
P (2.3)
where Φ is the cumulative distribution function of a standard normal variable.
The first paper on the use of FORM is probability of failure calculation appears to be Hasofer and Lind’s (1974). There exist enormous amount of papers on the use of FORM. The pioneer papers include Rackwitz and Fiessler (1978), Hohenbichler and Rackwitz (1983), Gollwitzer and Rackwitz (1983).
FORM is usually accurate for limit state functions that are not highly nonlinear. SORM has been proposed to improve the reliability estimation by using a quadratic approximation of the limit state surface. Some papers on the use of SORM include
Fiessler et al. (1979), Breitung (1984), Der Kiureghian et al. (1987), Hohenbichler et al.
(1987), Der Kiureghian and De Stefano (1991), Koyluoglu and Nielsen (1994) and Zhao and Ono (1999).
Simulation techniques
For most problems the number of variables in the problem definition is high, so the analytical calculation of the integral in Eq. (2.2) requires challenging multidimensional integration. Also the moment based approximations gives inaccurate results for high number of random variables (Melchers 1999). Under such conditions, simulation techniques such as Monte Carlo simulations (MCS) are used to compute the probability of failure.
In MCS technique, samples of the random variables are generated according to their probabilistic distributions and then failure condition is checked. The probability of failure Pf can be estimated by
N N
Pf = f (2.4)
where Nf is the number of simulations leading to failure and N is the total number of simulations. The statistical accuracy of the probability of failure estimation is commonly measured by its coefficient of variation c o v P as . . .
( )
f(1 ) (1 ) . . .( ) f f f f f f P P P N c o v P P N P − − = = (2.5)
From Eqs. (2.4) and (2.5) it is seen that a small probability of failure will require a very large number of simulations for acceptable accuracy. This usually results in an increase in computational cost. When limit-state function calculations are obtained
18
directly from analysis, then computational cost of MCS is not sensitive to the number of variables. When surrogate models are used, on the other hand, the computational cost of MCS is dependent on the number of variables. To overcome the deficiency of MCS, several more efficient alternative sampling methods are introduced. Ayyub and McCuen (1995) supplied basic information and good references for these sampling techniques. Some useful references taken from Ayyub and McCuen (1995) are the followings: Importance sampling (Madsen et al., 1986, Melchers, 1989), stratified sampling (Law
and Kelton 1982, Schuller et al. 1989), Latin hypercube sampling (Iman and Canover
1980, Ayyub and Lai 1989), adaptive importance sampling (Busher 1988, Karamchandani et al. 1989, Schuller et al. 1989), conditional expectation (Law and
Kelton 1982, Ayyub and Haldar 1984), antithetic variates (Law and Kelton 1982, Ayyub and Haldar 1984).
In this study, we mainly deal with problems with simple limit-state functions. For these simple cases the integrand fX
( )
x can easily be obtained when the randomvariables are statistically independent. The beneficial properties of normal and lognormal distributions are utilized for the variables with small coefficients of variations. Approximate analytical calculations of probability of failure are checked with Monte Carlo simulations to validate the acceptability of assumptions. When limit-state functions are complex, Monte Carlo simulations are used to calculate the probability of failure.
Separable Monte Carlo simulations
As noted earlier, when estimating very low probabilities, the number of required samples for MCS can be high, thus MCS becomes a costly process. In most structural problems, the failure condition may be written as response exceeding capacity. When the
response and capacity are independent, it may be possible to analyze them separately with a moderate sample size, and still be able to estimate very low probabilities of failure. This is due to the fact that most failures do not involve extreme values of response or capacity but instead moderately high response along with moderately low capacity. Therefore, to bypass the requirement of sampling the extreme tail of the limit-state function, the variables could be considered independently, by separating the response and the capacity, as discussed by Melchers (1999, Chapter 3). A good analysis of efficiency and accuracy of separable Monte Carlo simulations can be found in Smarslok et al.
(2006).
The common formulation of the structural failure condition is in the form of a stress exceeding the material limit. This form, however, does not satisfy the separability requirement. For example, the stress depends on variability in material properties as well as design area, which reflects errors in the analysis process. In that case, the limit-state function can still be re-formulated in a separable form. In this dissertation we re-write the limit-state in terms of the required area (depends only on variabilities) and built area (depends only on errors) to bring the limit state to separable form (see Chapter 4).
Response surface approximations
Response surface approximations (RSA) can be used to obtain a closed-form approximation to the limit state function to facilitate reliability analysis. Response surface approximations usually fit low-order polynomials to the structural response in terms of random variables. The probability of failure can then be calculated inexpensively by Monte Carlo simulation or by FORM or SORM using the fitted polynomials.
Response surface approximations can be applied in different ways. One approach is to construct local response surfaces in the MPP region that contributes most to the
20
probability of failure of the structure. Bucher and Bourgund (1990), Rajashekhar and Ellingwood (1993), Koch and Kodiyalam (1999), Das and Zheng (2000a, 2000b) and Gayton, Bourinet and Lemaire (2003) used local response surfaces.
Another approach is to construct global response surface over the entire range of random variables. The examples include Fox (1994, and 1996), Romero and Bankston (1998), Qu et al. (2003), Youn and Choi (2004) and Kale et al. (2005).
Reliability-Based Design Optimization
Design optimization under a probability of failure constraint is usually referred as reliability-based design optimization (RBDO). The basic structure of an RBDO problem is stated as et t P P t s f arg . . min ≤ (2.6)
where f is the objective function (for most problems it is weight), and P and Ptarget are the probabilistic performance function and the target value for it. The probabilistic performance function can be probability of failure Pf, reliability index β or an inverse reliability measure such as probabilistic sufficiency factor, PSF.
Double loop (Nested) RBDO
Conventional RBDO approach is formulated as a double-loop optimization problem, where an outer loop performs the design optimization, while an inner loop optimization is also used for estimating probability of failure (or another probabilistic performance function). The reliability index approach (RIA) is the most straightforward approach. In RIA, the probability of failure is usually calculated via FORM, which is an iterative process an so computationally expensive and sometimes troubled by
convergence problems (Tu et al. 1999). To reduce the computational cost of double loop
approach, various techniques has been proposed, which can be divided into two categories: (i) techniques that improve the efficiency of uncertainty analysis methods, such as the methods of fast probability integration (Wu 1994) and two-point adaptive nonlinear approximations (Grandhi and Wang 1998); (ii) techniques that modify the formulation of probabilistic constraints, for instance, using inverse reliability measures, such as the performance measure approach (Tu et al. 1999), probabilistic sufficiency
factor (Qu and Haftka 2003).
Inverse reliability measures are based on margin of safety or safety factors, which are safety measures in deterministic design. The safety factor is usually defined as the ratio of structural resistance (e.g., failure stress) to structural response (e.g., stress). Safety factors permit the designer to estimate the change in structural weight to satisfy a target safety factor requirement. In probabilistic design, however, the difference between the probabilistic performance measure and its target value does not provide the designer with an estimate of the required change in structural weight. Inverse safety measures thus help the designer to easily estimate the change in structural weight from the values of probabilistic performance measure and its target value and the inverse safety measures also improve the computational efficiency (Qu and Haftka 2004). A good analysis and survey on safety factor and inverse reliability measures was presented by Ramu et al.
(2004).
Single loop RBDO
Single loop formulation avoids nested loops of optimization and reliability assessment. Some single loop formulations are based on formulating the probabilistic constraints as deterministic constraints by either approximating the Karush-Kuhn-Tucker
22
conditions at the MPP or defining a relationship between probabilistic design and safety factors of deterministic design (e.g., Chen et al. 1997, Kuschel and Rackwitz 2000, Wu et al. 2001, Qu et al. 2004, Liang et al. 2004). Single loop formulation increases the
efficiency by allowing the solution to be infeasible before convergence and satisfying the probability constraints only at the optimum. There exist also singe loop formulations that performs optimization and reliability assessment sequentially (e.g., Royset et al. 2001,
Du and Chen 2004). Sequential optimization and reliability assessment (SORA) of Du and Chen (2004), for instance, decouples the optimization and reliability assessment by separating each random design variable into a deterministic component, which is used in a deterministic optimization, and a stochastic component, which is used in reliability assessment.
Error and Variability Uncertainty Classification
Over years researchers proposed many different classifications for uncertainty. For instance, Melchers (1999) divided uncertainty into seven types: phenomenological uncertainty, decision uncertainty, modeling uncertainty, prediction uncertainty, physical uncertainty, statistical uncertainty and human error. Haimes et al. (1994) and Hoffman
and Hammonds (1994) distinguished uncertainty into two types: uncertainty (epistemic part) and variability (aleatory part). Epistemic uncertainties arise from lack of knowledge about the behavior of a phenomenon. They may be reduced by review of literature, expert consultation, close examination of data and further research. Tools such as scoring system, expert system and fish-bone diagram can also help in reducing epistemic uncertainties. Aleatory uncertainties arise from possible variation and random errors in