ECS Transactions
Reduced Graphene Oxide-MWCNT Organogel Foam for Lithium-Sulfur
Battery Cathode
To cite this article: Elif Vargun et al 2019 ECS Trans. 95 81
Reduced Graphene Oxide-MWCNT Organogel Foam for Lithium-Sulfur Battery Cathode
E. Varguna,b, H. Feia, G. Wangc, Q. Chenga,c, J. Vilcakovaa, M. Jurcaa, E. Domincova Bergerovaa, N. E. Kazantsevaa, P. Sahaa
a
Sino-EU Joint Laboratory of New Energy Materials and Devices, Centre of Polymer Systems, Tomas Bata University in Zlin, Tř. T. Bati 5678, 76001 Zlin, Czech Republic
b
Department of Chemistry, Mugla Sitki Kocman University, Kotekli,48000, Mugla, Turkey
c
Key Laboratory for Ultrafine Materials of Ministry of Education, School of Materials Science and Engineering, East China University of Science and Technology, Shanghai
200237, China
The fabrication of self-standing porous carbon foam nanostructures for trapping sulfur in Lithium–Sulfur (Li-S) batteries was aimed in this work. Nitrogen doped reduced graphene oxide/acid treated MWCNT based cathode material was prepared and characterized by different techniques. The GO/aMWCNT organofoam nanostructures were first polymerized in-situ with aniline and pyrrole and then carbonized at 800°C under argon atmosphere. The purpose of the carbonization was to improve the conductivity of the carbon matrix and dope it with nitrogen using PANI and PPy as a nitrogen source. N-doped rGO/aMWCNT foams exhibited the three dimensional porous network morphology and high conductivity (3.06 S.cm-1). The sulfur was infiltrated to the foams by melt diffusion method and the highest sulfur content of the rGO/aMWCNT-S composite was found as 61.3 wt. %.
Introduction
Recent efforts have been devoted to the development of various carbon-based sulfur electrodes with meso/micro/hierarchical porous carbon (1-3), carbon black (4), carbon nanotubes/nanofibers (5,6) and graphene (7) for Lithium-sulfur (Li-S) batteries. The overall performance of sulfur–carbon cathodes is directly related with the morphology, chemistry and electrochemistry of carbon–sulfur composites. The different kinds of carbons demonstrate the different stability, capacity and conductivity (8). Among them the self-supporting porous graphene foam with high conductivity and 3D pore structure is a promising cathode material to ensure the efficient Li-ion transport and to accommodate the active material.
Wang and co-workers adopted the self-supporting graphene/acid-treated multi-walled carbon nanotube organic foam-supported sulfur (oGCTF@S) composites for high performance Li-S battery (9). The sulfur was in-situ electrodeposited into the oGCTF and the composite ensured for accommodating volume change of sulfur and confine dissolution of the polysulfides by physical adsorption. The graphene-aMWCNT hybrid structure was also modified with 1,5-diaminoanthraquinone (DAA) by the same group. The oGCTF@PDAA cathode exhibited high discharge capacity (289 mAh g-1 at 30 mA
g-1), good rate capability (retain 122 mAh g-1 even at 10 A g-1) and cycling stability (85.2% capacity retention after 2000 cycles) (10).
This paper reports on fabrication and characterization of self-supporting cathode based on the nitrogen doped-reduced graphene oxide/acid treated MWCNT-sulfur (rGO/aMWCNT-S) composite. The GO/aMWCNT organo-foam was prepared by solvothermal technique and then polymerized in-situ with aniline and pyrrole monomers to obtain GO/aMWCNT@PANI and GO/aMWCNT@PPy nanostructures, respectively. The morphologies of foams were analyzed by SEM and the formation of PANI and PPy were detected by FTIR. The foams were subsequently carbonized under argon atmosphere to obtain N-doped rGO/aMWCNT and the nitrogen contents were determined by elemental analysis. Also, the conductivity of the foams was measured before and after carbonization. Afterwards, the rGO/aMWCNT-S composites were loaded with sulfur by melt diffusion method. The sulfur content in the composites was determined by the TGA method.
Experimental
Preparation of the rGO/aMWCNT-S Composites
Graphene oxide (GO) was synthesized from natural graphite powder (< 20 µm, Sigma-Aldrich) by a modified Hummers’ method. The aMWCNT was prepared via mixed acid (HNO3:H2SO4, 1:3) treatment of MWCNT. The GO and 10% aMWCNT were
mixed in N,N-dimethylacetamide (DMAc) in two different concentrations (4.5 mg/g, 7.0 mg/g) and GO/aMWCNT organo-gels were prepared in autoclaves at 180°C for 15 hours. The cylindrical GO/aMWCNT foams were sliced into disks and then were cleaned by deionized water. Afterwards, the disk was soaked into 3% and 6 % Aniline (or Pyrrole) monomer and in-situ polymerization was conducted in perchloric acid (HClO4) aqueous
solution by adding ammonium persulfate (APS) aqueous solution dropwisely at 0°C for 24h. The as-prepared GO/aMWCNT@PANI and GO/aMWCNT@PPy nanostructures were first freeze dried and then carbonized at 800°C for 2 hours under argon atmosphere. The obtained N-doped rGO/aMWCNT foams were loaded with sulfur (C:S ratio is 1:2) by melt diffusion technique by heating the carbon foams and sulfur at 155°C in autoclave under argon for 12 h.
Characterization of the rGO/aMWCNT-S Composites
The chemical structures of GO/aMWCNT@PANI and GO/aMWCNT@PPy foams were identified by ATR-FTIR spectroscopy and the pore morphologies were characterized by scanning electron microscopy (SEM). The nitrogen content of the foams was ascertained by elemental analysis and also compared with the SEM-EDAX results. The sulfur content in the composites was determined by TGA analysis on TGA Q50 TA Instrument with a 10°C/min heating rate under nitrogen atmosphere. The conductivity measurements were done by four-point method using van der Pauw setup.
Results and Discussion
The homogeneous DMAc colloidal solutions of GO and aMWCNT were prepared in two different concentrations of 4.5 mg/g and 7.0 mg/g (the mass ratio of GO to aMWCNT was 90/10). Also, the two different aniline and pyrrole monomer concentrations (3% and 6% w/w) were used during the in-situ polymerizations of organo-gels. The effects of organogel carbon concentration and the monomer concentration on the conductivity were investigated.
ATR-FTIR Spectroscopy
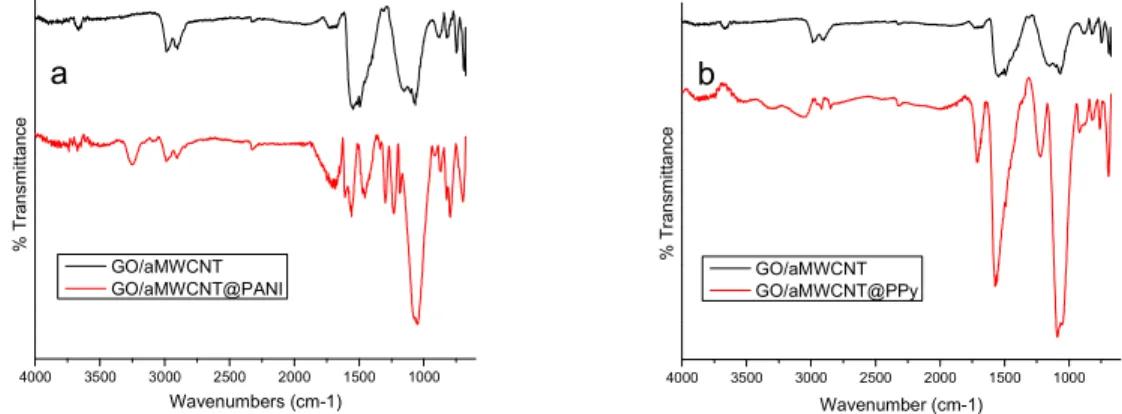
In-situ polymerization of GO/aMWCNT foams with aniline and pyrrole were performed and the chemical structures of GO/aMWCNT@PANI and GO/aMWCNT@PPy foams were analyzed by FTIR spectroscopy and the spectrum is given in Figure 1a and 1b, respectively. The IR peak at 3251 cm-1 is attributed to N-H vibrations and the peak specific to C=N vibrations and C=C bond vibrations are observed at 1696 cm-1 and 1610 cm-1, respectively. Also, the characteristic C-N bond vibrations (1294, 1226 cm-1) are observed for PANI. Figure 1b showed the characteristic polypyrrole-originated IR bands such as N-H stretching of pyrrole ring (3305, 3057 cm-1), C=C stretching (1574 cm-1) and C-N in-plane deformations (1226 cm-1). The new IR bands assigned to both PANI and PPy indicated that PANI and PPy chains were doped in GO/aMWCNT systems by in-situ polymerization successfully.
4000 3500 3000 2500 2000 1500 1000 % T ra n s m it ta n c e Wavenumbers (cm-1) GO/aMWCNT GO/aMWCNT@PANI a 4000 3500 3000 2500 2000 1500 1000 % T ra n s m it ta n c e Wavenumber (cm-1) GO/aMWCNT GO/aMWCNT@PPy b
Figure 1. FTIR spectra of (a)GO/aMWCNT@PANI and (b)GO/aMWCNT@PPy foams
DC Conductivity
The electrical conductivities of GO/aMWCNT@PANI and GO/aMWCNT@PPy foams are presented in Table 1. The effects of organogel carbon concentration and the monomer concentration on the DC conductivity were studied. First, the increase of the carbon concentrations in organo-gels from 4.5 mg/ to 7.0 mg/g didn’t lead to considerable increase of the conductivity. Also, the increase in monomer (aniline and pyrrole) concentrations from 3% to 6% (w/w) changed the conductivity of the organogel foams a little. However, the carbonization of the foams at 800°C under argon atmosphere improved the DC conductivity of both GO/aMWCNT@PANI and GO/aMWCNT@PPy
foams. The conductivity of GO/aMWCNT(4.5)@PPy(3) after carbonization can reach up to 3.06 S⋅cm-1, which is nine times higher than that of foam before carbonization (0.33 S⋅cm-1). During the carbonization, oxygenated functional groups were effectively removed and p-conjugated domains were restored. As a result of this thermal reduction the obtained nitrogen-doped reduced graphene oxide/aMWCNT (rGO/ aMWCNT) nanostructures exhibited sufficiently high conductivity.
TABLE I. Conductivities of foams before and after carbonization.
Samples Codes Before Carbonization [S/cm] After Carbonization [S/cm]
GO/aMWCNT (4.5) @PANI(3) 0.11±0.12 2.43±0.01 GO/aMWCNT (4.5) @PPy(3) 0.33±0.09 3.06±0.01 GO/aMWCNT (4.5) @PANI(6) 0.34±0.21 1.66±0.34 GO/aMWCNT (4.5) @PPy(6) 0.06±0.01 0.41±0.17 GO/aMWCNT (7.0) @PANI(3) 0.02±0.29 0.46±0.30 GO/aMWCNT (7.0) @PPy(3) 0.22±0.33 1.03±0.42
Nitrogen Content Determination of Foams by Elemental Analysis and SEM-EDAX It is known that nitrogen doped carbon host improves the performance and stability of Li-S batteries because of the polysulfides confinement (11-13). Hence, the in-situ inclusion of nitrogen into the organogel foam structure was employed by using PANI and PPy as a nitrogen source during carbonization. The carbonization process was not only used for DC conductivity improvement, but also for the nitrogen doping purpose by using PANI and PPy precursors. Table II represents the average nitrogen contents of the N-doped rGO/aMWCNT foams. The nitrogen atoms percentages were determined from elemental analysis and SEM-EDAX. The GO/aMWCNT (7.0) @PPy(3) sample exhibited the highest nitrogen doping level according to the results of elemental analysis and SEM-EDAX results. However, the aniline or pyrrole monomer concentrations (3% and 6%) didn’t affect the nitrogen levels of the rGO/aMWCNT foams.
TABLE II. Average values of nitrogen atoms percentages (N%) obtained by elemental analysis and
SEM-EDAX Samples Codes a N% b N% GO/aMWCNT (4.5) @PANI(6) 6.40 10.73 GO/aMWCNT (4.5) @PPy(6) 5.58 8.28 GO/aMWCNT (7.0) @PANI(3) 5.39 10.56 GO/aMWCNT (7.0) @PPy(3) 8.87 11.36 a. by elemental analysis b. by SEM-EDAX analysis ECS Transactions, 95 (1) 81-87 (2019)
Morphology of rGO/aMWCNT Foams: SEM Analysis
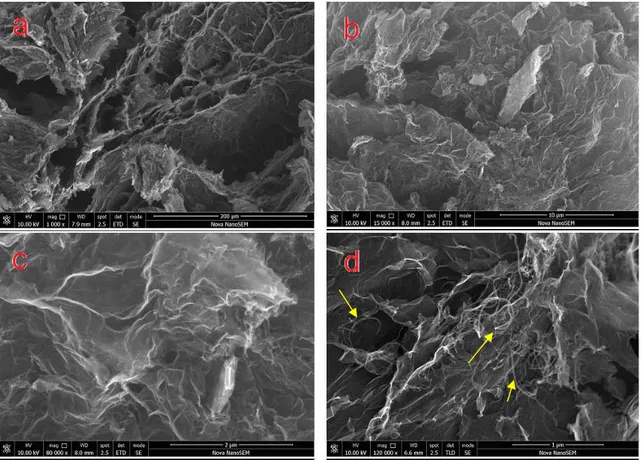
The morphology of N-doped rGO/aMWCNT foams were characterized by SEM. As can be seen from the images given in Figure 2, rGO layers exhibited 3D porous structure. Besides, aMWCNTs are evenly distributed in the wrinkled rGO nanosheets. In addition, the aMWCNTs contribute to the improvement of the surface area and the porous structure by introducing into the rGO thin layers (Figure 2d).
Figure 2. SEM images of rGO/aMWCNT foams (a) 1kx, (b) 15kx, (c) 80kx, (d) 120kx
Thermogravimetric Analysis (TGA)
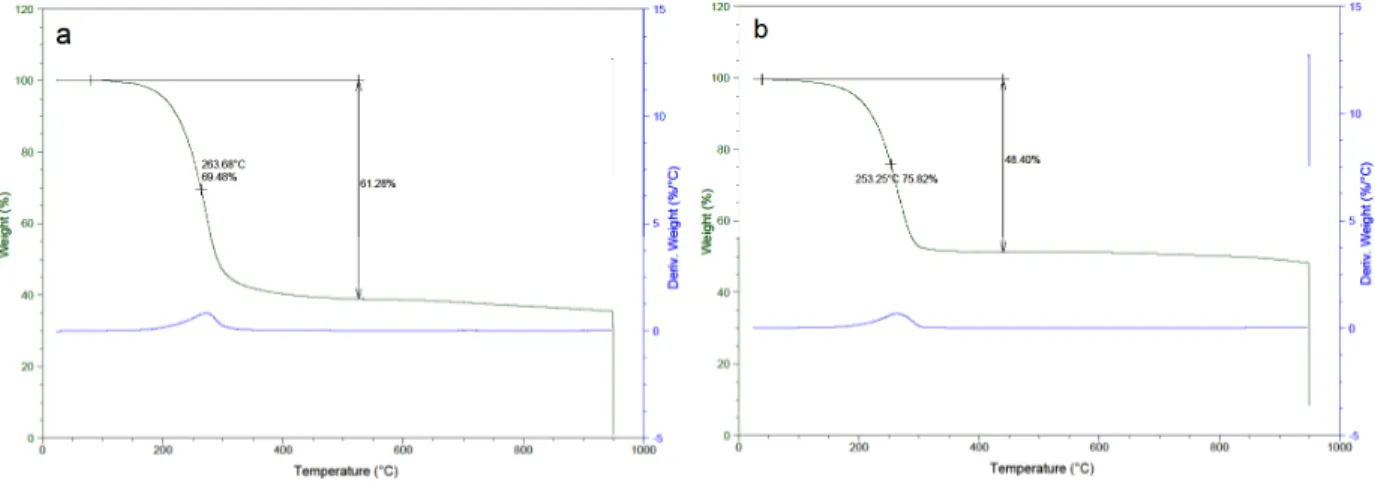
The N-doped rGO/aMWCNT-S nanocomposites were prepared by melt-diffusion method. The elemental sulfur was mixed with the rGO/aMWCNT foam with a mass ratio of 2:1. Afterwards, the mixture was heated at 155°C in autoclave for melted sulfur diffuse into the pores of 3D rGO/aMWCNT foam structure. The sulfur contents in the nanocomposites were determined by TGA as given in Figure 3. The sulfur degradation started at around 140 °C and the main degradation temperature (the value of temperature at the maximum of the peak) was seen at 263°C and 253°C in Figure 3a and 3b, respectively. The sulfur content of N-doped rGO/aMWCNT-S nanocomposite which was prepared from the GO/aMWCNT(4.5)@PANI(3) foam was found as 61.3 wt.% (Figure 3a). Also, the loaded sulfur level of N-doped carbon/sulfur nanocomposite (prepared from GO/aMWCNT(4.5)@PPy(3)) was found as 48.4 wt.% (Figure 3b).
Figure 3. TGA thermograms of N-doped rGO/aMWCNT-S nanocomposites prepared from a. GO/aMWCNT(4.5)@PANI(3) foam, b. GO/aMWCNT(4.5)@PPy(3),
Conclusions
Self-supporting porous N-doped rGO/aMWCNT-S nanocomposites were fabricated as a cathode material for Li-S batteries.
The cathode fabrication technology includes four steps: the synthesis of organogel foam based on GO and aMWCNT, the introduction of PANI and PPy as a nitrogen source into it, the carbonization of as prepared composite and its loading with sulfur via melt-diffusion technique.
According to the results obtained, the highest nitrogen content (8.87 wt.%) was found for GO/aMWCNT(7.0)@PPy(3) and thus its carbonization insured a high electrical conductivity of about 3.06 S⋅cm-1. However, the maximum sulfur content (61.3 wt.%) was reached for N-doped rGO/aMWCNT-S nanocomposite originated from GO/aMWCNT(4.5)@PANI(3).
Based on the results obtained, further optimization of technology is required. There is strong probability that the improvement of sulfur loading efficiency may provide a better cathode material for Li-S battery applications.
Acknowledgments
This work was supported by the Ministry of Education, Youth, and Sports of the Czech Republic (project no. LTACH17015), NPU Program I (LO1504) and Operational Program Research and Development for Innovations co-funded by the European Regional Development Fund (ERDF) and national budget of the Czech Republic, within the framework of the CPS – strengthening research capacity (reg. number: CZ.1.05/2.1.00/19.0409), as well as by National Key R&D Program of China (2016YFE0131200).
References
1. Z. W. Seh, Y. Sun, Q. Zhang and Y. Cui, Chem. Soc. Rev., 45, 5605 (2016). 2. D. W. Wang, G. M. Zhou, F. Li, K. H. Wu, G. M. Lu, H.M. Cheng and I. Gentle,
Phys. Chem. Chem. Phys. 14, 8703 (2012).
3. T. Zhang, H. Li, Q. Tang, M. Sun and G. Wang, J. Solid State Electrochem. 20, 2169 (2016).
4. X. Li, X. Li, M.N. Banis, B. Wang, A. Lushington, X. Cui, R. Li, T.-K. Shamb and X. Sun, J. Mater. Chem. A, 2, 12866 (2014).
5. H. Li, L. Sun and G. Wang, ACS Appl. Mater. Interfaces 8, 6061 (2016). 6. H. J. Peng, J. Q. Huang and Q. Zhang, Chem. Soc. Rev., 46, 5237 (2017).
7. G. Zhou, S. Pei, L. Li, D.-W. Wang, S. Wang, K. Huang, L.-C. Yin, F. Li and H.-M. Cheng, Adv. Mater. 26, 625 (2013),
8. D.-W. Wang, Q. Zeng, G. Zhou, L. Yin, F. Li, H.-M. Cheng, I. R. Gentle and G. Q. M. Lu, J. Mater. Chem. A, 1, 9382 (2013).
9. L. Sun, H. Li, M. Zhao and G. Wang, Chemical Engineering Journal 332, 8 (2018).
10. M. Sun, H. Li, J. Wang and G.Wang, Carbon 94, 864 (2015). 11. X. Li and Xueliang Sun, Front. Energy Res., 2, 49 (2014).
12. X.-G. Sun, X. Wang, R. T. Mayes and S. Dai, ChemSusChem, 5, 2079 (2012).
13. F. Sun, J. Wang, H. Chen, W. Li, W. Qiao, D. Long and L. Ling, ACS Appl.


