CANKAYA UNIVERSITY
GRADUATE SCHOOL OF SOCIAL SCIENCES DEPARTMENT OF ECONOMICS
MASTER’S THESIS
THE RELATIONSHIP BETWEEN TOURISM AND ECONOMIC GROWTH: AN EMPIRICAL EVIDENCE FROM THE GAMBIA
MODOU BEYAI
iv ABSTRACT
THE RELATIONSHIP BETWEEN TOURISM AND ECONOMIC GROWTH: AN EMPIRICAL EVIDENCE FROM THE GAMBIA
MODOU BEYAI Master’s thesis
Graduate school of social sciences Msc. Financial Economics Supervisor: Prof. Dr. Mehmet Yazıcı
September 2018
The aim of this thesis is to empirically check the relationship between economic growth and international tourism. We employed the Bound testing methodology and Autoregressive Distributive Lags (ARDL) in order to check the nexus between the two variables for the period 1990 -2016. The results of our estimation, confirmed a uni-directional causality coming from international tourism to economic growth. This evidence validify the Tourism-Led Growth Hypothesis (TLGH) for The Gambia.
Keywords: Economic growth, international tourism, ARDL, Causality, TLGH, Gambia.
v ÖZET
TURİZM-EKONOMİK BÜYÜME İLİŞKİSİ: GAMBİYA ÖRNEĞİ MODOU BEYAI
Yüksek Lisans Tezi
Sosyal Bilimler Enstitüsü Msc. Finansal Ekonomi
Tez Danışmanı: Prof. Dr. Mehmet Yazıcı Eylül 2018,
Bu çalışmanın amacı, Gambiya için ampirik olarak turizm ile ekonomik büyüme arasındaki ilişkiyi incelemektir. 1990-2016 dönemi yıllık verilerine dayanan çalışmada Sınır Testi methodu ve ARDL modeli kullanılmıştır. Elde edilen sonuçlar, turizmden ekonomik büyümeye tek yönlü nedensellik ilişkisi göstermekte ve dolayısıyla Gambiya için Tuırizme dayalı ekonomik büyüme hipotezi (TLGH) teyit edilmektedir.
Anahtar Kelimeler: Ekonomik büyüme, uluslararası turizm, ARDL, nedensellik, Gambiya
vi
ACKNOWLEGEMENT
I would like to seize this opportunity to thank my able supervisor, Prof. Dr. Mehmet Yazıcı who has been very instrumental in making sure that we present a comprehensive and credible thesis. I would also like to Express my gratitude to Prof. Dr. Ergün Doğan and Prof. Dr. Süleyman Açıkalın for their timely recommendations. I would also like to wholeheartedly thank my family and friends who have been very helpful in all aspects. Your assitance, gave me the strength and motivation to complete this long journey.
vii TABLE OF CONTENTS STATEMENT OF NONPLIAGIRISM………..III ABSTRACT………...………IV ÖZET………...V ACKNOWLEDGEMENT………...VI TABLE OF CONTENTS………..………VII LIST OF TABLES………..IX LIST OF FIGURES……….………X INTRODUCTION……….………...………1 CHAPTER I…….………...2
1.1 .Objective of the study……….…………...2
1.2 Research Hypoyhesis……….….…2
1.3 Scope and Limitation……….….…3
1.4 Organization of the report……….…..…3
CHAPTER 2 BACKGROUND OF THE STUDY………..……….…….….5
2.1. The “Smiling Coast”………..……5
2.2. An overview of the economy………...…..6
2.2. Overview of tourism in The Gambia……….………8
CHAPTER 3 LITERATURE REVIEW………...14
3.1. Theoretical review………..….14
3.1.1. Aggregate demand function………..…14
3.1.2. Neoclassical growth theory ( Export-led growth)……….14
3.1.3. Optimistic interpretation………...……15
3.1.4. Pessimistic interpretation………...……...15
CHAPTER 4 DATA AND METHODOLOGY………22
viii
4.1. Theoretical Framework……….………..….23
4.2. Description of the data……….………25
4.3. Empirical methodology………...…….29
4.4. Stationarity and unit root test………...31
CHAPTER 5 EMPIRICAL REVIEW………..31
5.1. Unit root test….……….………..33
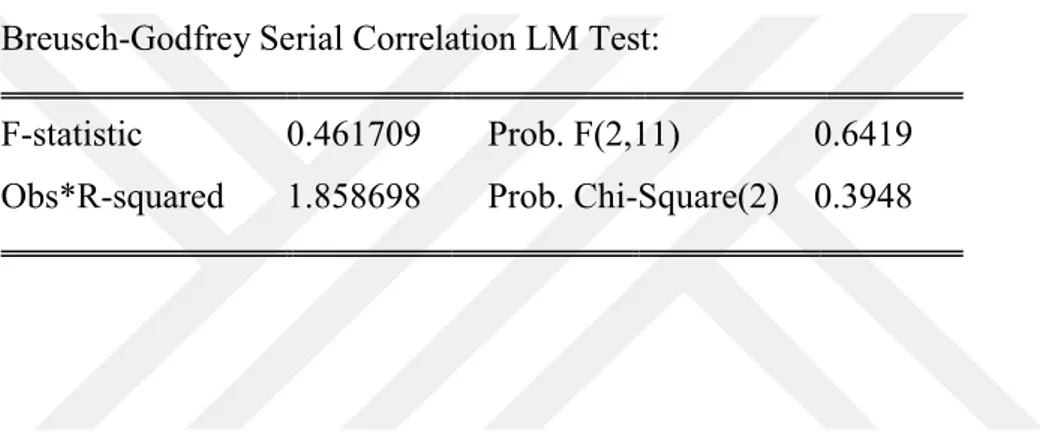
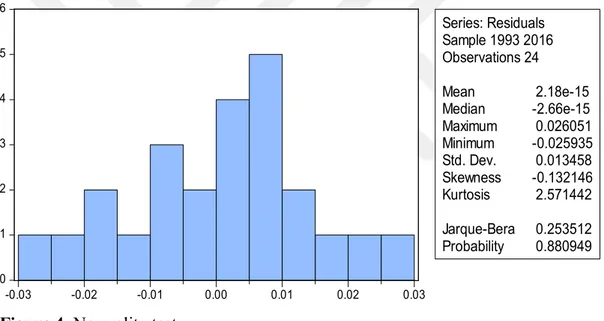
5.2. Estimation of ARDL……….……….. 36 5.2.1. Criteria Graph………. .37 5.2.2. Criteria Table……….…. .37 5.3. Specified model….………..38 5.3.1. Serial correlation……….………...39 5.3.2. Heteroskedasticity Test………..……40 5.3.3. Normality Test………..…….41
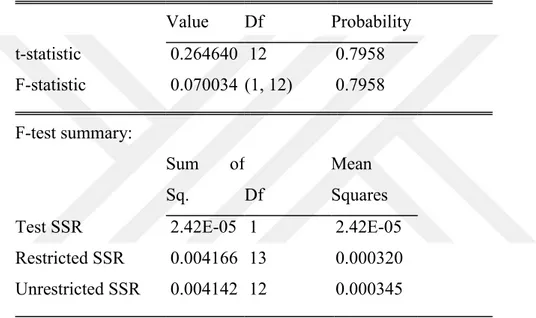
5.3.4. Ramsey Test (functional form)………...………...41
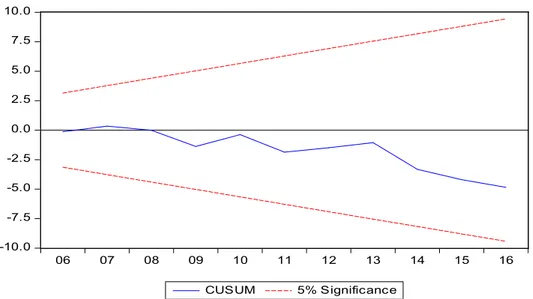
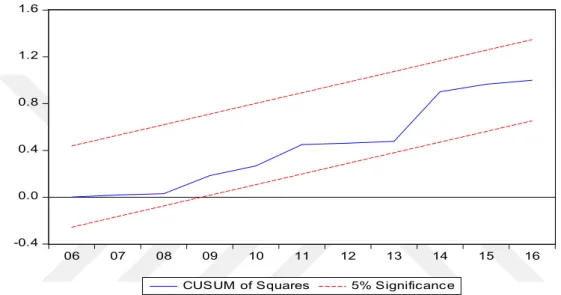
5.4. Stability condition………...……….42
5.5. Bound testing………...…………44
5.6. Error correction model and Long-run coefficients……….………….45
5.6.1. Granger Causality results through the Toda-Yamamoto method…...…..46
5.7. Interpretation of results……….….…. 47
CHAPTER 6 SUMMARY AND CONCLUSION……....………...49
REFERENCES………...………51
APPENDIX……….53
APPENDIX 1. Data used for the study………55
APPENDIX 2. Summary of unit root analysis………...………56
ix
TABLE OF FIGURES
Figure 1 : Tourism revenue………...13
Figure 2 : Plots of the data……….…………..28
Figure 3 : Criteria graph………..……….…36
Figure 4 : Normality test……….……….….…...41
Figure 5 : Cumulative sum test( CUSUM)………..43
x
TABLE OF TABLES
Table 1: Debt to GDP Ratio of the Gambia……….……….……..8
Table 2: Economic indicators……….………9
Table 3: Tourism arrivals………...………...13
Table 4: Descriptive statistics………..……….…26
Table 5: Unit root test results………..………..……….…33
Table 6: Criteria table ……….…..37
Table 7: ARDL Model………..….…39
Table 8: Autocorrelation test………..40
Table 9: Heteroskedasticity………....40
Table 10: Ramsey test………...…….42
Table 11: Diagnostic test summary table……….……..42
Table 12: Bound testing……….45
Table 13: ECM Model………...46
Table 14: Granger Causality……….….47
1
INTRODUCTION
One important variable that has become prominent in the development plans of many low and developing countries is tourism. With the fast rate at which globalization is occuring, there is increasing evidence that indicate how tourism is becoming the heart of economic develpment concept. The rapid increase in the global tourism figures has made many countries to give more attention and importance to tourism, thereby considering expanded tourism as a means to achieve economic growth and development.This huge importance given to the tourism industry by low and developing countries is well explained by the Tourism-Led Growth hypothesis (TLGH). It stipulates that economic growth of countries can not only be attain by increasing the traditional growth variables such as capital and labour but also by expanded tourism export. The tourism-led growth hypothesis terms the expanded tourism as the heart beat of the economy as a whole.
According to the World Travel and Tourism ( WTTC, 2018) Report, travel and tourism earning was USD 8,272.3 bn which represent 10.4 percent of Global GDP and about 313 million jobs were created for the Global economy as of 2017. According to the same report, 1 in 10 jobs in the planet are supported by travel and tourism and more impressively 1 in 5 jobs in the last decade. The high growth rate of travel and tourism which as at 2017 stand at 4.6 percent out paced the Global economy growth rate for the seventh successive year. This impressive and sustained growth rate has attracted more investment in the travel and tourism sector. The total investment in travel and tourism in 2017 is 4.5 percent of total Global investment, which is about USD882.4bn.The report also indicated that emerging economies accounted for 46 percent of the international tourist arrivals which is up from 38 percent in 2000 (WTTC,2015). This huge growth indicates that there is an increased opportunity for travel and tourism in these new markets.
Another eye-catching report for low and developing countries was the United Nations World Tourism Organisation (UNWTO,2014) report, according to it,
2
tourism is among the top five export categories for more than 80 percent of countries in the world. Tourism serve as the main forex earner for every four countries. Furthermore, tourist arrivals in emerging destinations are expected to more than double the rates in advance economies between the years 2010-2030 according to the UNTWO estimates. Sub Sahara Africa is projected to attain about four million jobs in the tourism industry in the next ten years according to the World Travel and Tourism Council (WTTC,2013) report.
3 CHAPTER I
From the statistics outline above it can be seen that tourism can be very important in the economic development of a country and the benefits of tourism are clearly higlighted by the United Nation Environmental Program (UNEP). According to UNEP, tourism can be a major source of foreign exchange earner but the benefits of tourism is by no means limited to foreign exchange earnings, as it also serve as a source of government revenues. Furthermore, tourism increase competition among local firms, stimulate infrastructural investment, increases economies of scales, helps in the preservation of national cultural standards, reduces unemployment and helps in the maintenance of a healthy balance of payment. In light of these benefits that can be created by tourism, this paper investigates how the calm politcal climate, low value Gambian Dalasi and the numerous tourist attractions when put together can serve as a medium to promote international tourism. Just as in most island nations, this can then stimulate/enhance economic growth.
1.1 Objectives of the study
The main objective of this paper is to ascertain the relationship between International tourism expansion and economic growth. And if this nexus exist, the direction of the causalities will be determined to see which one of the variables cause the other or if they cause the growth of each other.
1.2 Research hypothesis
This study as stated above is designed to check the long-run relationship between International tourism growth and economic growth for the Gambia. To be able to study this link, the following hypothesis are established:
: International tourism growth does not stimulate Economic growth : International tourism growth does stimulate Economic growth.
4 1.3 Scope and Limitation
To establish the relationship between the aforementioned variables above, an appropriate model is built to acertain their link. Before the co-integration between tourism growth and GDP is checked, a stationarity test of the variables is carried out in order to ascertain if there is any long-run relationship. To have an extensive and comprehensive study, the real exchange rate is incorporated in our model as an independent variable. Diagnostic tests such as serial correlation, heteroskedasticity and normality are also carried out. Our study covers the period from 1990 – 2016. The biggest limitation of our study is related to the nature of our data. We wanted to employ a quarterly data in our analysis, unfortunately we were unable to obtained such data neither from national statistical bureaus nor from international institutions. It would have been interesting to compare the result of such data to that of the result of the annual data. Apart from this constraint, our study was sufficiently comprehensive.
1.4 Organisation of the report
In this part of the study, we present a summary of our study. We have 6 chapters in total, ranging from the introduction to the conclusion. Chapter one gives a general introduction of the study as a whole. It discusses the general problem which we are analysing, some relevant regional and global statistics, the scope and objective of the study.
Chapter two on the other hand gives detail information about the country under study. It gives a brief history of the Gambia and its geographical location. It discusses widely about the history and development of tourism. In addition, it gives detail information about the economy as whole.
In chapter three, we highlighted the theoretical frameworks of our study. These economic theories form the backbone of our study, that is, our analysis is based on the guidelines of these theories. Furthermore, an empirical review of papers that examined the same topic as ours, are also presented in this chapter. This is very vital, as these studies help to enhance our understanding on the subject under discussion.
5
Chapter four discuses the data, the sources of the data and how it is use in our study. It also gives detail information about the methodology of estimation employed in our study.
Furthermore, chapter five presents the findings we attain after estimation carried out in chapter four.
Finally, chapter six provides a conclusion of the study as a whole. It gives policy suggestion based on the findings of our study.
6 CHAPTER II
BACKGROUND OF THE SYUDY
2.1 The “Smiling Coast”
The Gambia gained its political sovereignty from Great Britain on 18th February 1965. Despite this political independence acclamation (pronoucement), Queen Elizabeth II remained as the titular head of state. It was not until 24th April, 1970 when the Gambia became a republic following a referendum. Sir Dawda Kairaba Jawara was elected as the first president of the country after the declaration of independence. He led the Gambia from 1965 to 1994. His tenure in Office was characterise by a good democratic environment and good deplomatic relations with the West, most notably Great Britain. However, his government is accused of being engaged in massive corruption which led to it being overthrowned by a military junta led by Yahya Jammeh. Yahya Jammeh ruled the country from 1994 to 2016. His regime, according to the coupe members came to power to tackle corruption but they turned out to be worst than the previous government as they are accused of serious economic crimes and corruption. His regime was also characterised by gross human right violations and rule of law. Although in the beginnng of their time in power, many infrastructural developments took place, they were finaced by high interest loans which significantly led to the high indebtness of the country. His regime came to an end in December 2016 when he was defeated in an election by the candidate representing a coalition of seven opposition parties, Adama Barrow. His regime started really well, with lots of goodwill coming from Western partners. His main achievement so far is the freedom of expression enjoy by the people and relaxation of media laws. There have been concerns from some corners with regards to the direction taken by the executive. Notable concerns are the donations of vehicle to the
7
National assembly members - who are suppose to held the executive accountable for their actions- via an anonimous source, a deposite of over a million Dollar in the account of the foundation of the first lady which can not be accounted by anyone in the foundation, awarding a contract to a foreign company (SEMLEX) that is being under investigation for alleged corruption in their home country and other places etc. The country enjoys relative political stability when compared to most Sub Saharan countries. This politcal stability coupled with the friendly nature of its citizens earned her the name (acronym) “Smiling Coast of Africa” given by visiting tourists. The relative political stability and tranquility has made the country a desired destinations not only for many tourists but also for expats and foreigners fleeing wars and economic hardship in the sub region. The Gambia is the smallest country on mainland Africa, surrounded by Senegal on North, South and East, while flank by the Atlantic Ocean on the West. The country has a population of just under two milliion as of 2013, majority of which are youthful. Despite the relative political stability, flowing rivers, natural resources and the vast arable land in abundance, the country is unable to transform these resources into any meanful development, just as in the case of most Sub Saharan countries.
2.2 An overview of the economy
The Gambia has a small economic base which is mostly relient on agriculture, tourism, remittance and re-export trade. The agricultural sector is one of the most important sectors of the ceonomy as it accounts for about 30 percent of the country’s GDP and employing about 75 percent of the population. The sector is also one of the country’s main foreign exchange earner as it accounts for most of the good that are exported apart from the re-export goods. Most common agricultural product that are exported include groundnuts, cotton, palm kernels, etc and 80 percent of the countrys exports go to China, the rest shared between western Europe and the rest of the world. The tourism industry which is part of the service sector (accounts for more than 50 percent of GDP) also accounts for about 20 percent of GDP, and it also provide about 18 percent of the total employment of the economy. The tourism is very important for the countrys economy as it is one of its main foreign exchange
8
earners. Most of the countrys tourist come from the United Kingdom, Scandinavia etc. Another important component of the economy is the re-export trade carried out by the country. It accounts for about 80 percent of the country exports. The main countries that receive these goods are Guineea Bissau and Conakry, Mali, Mauritania and Senegal. Remittances are also another important variable for the Gambian economy as it is one of the main foreign exchange earners for the country. The total amount of remittances in absolute terms when compared to other countries in the sub-region appears to be small but its contribution as percentage of GDP is extremely high and one of the highest in Africa. As of 2010, it was estimated that remittances represent about 8 percent of the GDP of the Gambia.
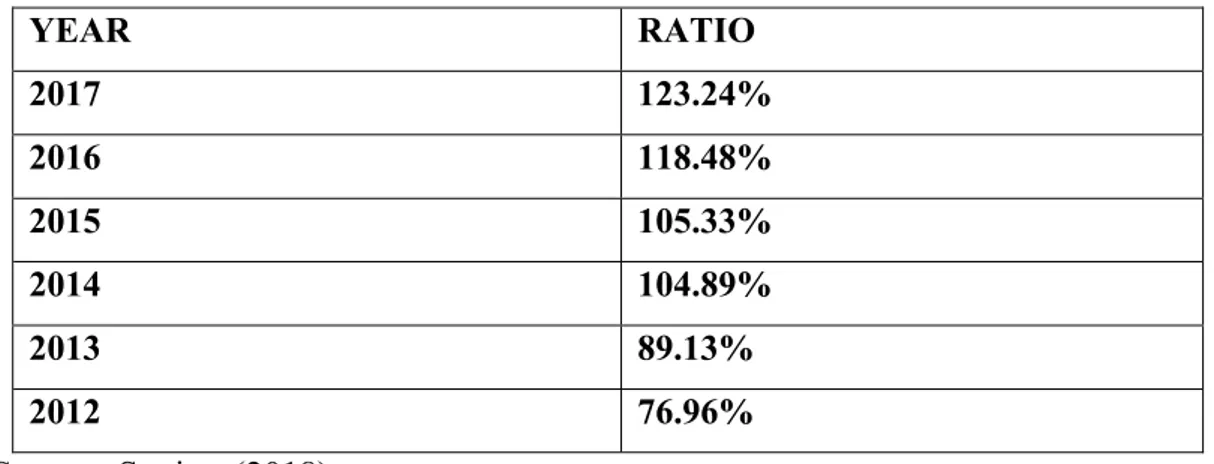
The Gambian economy is characterised by accumulated debt accrued over a long period of time. The high indebtedness of the country does not allow for a viable financial sector and instead downplays the stability of the economy. According to the World Banks as of 2015, the total debt of the country is over 100 percent of GDP, 59 percent of which is external and 49 percent is short term domestic debts. Short term domestic debts are characterise with high interest rates which are very expensive to finance. This condition is not helped by the frequent change of exchange rate regimes which the government appears to have employed in other to curb value of the foreign exchange rates. The table below shows the total national debt of the Gambia in relation to gross fomestic product:
Table 1. Debt to GDP Ratio of the Gambia
YEAR RATIO 2017 123.24% 2016 118.48% 2015 105.33% 2014 104.89% 2013 89.13% 2012 76.96% Source: Statista (2018)
9
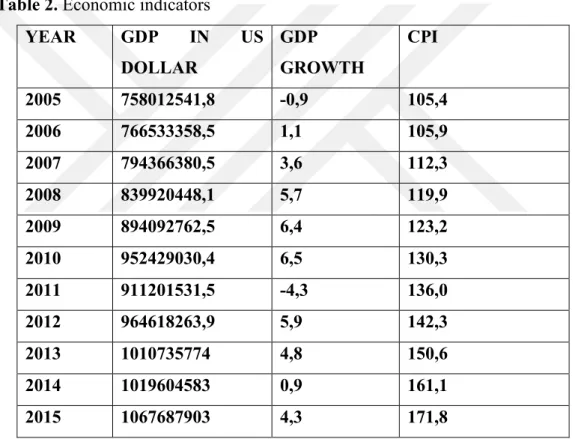
The growth rates of the economy in recent years when compared to other countries in the continent is relatively low. The reason behind this are poor and inconsistent economic policies, high public debt, crowding out of private sector investment and poor or moderate harvest in agriculture etc. According to the African Development Bank (AFDB) the economic growth rate were 4. 4, 2. 1 percent for 2015 and 2016, respectively. These figures are expected to rise to 3. 5, 4. 8 percent for 2017 and 2018, respectivey due to the peaceful political transfer of power and the anticipated and much needed economic reforms to be carried out by the new regime. Below is a table that gives some details informations about the GDP, GDP Growth and CPI of the Gambia from the year 2005 to 2015.
Table 2. Economic indicators
YEAR GDP IN US DOLLAR GDP GROWTH CPI 2005 758012541,8 -0,9 105,4 2006 766533358,5 1,1 105,9 2007 794366380,5 3,6 112,3 2008 839920448,1 5,7 119,9 2009 894092762,5 6,4 123,2 2010 952429030,4 6,5 130,3 2011 911201531,5 -4,3 136,0 2012 964618263,9 5,9 142,3 2013 1010735774 4,8 150,6 2014 1019604583 0,9 161,1 2015 1067687903 4,3 171,8
Source: World Bank (2015)
2.3 Overview of Tourism in the Gambia
Swedish stop-over sightseers from cruise ships were the only known tourists up until the mid-1960s. This period also coincided with the indepencdence of the country. The tourism received a big boost when Bertil Herding, a swedish enterpreneur, accidentally landed in the country on his way to Cap Skirring in
10
Southern Senegal. Captivated by the beautiful sandy beaches, nature and the friendliness and hospitality of the local people, he became adamant that his country’s people must experience this “Paradise”. Through his enterpreneurial expertise the early tourism industry was boosted with the arrival of 300 tourists from Sweden in 1965.This figure rose to 628 tourist in the following year indicating that the country has now become a favourable tourist destination helped by its proximity to Western Europe. From this point, the tourism arrivals countinued to grow on at an unpreceedented rate. Major expansion was observed in the first half of the 1970s, when the number rose from 2, 601 tourist in 1970/71 to 8, 031 in 1972/73, then to over 20, 000 tourist in 1973/74. These figure has risen to over 100,000 tourists per annum in recent times.
Despite the unpreceedented rise in the number of tourist arrivals from the early 1970’s to the early 1990’s, tourism development has remained stagnant and the number of chatered flights to destination Gambia have remained constant or risen at a very minimal rate when compared to its main competitors. Destination Gambia has lost most of its market shares to its competitors, the most notable loss of all, is the German market. The remaining markets – which are the United Kingdom and Scandinavia e.t.c. have also declined at a rapid rate in recent times. There are combination of factors leading to this enormous decline in numbers but the major sources of this include the following:
Destination Gambia failed to keep up with major and recent global development in tourism. Product innovation by the Gambian market is extremely low and in somtimes totally absent and the accomodation and service quality when compared to its major competitors such as Carribeans and Meditterenean countries is insufficient. The absence of an all inclusive package and the failure to accomodate independent travellers have also added salt to injuries.
For a destination to be attractive for major investment in its tourism sector it needs to posses a high visitor arrival rate. The Gambia has relative small market size and the number of arrivals are extremely small when compared to it main competitors. This is a huge desincentive for major European tour operators as it means lower profit margin. The fact that the country generally operates on a seasonal tourism basis not on a year – round basis also create further disincentive.
11
The lower profit margin indirectly create another loop – hole in the competetiveness of destination Gambia business wise. It means there is little or virtually no motive to re-invest the little earned profit in order to refurbish the already available facilities to bring them to standards envisaged by tourist nowadays and make it more marketable and competetive. This failure has resulted to lower accomdation standards, availability of a number of luxury hotels and relatively an undesirable sevice quality.
Furthermore, the absence of regular direct flights from major European countries to destinaion Gambia has also hampered the tourism development and make the country less desirable. Major tour operators prefer to fly Meditterenean countries because of their shorter flight distance and higher utilization rate.
It is worth mentioning that there are efforts on the part of the government of the Gambia to make the tourism industry to not only reclaim its past glories but to as well attain arrival rates that are as high as its close competitors. This deliberate policy shift can be seen in The Gambia Tourism Dvevelopment Plan (2006) which states that “ to make the Gambia a tourism paradise and major tourist destination through product innovation, quality improvement, improvement of investment return and diversification of the Gambia’s tourism product”. Further efforts include the setting up of The Gambia Tourism Authority (GTA) by an Act of the National Assembly of The Gambia in July, 2001 (Access Gambia). The institution is made up of the main actors/players in the tourism sector such as hoteliers, tour operators and the entertainment. One of its main responsibilities is to serve as an overseer of the activities in the tourism industry, provide the necessary support and advice to the key players in the sector and to see to it that standards and regulations set out are fully implemented.
The governments’s efforts has not only stopped at the establishment of The Gambia Tourism Authority, it has also embarked on the construction of high quality hotels notably the Sheraton Hotel which has international reputation for its quality services. The successful completion of this hotel has reduced the unavailability of high quality hotels. The newly elected government has also recently laid the foundation stone for the construction of a megga international conference center which will have a capacity of more than 1000 people, according to the minister of
12
infrastructure, Bai Lamin Jobe (the point newspaper). The center when completed can attract international forums and conferences which can considerably boost the number of tourist arrivals per year.
The minister of tourism and culture Ahmat Bah, in mid 2017, in his address to the National Assembly mentioned the government’s plans to embark on a year- round tourism system instead of the season based one starting from the 2017/2018 (Jollofnews). He revealled the government’s readiness to embark on this journey despite the possible obstacles it might face.
The Smiling Coast presently might be behind most of its competitors, such as Senegal, Cape verde, Ghana etc in terms of tourist arrivals per annum but it does posses the potentials to get back to its glory days. With the present political willingness and positively policy shift towars tourism, coupled with the fascinating tourist attraction which are discussed below, there is light in the tunnel for the country.
The Gambia is blessed with numerous and fascinating tourist attractions from the length and breath of the country. However these features generally lack the necessary investment and international exposure they deserve due to the absence of a proper and well functional international marketing strategy. Some of the major sites include the beautiful white sandy beaches which lies in the heart of the tourism development area (TDA) purposely reserved for possible investments in tourism stretching from Banjul to Gunjur. This place is home to the vibrant Senegambia strip where visitors can be thrilled by night life and treated to the nights of their dreams. The Tanji Village Museum and Nature Reserve along side the Abuko Nature Reserves with other reserves further inland such as Makasutu Cultural Forest, River Gambia National Park can provide breath taking adventureous experience for visiting tourists. The Stone Circles in Wassu is home to The Gambia’s most ancient monuments dating back to about 1200 years ago and it is one of the UNESCO World Heritage alongside James Island (now called Kunta Kinteh Island).
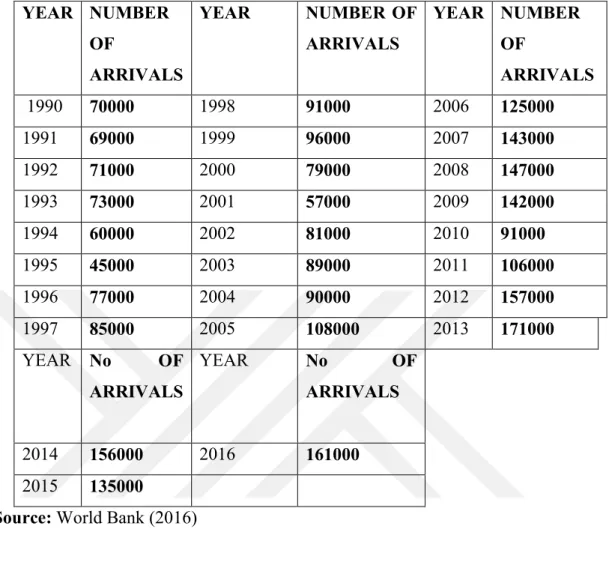
Below is a table showing the number of arrival of tourists on a yearly basis from 1990 to 2016 and the contribution of tourism to the GDP of the Gambia.
13 Table 3. Tourist arrivals
YEAR NUMBER OF ARRIVALS YEAR NUMBER OF ARRIVALS YEAR NUMBER OF ARRIVALS 1990 70000 1998 91000 2006 125000 1991 69000 1999 96000 2007 143000 1992 71000 2000 79000 2008 147000 1993 73000 2001 57000 2009 142000 1994 60000 2002 81000 2010 91000 1995 45000 2003 89000 2011 106000 1996 77000 2004 90000 2012 157000 1997 85000 2005 108000 2013 171000 YEAR No OF ARRIVALS YEAR No OF ARRIVALS 2014 156000 2016 161000 2015 135000
Source: World Bank (2016)
Figure 1: Tourism Revenue Source: WTTC (2015)
14
The Tourism-Led Growth Hypothesis (TLGH) literatuere has been the subject of discussion in many quarters in Economics and Hospitality Management. There have been several studies and researches that have been carried out to check the relationship between economic growth and international tourism. These studies in general, focus on economically well developed and developing countries and as a result there is a very limited amount of research on small underdeveloped countries such as The Gambia. The aim of this paper is thus to fill the gap discussed above in the tourism development literature and discuss the nexus and length to which international tourism development in underdeveloped countries can lead to economic growth using standard economic theory. In addition to this, there is no other scientific research that has been carried out to check the relationship between tourism and economic growth about The Gambia. These gaps are valid motivations and arguements to involve in such a scientific research. The rest of this paper is organised as follows: The next four chapters discuss the literature relating to the TLGH, empircal analysis, results testing and finally, conclusion, respectively.
15 CHAPTER III
LITERATURE REVIEW
3.1 Theoretical review
The Tourism-Led Growth Hypothesis has been the massive discussion in economic journals and papers recently. It is therefore necessary that these discussions are backed by strong economic theory foundations in order to present valid case to prove the different ways in which the realtionship between tourism development and economic growth through the perspective of the TLGH can be clearly seen. There are two main viewpoints with regards to the theoretical specificaion for the TLGH i.e to check the relationship between tourism and economic growth.
3.1.1 Aggregate demand model
The first theoretical framework is based on the standard Keynesian demand function in which a demand side model is constructed and the tourism variable is treated as an exogeneous variable. However, such a model is criticised on the basis that it is static and does not allow for long run economic analysis according to Figini and Vici (2010). To solve the problem of staticity and long run economic analysis, Brida & Risso (2010); Narayan (2004) and Tang (2013) gave the following aguement. That, the demand model can be further expanded by adding variables such as tourism receipts, real tourism prices and real GDP and to further evaluate shocks on tourism demand function.
16 3.1.2 Neoclassical growth theory
Secondly, the Neoclassical growth theory by Solow, which is characterised by a production function is one of the most common specification model for the TLGH recently. It has two factors of production namely: labour and physical capital and in addition to these two, is a non-standard type of export – tourism. The Lucas’ two sector endogeneous growth model (1998) was applied to the tourism sector by Lanza and Pigliaru (1995). They included endowed natural resources as a further input in the production process. This model argued that, destinations that are endowed with natural resources are more likely to exploit them and cover up the technological gap. This arguement is more valid for small countries and are more likely to specailzed in tourism and attain higher growth rates. We will employ this approach in our thesis as our main theoretical framework.
The Lucas’ two sector endogeneous growth theoritical frameworks is also further applied by Brau et al (2007), in which he talked about the “ optimistic interpretation “ and the “ pessimistic interpretation”.
3.1.3 “Optimistic interpretation” is based on the hypothesis of low elasticity of substitution between tourism and manufacturing commdities. In this framework a given consumer have a high preference for tourism specialization and does not easily substitute tourism commodities with the cheaper manufacturing goods. This will lead to higher terms of trade with an elasticity less than one. This result underlies the TLGH and growth is furnished by appreciating tourism service and such a growth is sustainable.
3.1.4 “Pessimistic interpretation” on the other hand is based on the assumption that the given consumers’ preference is such that the tourism specialization is relatively less valued compared to the manufacturing good. Meaning that there is high substitutability between the tourism and manufacturing commodities. There by leading to an elasticity greater than one and causing a “term of trade effect” that is not ideal to the tourism sector.
17 3.2 Empirical Review
The relationship between tourism development and economic growth is the subject of discussion in many articles and research papers in economics and hospitality management. Most of the discussion is base on the famous tourism-led growth hypothesis which sees tourism development as catalyst to attain economic growth. However the findings are mixed, some supporting the TLGH while others are vehemently against it. Below is a comprehensive review of the related TLGH literature, with the analysis carried out in time series, cross section or panel data. The first part of the review discussed articles in support of the TLGH, while the later part talks about the ones that did not confirmed TLGH in their analysis.
Pat Obi, Robert L. Martin, Greg Chidi Obi (2015) studied the long run and causal relationship between international tourism, currency valuation and economic growth in Ghana. The analysis with an annual data covered the period from 1995 to 2015 and the Vector Error Correction Model (VECM) was employed to check both the presence of cointegration and causality among the three variables. The result of the paper showed that there was cointegration among international tourism, exchange rate and economic growth, meaning that both international tourism and exchange rate positively impact economic growth. It also gave evidence of a unidirectional causality from exchange rate to tourism receipts.
M.Bellouni (2010) also investigated the nexus between international tourism receipts and economic growth in Tunisia. The research use three variables, namely: Real gross domestic product, international tourism receipts and exchange rates with an annual data from 1970 to 2007.The Johansen technique and the Granger Causality test were use to check the presence of cointegration and causality among the variables. The result of the analysis showed that there is cointegration between tourism and economic growth in Tunisia. Furthermore, external competitiveness enhances tourism growth in the short run and there is a unidirectional causality from tourism to economic growth in the long run.
Odhiambo (2012) also contributed to the TLGH literature by examining the relationship between tourism development employment and economic growth. The study used variables like tourism development employment, economic growth and labour force participation which was added to the study to redress the weakness
18
connected with biviariate analysis. The study employed the ARDL method to check the link between the variables. The study concluded that there is a causal relationship between tourism development and economic growth. That is, from tourism development to economic growth. A unidirectional causality from labour force participation to economic growth and from tourism development to labour force participation.
Oludele A. Akinboade, Lyndia A. Braimoh (2010) investigated the link between international tourism and economic growth in South Africa. The study use the following variables: Real Gross Domestic Product, international tourism earnings, real effective exchange rate and exports. The study employed the multi vector autoregressive model and Granger Causality test to check cointegration and causality respectively, with annual Data from 1980 to 2005. The result provided evidence showing that there was a unidirectional causality from from international tourism to Real GDP both in the short and long run. The Error correction model (ECM) also backed this finding.
The relationship between international tourism earnings and economic growth was also studied by B. Seetanah (2010) for 19 different island countries. The study use annual data ranging from 1990 to 2007employing the GMM method to observe cointegration and causality among the variables such as investment in physical capital, human capital, measure of economic openness, tourism development and an estimate for economic freedom. The results from the study provide evidence that tourism development plays a huge role in economic growth of island countries and there exist a bi-directional causal nexus between tourism and economic growth. Fayissa, Nsiah, Tadesse (2009) also evaluted the possible contribution of tourism industry to the economic growth and development of Latin American Countries (LAC). The study covered 17 Latin American Countries with Data from 1995 to 2004 and also employed the conventional neoclassical growth model framework to establish the possible links among the variables. The study provided empirical evidence that the tourism industry positively contribute to both the current levels of GDP and the economic growth of LACs as to investment in physical and human capital. It also posits that Latin American Countries can strategically enhance
19
economic growth by boosting their tourism industry while not disregarding the other sectors that promote growth.
Oyinka Idowu Kareem (2013) investigated the role played by the tourism industry on the growth of the econmies of 13 African countries. He employed the generalized method of moment (GMM) to check possible nexus tourism and economic growth with annual Data from 1990 to 2011 of the 13 countries. His findings provided empirical evidence that tourism export plays a significant role in the economic growth of African countries. The economic implication of this result is that, African countries can accelerate economic growth by strengthening the tourism industry.
Seetanah, Padachi and Rajid (2011) carried out a regional base study where 40 African countries were investigated. The study employed the vector autoregressive framework to analyse the role of tourism in the econmies of these countries and used annual Data from 1990 to 2006. The results of the study concluded that the main drivers of the African development are private investment and human capital, however tourism also influence the development in these countries. It further reveals that, there exists a bi-directional causality between national income and tourism.
Chien –Chang Lee, Chun-Ping Chang (2008) contributed to the TLGH literature by investigating the long run comovement and causal relationship between tourism and economic growth in OECD and non OECD Countries (including some in Sub saharan Africa, Latin America and Asia). The study employed the heterogeneous panel cointegration technique to check the validity of the TLGH for these groups of countries. The result of the study proves that a cointegration relationship between GDP tourism development exist and tourism has a greater impact on GDP in nonOECD countries than in OECD countries. The causality test reveals a unidirectional causality from tourism development to economic growth in OECD countries and a bidirectional causality link in nonOECD countries, however only a weak relationship in Asia.
TN. Sequeira and PM. Nunes (2008) employed the System GMM Bludell-Bond (1998) estimator and the corrected LSDV estimator to check the relationship between tourism and econmomic growth in a broad sample of countries. The study
20
empirically presented evidence that reveal that tourism is a positive determinant of economic growth both in broad sample of countries and in small countries. It also reveal that tourism is not more relevant in small countries than in general samples. S.T. Katircioglu (2009) provide interesting outcomes in his study of the nexus between tourism and economic growth for Malta. He employed the Bound test and Granger causality test to check for cointegration and causality respectively with data period from 1960 to 2006. The result of the study empirically showed that a long run equilibrium exist between tourism and economic growth in Malta and the causality test reveals a bidirectional causation between tourism and economic growth.
N. Dritsakis (2004) in his well documented study for Greece presented some very interesting findings that has been well highlighted in the TLGH literature. He employed the Multivariate Auto Regressive (VAR) model and Error Correction Models (ECMs) to find the relationship among international tourism, real GDP and the real effective exchane rate with quartely data from 1960:I to 2000:IV. The results empirically showed that there is one cointegrated vector among the three variables and strong ‘granger causal’ nexus between international tourism and economic growth,’strong causal link between real Exchange rate and economic growth and simply ‘causal’ link between growth and international earnings and between real Exchange rate and international tourism earnings.
Isabel Cortez-Jimenez and Manuela pulina (2010) studied the validity of the tourism-led growth hypothesis for Spain and Italy. Their study found out a bidirectional influence between tourism expansion and economic growth for Spain and a unidirectional granger causality from tourism to economic growth for Italy. The study also emphasized the importance of human and physical capital accumulation in the in the long-run economic growth for both cases. The study adopted the Multivariate Autoregressive Model to check for cointegration among the variables and a Vector Error Correctional Model to check for causality.
Similarly Balaguer and Cantavella-Jorda (2002) aslo test the validity of the TLGH hypothesis for Spain. Their results also confirmed the validity of the tourism-led growth hypothesis for Spain. The study adopted the ADF and PP test for cointegration analysis while it adopted a Johansen Granger Standard Test for
21
causality analysis with quarterly Data from the period 1975 to 1997. The granger causality test revealed that there is a granger causality from international tourism to economic growth, bidirectional causality between international tourism and Exchange rate and a unidirectional influence from Exchange rate to economic growth.
Alp Arslan (2014) in his study also empically showed the tourism-led growth hypothesis is valid for Turkey. His findings demonstrated that there is a stable long-run relationship between accomodation expenses, transport expenses, expenses of sporting activities, sightseeing tour expenses, clothing-footwear expenses, gift expenses and economic growth. Furthermore, the causality test reveal a bidirectional causality between accomodation expenses, expense on sporting activities, gift expense and economic growth. The study use the autoregressive distributed lag (ARDL) test to check for cointegration and Hatemi(2012) causality test to check for causality among the variables with quarterly Data ranging from the period 2003 to 2012.
Gunduz and Hatemi (2005) just like Demiroz and Ongan(2005) and Aslan (2008) demonstrated empirical evidence that the TLGH holds for Turkey. Despite the different variables and techniques employed by the different studies, their conclusions generally showed a long-run link between international tourism and economic growth and a unidirectional or bidirectional causality relationship between the two variables.
H.J. Kim, M.H. Chen and S.S. Jang (2006) also studied for the validity of the tourism-led growth hypothesis for Taiwan and empirically prove its presence. Their results state that there is a long-run equilibrium between tourism and economic growth and the existence of a bidirectional causality between the two.
S.F. Schubert, J.G. Brida and W.A Risso (2009) study the link between international tourism and economic growth for Antigua and Barbuda a small island country in the Carribean. The study uses the Johansen test and vector error correction (VECM) model to check for cointegration and granger causality respectively with annual Data ranging from 1970 to 2008. The results of the study empirically prove the validity of the tourism-led growth hypothesis for a small island nation by
22
showing the presence of cointegration between international tourism and economic growth and a granger causality from the former to the latter.
Durbarry (2004) also contributed to the TLGH litertaure for a small island country by evaluating the case of Mauritius. His finding just as the case for Antigua and Barbuda found that there is long-run equilibrium between international tourism and economic growth in Mauritius and and granger causality between the two.
Muhtaseb and Daoud (2017) evaluated the nexus between tourism and economic growth for Jordan. The study employed the Engle and Granger linear cointegration framework (1987) and the nonlinear framework of Enders and Siklos (2001) and the Diks and Pachenko (2006) causality test to evaluate the possibility of cointegration and granger causality between tourism and economic growth in Jordan with quarterly data period from 1998 to 2005. The result of the empirical finding reveal a long-run relationship between tourism and economic growth and granger causality from the former to the latter. This result empirically prove the validity of the tourism-led growth hypothesis for Jordan.
Ramphul Ohlan (2017) contributed to the TLGH discussion by evaluating the long-run relationship between tourism and economic growth. His finding empirically proves that the tourism-led growth hypothesis is valid for India by indicating the prsence of cointegration between tourism and economic growth and a unidirectional Granger causality form tourism to economic growth.
All the aforementioned studies provide empirical proof that the tourism-led growth is valid in one way or another either in small island economies, single countries or on regional basis. The findings in these literatures in general demonstrated the existence of a long-run equilibrium between tourism an economic growth and with a unidirectional and/or bidirectiomal granger causality between the two variables. From these finding it can be deducted that majority of the discussion on the tourism-led growth debate support the TLG hypothesis i.e tourism expansion and development lead to economic growth.
However, there are a number of studies that have provided empirical evidence to counter the TLGH, instead an economic-driven tourism hypothesis exists they argued. Below are some of the studies that disagree with the tourism-led growth hypothesis.
23
Oh (2005) examined the relationship between international tourism earnings and economic growth for Korea. He adopted the DF, ADF, PP, Engle and Granger two stage method, and Granger based on vector error correction model (VECM) to check for integration, cointegration and granger causality respectively with quarterly data period from 1975 to 2001. The result of the study disagrees with the TLGH because it demonstrated the absence of cointegration between international tourism earnings and economic growth and the granger causality result showed a unidirectional causality from the latter to the former.
Ozturk and Acaravci (2009), Katircioglu (2010), Arslanturk, Balcilar and ozdemir (2011) in their evaluation of the TLGH for Turkey all provided proves that are not in conformity with the tourism-led growth hypothesis. Their results produce empirical evidence that there is no cointegration between tourism and economic growth and/or no causality between the variables.
Bouzahzah and El Menyari (2013) studied the nexus between eocnomic growth and tourism development in Morocco and Tunisia. They adopted the Error Correction Model to check the validity of the tourism-led growth hypothesis for these two Maghreb countries. Annual data from 1980-2010 was used in this study. Their study revealled that, the TLGH is only valid for the short term for both countries, meaning there is no cointegration between economic growth and tourism development. In addition, there is a unidirectional causality from economic growth to international tourism receipt.
24 CHAPTER IV
DATA AND METHODOLOGY
In this chapter, the theoretical model, the data and the empirical methodology used in the study are discussed.
4.1 Theoretical framework
There are many different complementary approaches that are used to explain the long run growth rates of different variables. One of these approaches is the “growth theory”. Most researchers use the popular export-led growth hypothesis (ELGH). This approach includes export in the production function as an input together with Standard growth inputs such as labor force and capital stock. This type of analysis can be clearly seen in the work by Balassa (1978), Feder (1983), Ram (1985:417), and more recently by Dritsakis (2006); with the following production function
=
Where, stands for real domestic output, for level of total productivity at time t, for capital stock while represents labor force at time t.
However, the aim of the this paper is to ascertain and find answers to the questions below with regards to the effect of tourism development on the economic growth of the Gambia.
Does tourism have any effect on the economy of the Gambia in the long run? Does economic growth have any effect on tourism of the Gambia in the short or long run?
25
To test the hypothesis that tourism development is a determinant of long run economic growth (TLGH) for the Gambia, we adopt the economic growth theory framework proposed by Balassa (1978). The role export plays in increasing the factor productivity through increased specilization, greater competition and capacity utilization, increased employment and technological adavancement are the overriding reasons why export is incorporated in the production function, Balassa (1978) argued.
Taking inspiration from the work of Balassa (1978), since international tourism is a form of export, it can be included in the standard production function together with the Gross Domestic Product. J. Balaguer, and M.C Jorda (2002) also posited that in order to capture the real relationship between tourism and growth, more relevant variables such international tourism arrivals, and the real effective exchange rate should be included in the standard growth theory inputs. J.G. Brida et al.1 (2014) posited that the most widely accepted form of measure of international tourism variable is international tourism receipt, followed by international tourism arrivals, tourism export, tourism expenditure etc of that particular country. J. Balaguer, and M.C Jorda (2002) suggested the inclusion of the real effective exchange rate in order to account for external competetiveness. Thus, in econometrics terms, our model is given as:
= + + + (1)
t=1990,---,2016.
Where is real GDP per capita as a proxy for economic growth, TA is the international tourism arrivals as proxy for inbound tourism, RER is the real effective exchange rate, while is the error term that represents deterministic variables that may be left out of the model.
1
The following are examples of studies that use the same independent variables (Tourism arrivals and real effective exchange rate) employed in our analysis: Katircioglu (2011), Brida and Giuliani(2013), Kasimati(2011), Lorde, Francis and Drake (2011), Apergis and Payne(2012).
26 4.2 Description of the Data
Our analysis employed secondary data obtained mainly from two sources. The data was taken from the World Bank and Internationa Monetary Fund (IMF) database and covers a period ranging from the year 1990 to 2016 which is a total of 27 observations. The GDP per capita, the proxy for economic growth is at constant 2010 LCU prices, the Real Exchange rate Index is also at constant LCU prices (2010=100), is the proxy for external competetiveness. “The real effective exchange rate is the Nominal Exchange rate ( a measure of a value of a currency against a weigheted average of several foreign currencies) divided by a price deflator or index of costs” International Monetary Fund, International Financial Statistics. The international tourism arrival figure is a proxy for Inbound tourism. All the data used in this study is annual. Furthermore, all the variables are expressed in their natural logarithm form. The reasons for the convertion of variables to logarithm form are discussed below:
- Log transformation help to minimize the issue of heteroskedasticity - It is also employed in order to get rid of serial correlation
- In addition, when a data set is converted into log form, the data turns into percentage, hence in their elasticity form. This help in the easy interpretation of the coefficients that may be generated. The following tables give the source of data and variables employed in the study.
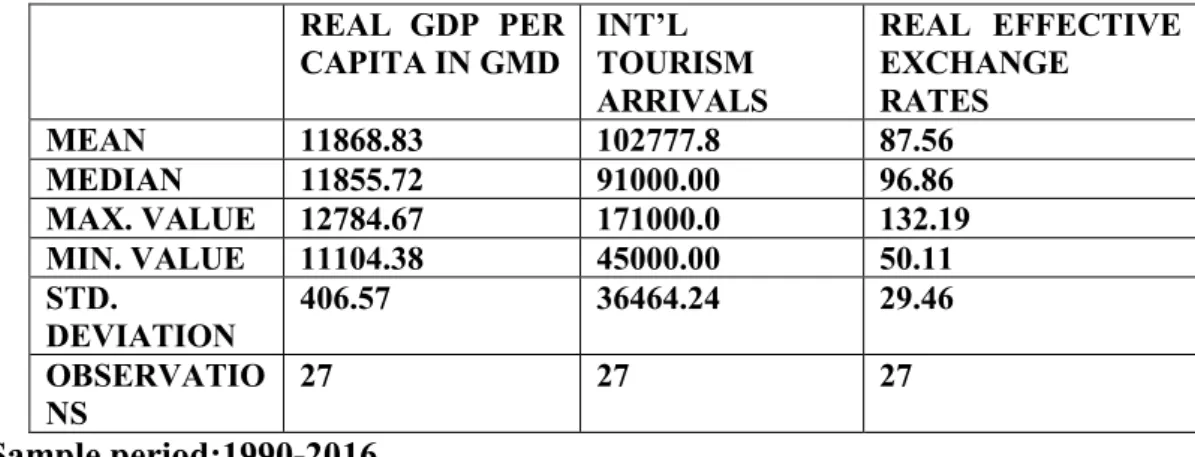
Table 4. Descriptive Statistics
REAL GDP PER CAPITA IN GMD INT’L TOURISM ARRIVALS REAL EFFECTIVE EXCHANGE RATES MEAN 11868.83 102777.8 87.56 MEDIAN 11855.72 91000.00 96.86 MAX. VALUE 12784.67 171000.0 132.19 MIN. VALUE 11104.38 45000.00 50.11 STD. DEVIATION 406.57 36464.24 29.46 OBSERVATIO NS 27 27 27 Sample period:1990-2016
27 Table 4.1 Source of data
VARIABLES SOURCE
Gambia CPI IMF,IFS
U.S CPI IMF, IFS
Nominal ER IMF, IFS
Real ER Calculated
Real Per Capita GDP World Bank
Tourist arrival World Bank
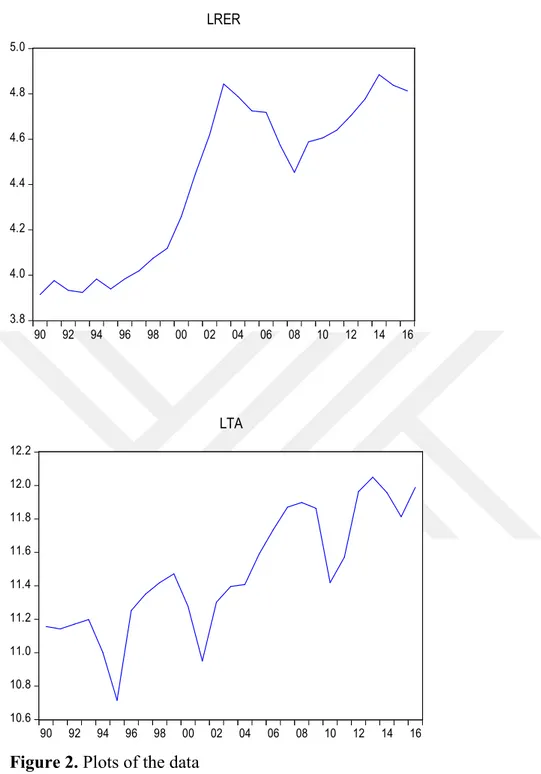
Plots of the Data
The graphs below show the plots of the variables used in the analysis of the study. All the data in this part of the study have already been converted into logarithm. From The LPCY graph below, we can see that the Real GDP per capita increase at an increasing rate in general. Apart from some fluctuations from few periods such as the periods between 2001 to 2003, 2004 to 2006, and 2009 to 2011 the RGDP per capita in generally has a steady increase over the years.
The decreases during the early 2000s might be the effect of economic sanctions imposed by Western countries after a military coupe in 1994. The fall from 2009 to 2011 can be attached to the effect of the aftermath of the global economic crisis that shocked the world in 2008.
The international tourism arrival figures generally varies constantly. The main causes of the fluctuations can be attached to a number factors such as economic situation of the departing tourist, destination country losing its international tourism market share and the exploration and opening of new markets for the country. Furthermore, the falls can be attributed to the millitary take over in 1994, economic sanctions imposed by Western countries after the coupe and the effect of the aftermath of the global economic crisis in 2008.
The real exchange rate variable over the years has increased (an increase here means the value of the Gambian Dalasi has depreciated against the US Dollar) at a very rapid rate, although there are periods when it decreased (a decrease here
28
means the value of the Gambian Dalasi has appreciated against the US Dollar) here and there. A good example of such a decrease can be seen from 1992 to 93 and 2004 to 2008. The main explaination that can be given to the increase and decrease of this variable over the years can be attached to a number of economic issues faced by the country such as economic sactions by the West after the Coupe, contant decrease in total agricultural produce, thereby reducing the total export of the country. In addition to these, is the deterioration of the diplomatic ties between the country and its partners. This led to country being excluded from a number of grants schemes, foreign aid and debt relief programs.
Plots of the data.
9.30 9.32 9.34 9.36 9.38 9.40 9.42 9.44 9.46 90 92 94 96 98 00 02 04 06 08 10 12 14 16 LPCY
29 3.8 4.0 4.2 4.4 4.6 4.8 5.0 90 92 94 96 98 00 02 04 06 08 10 12 14 16 LRER 10.6 10.8 11.0 11.2 11.4 11.6 11.8 12.0 12.2 90 92 94 96 98 00 02 04 06 08 10 12 14 16 LTA
Figure 2. Plots of the data
4.3 Empirical Methodology
We adopted the auto regressive distributive lag model (ARDL) method to test for co-integration developed by Pesaran et al. (2001). The ARDL bound testing methodology is used to check for co-integration and a Granger causality method is
30
used to check for causality, that is, to check for the validity of TLGH in our case. This method is chosen in this study based on the following reasons:
-It provides results that are better and more reliable for studies with relatively small sample sizes which is true for our study (Pesaran et al. (2002): Pesaran et al. (2001) and Haug (2002))
-Unlike other Co-integration approaches, the ARDL bound testing methodology does not need to classify variables as I(0) or I(1) before testing for co-integration. Testing can be carried out irrespective of the variables being I(0) or I (1). -It does not suffer from the problem of endogeneity, while other traditional approaches may easily encounter this problem.
-Estimates driven from ARDL are unbiased, efficient and the ARDL methodology allows for uneven lag order.
The ARDL bound testing approach requires for testing for co-integration, derivation of the error correction model and establishment of the long-term coefficients. As a result, we made a two-stage proceedure, in which we first investigated a long-run link among the variables. In the second stage, the short and long-run parameters are estimated. We employed the natural logarithms of PCY, TA and RER, and are denoted as LPCY, LTA and LRER respectively. Our equation can therefore be written as:
where , represents the intercept, are the long-run multipliers, , is the difference operator and is the standard error.
Two hypothesises to do Bound testing for co-integration are obtained from the unrestricted model above and are given as:
: = = =0 : 0, 0, 0
The null hypothesis shows the nonexistence/absence of long-term relationship.
The test which normalizes on Y is given as: (PCY/TA, RER).
31
The lower bound and the upper bound are two sets of asymptotic critical values when compared to the F-statistic that can help us make conclusion about co-integration. When and if the F-statistics is greater than the upper bound, we can safely say that there is co-integration. However, if the opposite is true, there is nonexistence of co-integration. Furthermore, if the value of the F-statistic falls within the two bounds, no inference can be made.
The second step involved the estimation of the long-run model and the short-run model as well. The two models are given below:
Long-run model
(3)
After the estimation of the long-term model, the short-run model is also estimated below: Short-run model + (4)
Where the error correction term, , gives us information regarding the short-run dynamics. The coefficient of the error correction term, , indicates the speed at which the economy adjust to full equilibrium after a shock and it should always have a negative sign. Its value should lie between -1 and 0, where negative one signifies full adjustment and zero meaning no adjustment at all.
4.4 Stationarity and unit root test
Before we proceed with the analysis of long-run relationship among the various variables, through the bound testing methodology, a stationarity test is first carried out. This is done to make sure that all the variables are not nonstationary. After establishing that all the variables are either I(0) or I(1), we proceed with the bound testing approach to co-integration analysis. It is worth mentioning that, if any
32
of the variables is of the order 2, that is, I(2), the ARDL methodology does not make any sense.
There are a wide range of tests that are used to check for stationarity. The most prominent among them is the one proposed by Dickey and Fuller (1979), commonly known as the ADF test. It proposes two hypothesises shown below:
: There is a unit root : There is no unit root
33 CHAPTER V
EMPIRICAL RESULTS
In this chapter, we discuss the results of the estimation obtained through the aforementioned methodologies. As stated earlier, a two-stage estimation procedure was followed, where the stationarity of the variables were first tested and, the bound testing and the ARDL estimation were employed.
5.1 Unit root
We employed the Augmented Dickey Fuller (ADF) method together with the Akaike Information Criterion (AIC) to check for stationarity. The null hypothesis states that there is a unit root and the alternative is the opposite. If the absolute value of the t-statistics is greater than the critical value at 5% or 1% (generally the 5% is the most commonly used criterion), the null hypothesis is rejected and the opposite is true for acceptance of null hypothesis. Another way to check for stationarity is to compare the value of the probability score to 5%. If the value of the probability score is less than 5%, then the null hypothesis is rejected, otherwise it is accepted. The following series were tested: LPCY, LTA and LRER. The results of the series are presented below.
ADF test with Intercept only Tables 5. Variables Level 1st Difference 5% critical value 1% critical value Integrating order LPCYY -2.3071 -4.9875 -2.9918 -3.7378 I(1) LTA -1.3666 -4.9275 -2.9918 -3.7378 I(1) LRER -1.1291 -3.1548 -2.9862 -3.7240 I(1)
34 ADF test with Intercept and Trend
Variables Level 1st Difference 5% critical value 1 % critical value Integrating order LPCY -3.3269 -4.8678 -3.6121 -4.3943 I(1) LTA -4.2207 -4.8421 -3.6033 -4.3743 I(0) LRER -2.1575 -6.3312 (2nd difference) -3.6121 -4.3943 I(2)
From the two panels above, it can be clearly seen that all the variables (LPCY and LTA) have an integrating order of I(0) or I(1) , except for LRER which has an integrating order of I(2). With these results any bound testing carried out would be meaningless. To solve this problem, we adopted the ADF-GLS method. It is a modified version of the normal ADF. It provides a more robust analysis than the normal ADF and its adaptability to relatively small size samples makes it suitable for this study.
ADF-GLS test with Intercept only Variables Level 1st Difference 5% critical value 1% critical value Integrating order LPCY -2.3389 -5.0253 -1.9544 -2.3389 I(0) LTA -1.2972 -5.0412 -1.9556 -2.6648 I(0) LRER -0.8297 -3.2186 -1.9550 -2.6607 I(1)
ADF-GLS test with Intercept and Trend Variables Level 1st Difference 5% critical value 1% critical value Integrating order LPCY -3.3715 -5.0959 -3.1900 -3.7700 I(0) LTA -4.1949 -5.0666 -3.1900 -3.7700 I(0) LRER -2.2835 -3.2346 -3.1900 -3.770000 I(1)
It can be seen from the above panels that all our macroeconomic variables are all either I(0) or I(1) integrating order ( The ADF-GLS method was the adopted
35
method for all the series). 2This result permits us to now carry out the bound testing technique in order to check conintegration between the variables.
We also carried out a unit root test for structural break. The result of this test showed that there is a break in 2003 for two of our variables (LPCY and LRER). To take this into account, we have included a dummy variable for 2003 in our analysis. The results of the break point unit root test for the variables are given below:
LPCY
Null Hypothesis: LPCY has a unit root
Trend Specification: Trend and intercept Break Specification: Intercept only Break Type: Innovational outlier Break Date: 2003
Break Selection: Minimize Dickey-Fuller t-statistic
Lag Length: 6 (Automatic - based on Schwarz information criterion, maxlag=6)
t-Statistic Prob.* Augmented Dickey-Fuller test statistic -5.268294 0.0141 Test critical values: 1% level -5.347598
5% level -4.859812
10% level -4.607324
LRER
Null Hypothesis: D(LRER) has a unit root Trend Specification: Trend and intercept Break Specification: Intercept only Break Type: Innovational outlier Break Date: 2003
Break Selection: Minimize Dickey-Fuller t-statistic
Lag Length: 0 (Automatic - based on Schwarz information criterion, maxlag=6)
2 The PP, KPSS and NG-Perron unit root tests are also carried out. They are reported in the Appendix: The PP test showed that LPCY, LTA and LRER atttained stationarity at first differenced. However, LRER attained it at the 5% while the other two attained stationarity at the 1%. The KPSS results indicated all the three variable attained stationarity at the level and at the 1%. Finally, Ng-Perron results showed that, all the three variables attained stationarity at the first difference and at the 5%.
36
t-Statistic Prob.* Augmented Dickey-Fuller test statistic -5.471234 < 0.01 Test critical values: 1% level -5.347598
5% level -4.859812 10% level -4.607324
*Vogelsang (1993) asymptotic one-sided p-values.
5.2 Estimation of ARDL
The estimation of the ARDL model involves a two step procedure. Firstly, the orders of the lags are determined before the cointegration analysises are carried out. The first step is very important because there is a delicate balance in over estimating or under estimating the lags (n, o, p ). To find lags that do not over estimate or underestimate true values, the lag order on the first difference was obtained by using the Akaike Information Criterior. There are two ways of model selection criteria, one way is the criteria graph and the alternating way is the criteria table. Below are the results of the criteria graph and table of our analysis:
5.2.1 Criteria Graph -4.92 -4.88 -4.84 -4.80 -4.76 -4.72 -4.68 AR D L( 1, 3 , 1 , 2 ) AR D L( 2, 3 , 1 , 2 ) AR D L( 1, 3 , 2 , 2 ) AR D L( 1, 3 , 1 , 3 ) AR D L( 2, 3 , 1 , 1 ) AR D L( 1, 3 , 1 , 1 ) AR D L( 1, 3 , 3 , 2 ) AR D L( 2, 3 , 2 , 2 ) AR D L( 2, 3 , 0 , 1 ) AR D L( 3, 3 , 1 , 2 ) AR D L( 2, 3 , 1 , 3 ) AR D L( 1, 3 , 2 , 3 ) AR D L( 3, 3 , 1 , 1 ) AR D L( 1, 1 , 1 , 1 ) AR D L( 2, 3 , 3 , 2 ) AR D L( 2, 3 , 2 , 1 ) AR D L( 1, 3 , 2 , 1 ) AR D L( 3, 3 , 0 , 1 ) AR D L( 1, 3 , 3 , 3 ) AR D L( 3, 3 , 2 , 2 )