www.iojes.net
International Online Journal of Educational Sciences
ISSN: 1309-2707Development, Validity and Reliability of TPACK Scale with Pre-Service
Mathematics Teachers
Nezih ÖNAL
11Nigde University, Faculty of Education, Department of Computer Education and Instructional Technology, Nigde, Turkey
AR TIC LE I N F O ABST RAC T
Article History:
Received 09.11.2015 Received in revised form 06.02.2016
Accepted 20.02.2016 Available online 22.03.2016
The purpose of this study is to develop a TPACK (Technological Pedagogical Content Knowledge) scale based on the main components of TPACK framework. The validity and reliability studies of the scale were carried out with 316 Turkish pre-service mathematics teachers at seven different universities in Turkey. The Exploratory Factor Analysis (EFA) and Confirmatory Factor Analysis (CFA) of the scale were carried out. The Cronbach’s alpha reliability coefficient for the whole scale was found as .97. This scale consists of 59 items and nine factors. With the exploratory factor analysis nine constructs were found: technological knowledge (TK), content knowledge (CK), pedagogy knowledge (PK), pedagogical content knowledge (PCK), technological content knowledge (TCK), online technological pedagogical knowledge (TPK online), offline technological pedagogical knowledge (TPK offline), technological pedagogical content knowledge (TPCK) and contexts knowledge. According to the CFA results of scale, the ratio of the chi-square value (2866.53) to the degree of freedom (1616) was 1.77. In addition, the goodness-of-fit values for the model revealed by the CFA were SRMR=0.047 and RMSEA=0.050. The development of both reliable and valid scale related to the technological pedagogical content knowledge of pre-service mathematics teachers’ would be promote further studies.
© 2016 IOJES. All rights reserved
Keywords: 1
TPACK, Mathematics, Scale, Validity, Reliability. Introduction
In today’s educational-instructional practices, the efficient use of technology in education becomes possible only when teachers, who are responsible for teaching and guiding students, are trained in a way that will enable them to use instructional technologies effectively. The reason for this is that one of the prerequisites for having successful students is to increase the number of teachers who are better qualified and who can use these qualifications in an efficient manner. Then, it can be safely argued that it is essential to teach students a discipline (e.g. math) in association with daily life and on the basis of developing technology to establish interactive learning environments and to efficiently use technology in the instructional process.
A review of literature indicates that math is one of the subjects that students have most difficulty in and thus develop fear for and anxiety about (Dreger and Aitken, 1957; Fennema and Sherman, 1976; Miller and Mitchell, 1994). According to the common idea of some educationists specializing in teaching of math, one of the important ways to be effective in math classroom is to ensure that teachers have well-constructed pedagogical content knowledge (Escudero and Sanchez, 2002; Ozmantar and Bingolbali, 2009; Tirosh, Even and Robinson, 1998; Yesildere and Akkoc, 2010). As can be concluded from several studies, the efficient use of technology in educational practices has a positive impact to academic achievement (Lee and Hollebrands,
Corresponding author’s address: Nigde University, Faculty of Education, Department of Computer Education and Instructional Technology, Nigde, Turkey Telephone: +90 388 225 44 06
2008; Niess, 2011; Powers and Blubaugh, 2005; Quinn, 1997; Teo, Chai, Hung and Lee, 2008; Teo, Ursavas and Bahcekapili, 2012).
The National Council of Teachers of Mathematics (NCTM) Principles and Standards point out the role of the efficient use of technology in facilitating students’ mathematics learning. However, it is not enough to simply encourage the use of technology, because it cannot replace the mathematics teacher, nor can it be used as a replacement for basic understanding and intuition (NCTM, 2014). According to Baki (2001), neither computers nor pedagogical software can suffice on their own as learning and teaching math via computers depends on the user. Here, it is possible and necessary to mention the studies that suggest how necessary it is to use technology in cooperation with pedagogical and content knowledge (Archambault and Crippen, 2009; Bozkurt and Cilavdaroglu, 2011; Chai, Koh and Tsai, 2011; Graham et al., 2009; Kabakci Yurdakul et al., 2012; Kabakci Yurdakul, 2011; Koehler and Mishra, 2008; Mishra and Koehler, 2006; Mumcu and Usluel, 2010; Mumcu, Haslaman and Usluel, 2008; Niess et al., 2009; Niess, 2005; Schmidt et al., 2009; Tokmak, Incikabi and Ozgelen, 2012). Technological Pedagogical Content Knowledge (TPACK), a framework which introduced by Mishra and Koehler (2006), is commonly used for identifying the relationships among technology, pedagogy and content as well as in studies focusing on the integration of technology. One of the main components of TPACK, Technology refers to such tools as computers, internet, videos, whiteboards, and books etc. Pedagogy involves learning and teaching methods, strategies and processes whereas Content represents the subject matter (Mumcu, Haslaman and Usluel, 2008).
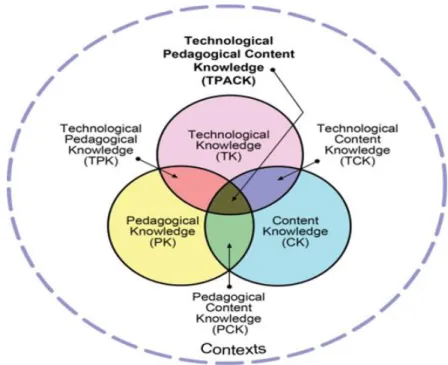
In general, TPACK involves (1) presenting concepts through using technology; (2) making use of technology in teaching content knowledge via pedagogical methods and techniques; (3) identifying what makes learning of concept easy or difficult as well as determining how to make use of technology to enable students to solve the problems they may encounter; and (4) deciding how to use technology for teaching students new knowledge or reinforcing their prior knowledge (Mishra and Koehler, 2006; Koehler and Mishra, 2009).
Figure 1. TPACK framework (Koehler and Mishra, 2008)
Despite this definition of the components of TPACK, there is no consensus on what these components should involve. Simply, the components of TPACK, as can be concluded from Figure 1, seem to be the intersection of three circles; however, a closer look reveals that it is comprised of a structure that is too subtle to deal with. Therefore, an in-depth analysis accompanied by a proper investigation (techno pedagogical knowledge competencies of teachers and pre-service) will hopefully contribute to its identification.
Mishra and Koehler (2009) describe TPACK as a whole that consists of the fundamentals of teaching with technology, presentation of concepts via technology and, as for teaching content knowledge,
development of constructive methods through pedagogical techniques. Students’ preliminary knowledge should be improved, reinforced, corrected, and enhanced through TPACK.
Advancing technology has led to a change in students’ learning tendencies and to the need for teachers to update themselves. This need can be satisfied if the current status of teachers and prospective teachers is identified and relevant training is planned accordingly. Therefore, measuring their techno-pedagogical educational competencies has now become imperative. TPACK is a highly appropriate model to develop a scale that can be used to measure and evaluate how knowledgeable teachers and pre-service teachers are about the integration of technology into the instructional process (Schmidt et al., 2009). The data derived from such measurement tools can reveal how teachers and pre-service teachers can integrate technology with their content knowledge and pedagogical knowledge. The use of technology in education literature already includes a number of attempts to design such scales (Archambault and Crippen, 2009; Kabakcı Yurdakul et al., 2012; Koehler and Mishra, 2005; Mumcu and Usluel, 2010; Niess, 2005; Schmidt et al., 2009; Sahin, 2011; Terpstra, 2009). However, there are relatively a limited number of scales with items specifically designed for particular math disciplines (Landry, 2010; Niess et al., 2009). This was the underlying idea of the present study, the purpose of which is to develop a valid and reliable scale to measure pre-service math teachers’ technological pedagogical content knowledge.
Methodology Participants
This study used convenience sampling with a non-random sampling technique. Sampling can be defined as administrating a scale to those who are included within the immediate environment of the researcher, who are easy to access, and who volunteer to participate in the study (Erkus, 2009). The scale was administered to 353 fourth year students of the math education department of seven universities (Aksaray University, Balikesir University, Gazi University, Erciyes University, Ahi Evran University, Karadeniz Technical University, Yuzuncu Yıl University) in Turkey. The subjects-to-variables ratio should be no lower than 5 {353/66=5,35} (Bryant and Yarnold, 1995; Garson, 2008; MacCallum, Widaman, Zhang & Hong, 1999). All the participants had already taken the Teaching Experience course, which aims to give students an opportunity to observe teaching, providing them the chance to gain school experience at schools under the supervision of experts. Data from 37 participants consisted of incomplete or inaccurate responses to the scale. This data were excluded, and the analyses were carried out on the data from 316 prospective teachers [208 (65.8%) female and 108 (34.2%) male]. Although there are various standards for the number of participants for factor analyses, Tabachnick and Fidell (2007) acknowledge that data from about 300 participants will be appropriate. Therefore, the sample size of the present study (316 participants) was suitable for analysis.
Instruments
The first step was to conduct a review of existing literature. Next, the researcher composed an item pool containing 70 items. For this article, previously made scale development from existing literature was used (Schmith et al. 2009; Landry, 2010; Kabakci Yurdakul et al., 2012). The items were in the form of a typical five-point rating Likert scale, namely (5) completely competent, (4) fairly competent, (3) somewhat competent, (2) slightly competent, and (1) incompetent. The items were submitted to five instructors specializing in math education, measurement, and evaluation and an educational technologist to assess them for their content validity. Following this, the items were checked by two other instructors specializing in linguistics. In accordance with their recommendations, four items were excluded and the remaining 66 items were used.
All the necessary preparations were made to analyze the data before administration. This included careful checking of the forms of the scale administered to the students. Next, a data entry form was prepared using Microsoft Excel. Then, the raw data were transformed into a dataset via SPSS 18. The dataset, subject to data cleaning, was incorporated into the statistical analysis (Tabachnick and Fidell, 2007). After they were prepared, the data were analyzed through SPSS 18 and LISREL 8.7. The analyses involved identification of normality tests (Kolmogorov Smirov, n = 316, .200, p > .05), skewness (-,076), and kurtosis (-,259) values for the scores in the scale, which were calculated based on the items in the scale, and for the mean scores in the items. In addition, the assumptions of the exploratory and confirmatory factor analyses were tested.
Results
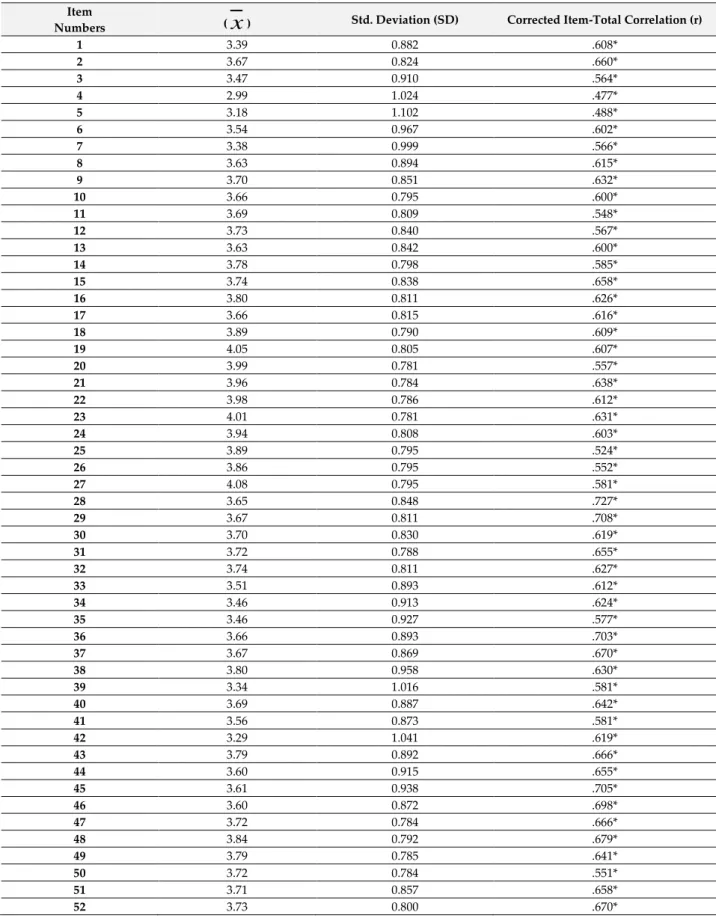
The scale, which contained 66 items, had a Cronbach’s alpha of 0.98, suggesting that the scale being developed was notably reliable. Before the exploratory factor analysis conducted to determine its factor structure, the item-total correlations were also considered. Table 1 presents the findings on the mean scores, standard deviation values and item-total correlations for the items in the scale.
Table 1. Findings on the item-total correlations for the items in scale Item
Numbers ( ) Std. Deviation (SD) Corrected Item-Total Correlation (r)
1 3.39 0.882 .608* 2 3.67 0.824 .660* 3 3.47 0.910 .564* 4 2.99 1.024 .477* 5 3.18 1.102 .488* 6 3.54 0.967 .602* 7 3.38 0.999 .566* 8 3.63 0.894 .615* 9 3.70 0.851 .632* 10 3.66 0.795 .600* 11 3.69 0.809 .548* 12 3.73 0.840 .567* 13 3.63 0.842 .600* 14 3.78 0.798 .585* 15 3.74 0.838 .658* 16 3.80 0.811 .626* 17 3.66 0.815 .616* 18 3.89 0.790 .609* 19 4.05 0.805 .607* 20 3.99 0.781 .557* 21 3.96 0.784 .638* 22 3.98 0.786 .612* 23 4.01 0.781 .631* 24 3.94 0.808 .603* 25 3.89 0.795 .524* 26 3.86 0.795 .552* 27 4.08 0.795 .581* 28 3.65 0.848 .727* 29 3.67 0.811 .708* 30 3.70 0.830 .619* 31 3.72 0.788 .655* 32 3.74 0.811 .627* 33 3.51 0.893 .612* 34 3.46 0.913 .624* 35 3.46 0.927 .577* 36 3.66 0.893 .703* 37 3.67 0.869 .670* 38 3.80 0.958 .630* 39 3.34 1.016 .581* 40 3.69 0.887 .642* 41 3.56 0.873 .581* 42 3.29 1.041 .619* 43 3.79 0.892 .666* 44 3.60 0.915 .655* 45 3.61 0.938 .705* 46 3.60 0.872 .698* 47 3.72 0.784 .666* 48 3.84 0.792 .679* 49 3.79 0.785 .641* 50 3.72 0.784 .551* 51 3.71 0.857 .658* 52 3.73 0.800 .670*
x
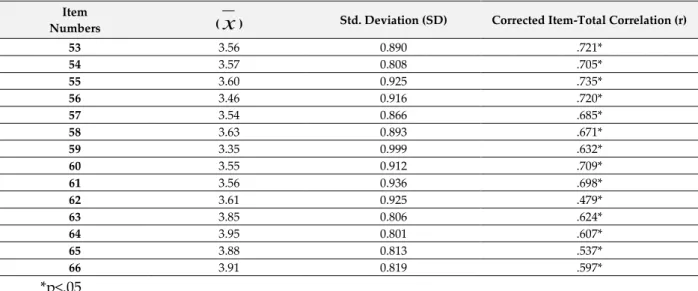
Table 1. Findings on the item-total correlations for the items in scale (continued) Item
Numbers ( ) Std. Deviation (SD) Corrected Item-Total Correlation (r)
53 3.56 0.890 .721* 54 3.57 0.808 .705* 55 3.60 0.925 .735* 56 3.46 0.916 .720* 57 3.54 0.866 .685* 58 3.63 0.893 .671* 59 3.35 0.999 .632* 60 3.55 0.912 .709* 61 3.56 0.936 .698* 62 3.61 0.925 .479* 63 3.85 0.806 .624* 64 3.95 0.801 .607* 65 3.88 0.813 .537* 66 3.91 0.819 .597* *p<.05
All of the 66 items had sufficient item-total correlations (Table 1). The correlations ranged from r=0.477 (Item 4) to r=0.735 (Item 55). No item was excluded from the scale at this stage, for none of them had an item-total correlation lower than 0.30 (Tavsancil, 2010). The correlations for the items suggested that anything that could be measured through the whole scale could also be measured through each of the items in the scale and that all the items could be incorporated into the scale.
The Exploratory Factor Analysis (EFA) of Scale
The data set was subject to an exploratory factor analysis (EFA) so as to ensure the construct validity of the scale and to identify its factor structure. The Kaiser-Meyer-Olkin (KMO) value and the results of Bartlett’s test were considered in order to determine whether the data set was suitable for the EFA. The KMO value was 0.96 and Bartlett’s test yielded a significant result (χ2: 15625.351; p<0.01), suggesting that the data set was suitable for factor analysis since the KMO value acknowledged for the sample size and the appropriateness of the correlation among the items is 0.60 and higher (Buyukozturk, 2008).
Varimax-rotated principal components analysis was performed to identify whether the items in the scale could be grouped with independent and meaningful factors. A principal components analysis is concerned with how a specific variable will contribute to the component as well as with the formation of the components existing in the data (Field, 2005). While the bottom limit of the factor loading of an item was accepted to be 0.40 (Field, 2005; Netemeyer, Bearden and Sharma, 2003), the bottom limit of the differences among the items under the factors was recognized to be 0.10 (Tabachnick and Fidell, 2007). The process ended up with the exclusion of 7 items; the ultimate scale had 59 items linked with 9 sub-factors identified. The process of factor selection involved maximum likelihood and Kaiser Normalization in addition to varimax-rotated principal components analysis.
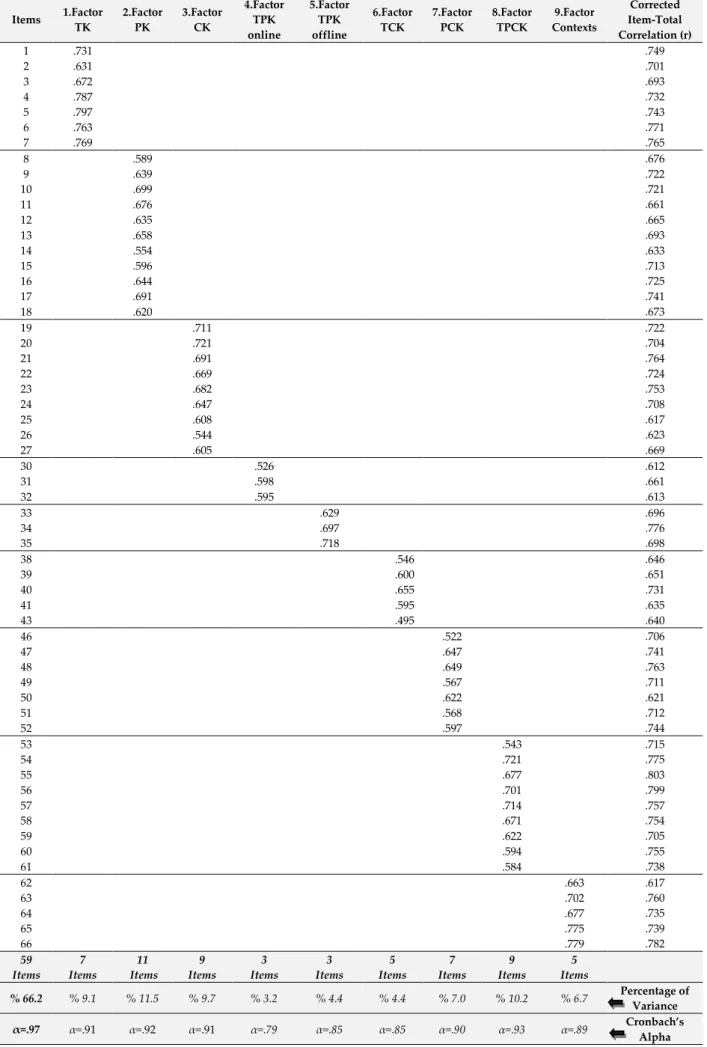
Table 2 presents the distribution of factor loadings for the items in the scale after seven items (28, 29, 36, 37, 42, 44, and 45) were excluded following the varimax-rotated principal components analysis. The factor loadings for the remaining 59 items varied between 0.495 (Item 43) and 0.797 (Item 5). The scale accounted for 66.2% of the total variance. Studies in the social sciences acknowledge that 40% to 60% of the variance should be accounted for (Netemeyer, Bearden, & Sharma, 2003). This suggests that the amount of variance accounted for in the present study (66.2%) was sufficiently good.
After the scale was finalized, each dimension of the scale and the overall scale were tested for reliability purposes, and Cronbach’s alpha coefficients and item-total correlations were calculated again. Cronbach’s alpha was found to be 0.97 for all the items included in the finalized version of the scale. The reliability coefficients indicated that not only the overall scale but also each factor had acceptable internal consistency. The correlation values for the items loaded under each factor ranged from r=0.612 (Item 30) to r=0.803 (Item 55).
Table 2. The distribution of factor loadings for the items in scale following the factor analysis Items 1.Factor TK 2.Factor PK 3.Factor CK 4.Factor TPK online 5.Factor TPK offline 6.Factor TCK 7.Factor PCK 8.Factor TPCK 9.Factor Contexts Corrected Item-Total Correlation (r) 1 .731 .749 2 .631 .701 3 .672 .693 4 .787 .732 5 .797 .743 6 .763 .771 7 .769 .765 8 .589 .676 9 .639 .722 10 .699 .721 11 .676 .661 12 .635 .665 13 .658 .693 14 .554 .633 15 .596 .713 16 .644 .725 17 .691 .741 18 .620 .673 19 .711 .722 20 .721 .704 21 .691 .764 22 .669 .724 23 .682 .753 24 .647 .708 25 .608 .617 26 .544 .623 27 .605 .669 30 .526 .612 31 .598 .661 32 .595 .613 33 .629 .696 34 .697 .776 35 .718 .698 38 .546 .646 39 .600 .651 40 .655 .731 41 .595 .635 43 .495 .640 46 .522 .706 47 .647 .741 48 .649 .763 49 .567 .711 50 .622 .621 51 .568 .712 52 .597 .744 53 .543 .715 54 .721 .775 55 .677 .803 56 .701 .799 57 .714 .757 58 .671 .754 59 .622 .705 60 .594 .755 61 .584 .738 62 .663 .617 63 .702 .760 64 .677 .735 65 .775 .739 66 .779 .782 59 Items 7 Items 11 Items 9 Items 3 Items 3 Items 5 Items 7 Items 9 Items 5 Items % 66.2 % 9.1 % 11.5 % 9.7 % 3.2 % 4.4 % 4.4 % 7.0 % 10.2 % 6.7 Percentage of Variance α=.97 α=.91 α=.92 α=.91 α=.79 α=.85 α=.85 α=.90 α=.93 α=.89 Cronbach’s Alpha
Furthermore, Pearson’s correlation coefficients (r) were calculated so that the correlations among the factors could be identified. It is acknowledged that a correlation coefficient ranging from 0.70 to 1.00 stands for high correlation, 0.30 to 0.69 for intermediate correlation, and less than 0.29 for low correlation (Buyukozturk, 2008). Table 3 presents the correlations among the factors of the scale.
Table 3. The Correlations among the factors of scale
Factors TK PK CK TPK online TPK offline TCK PCK TPCK Contexts TK - PK .485** - CK .469** .696** - TPK online .515** .623** .592** - TPK offline .493** .462** .504** .593** - TCK .583** .530** .518** .575** .535** - PCK .469** .740** .663** .593** .501** .626** - TPCK .568** .613** .559** .657** .640** .737** .694** - Contexts .367** .532** .534** .460** .413** .568** .607** .598** -
A positive and high correlation was revealed between the factors PK-PCK (r=0.740) and TCK-TPCK (r=0.737) (Table 3). Besides, it can be argued that there was a positive and intermediate correlation among all the other factors.
The Confirmatory Factor Analysis (CFA) of Scale
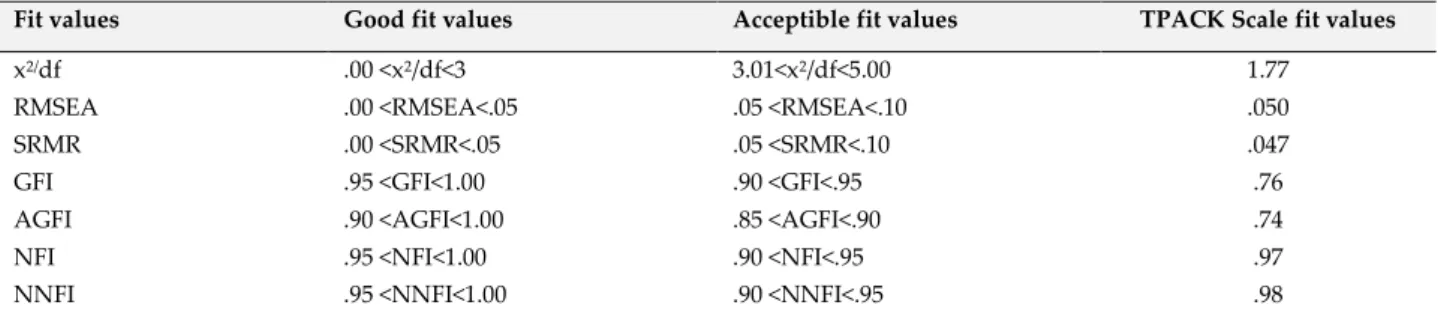
The goodness-of-fit criteria accepted for the model revealed after the confirmatory factor analysis were as follows: χ2 / degree of freedom (df) ratio <3 (Sumer, 2000), goodness-of-fit index ≥0.90 (Hair, Anderson, Tahtam and Black, 1998), adjusted goodness-of-fit index (AGFI) ≥0.80 (Marsh, Balla and McDonald, 1988), normed fit index (NFI)≥0.90, non-normed fit index (NNFI) ≥0.90 (Hair et al., 1998), comparative fit index (CFI) ≥0.90 (Bentler, 1990), and incremental fit index (IFI) ≥0.90 (Bollen, 1989). In addition, it is reported that a good fit is represented by a root mean square residual (RMR), standardized root mean square residual (SRMR) and root mean square error of approximation (RMSEA) lower than 0.05 whereas an acceptable fit is represented by a RMR, SRMR and RMSEA lower than 0.08 (McDonald and Moon-Ho, 2002; Schermelleh-Engel, Moosbrugger and Muller, 2003; Thompson, 2000). According to MacCallum and Austin (2000), only SRMR and RMSEA indices are enough to determine the fit. All these findings show that there is no consensus about which of these goodness-of-fit statistics should be used. The fit values of the suggested model and the standard fit criteria are presented in Table 4 (Kabakci Yurdakul et al., 2012).
Table 4. The fit values of the suggested model and the standard fit criteria.
Fit values Good fit values Acceptible fit values TPACK Scale fit values
x2/df .00 <x2/df<3 3.01<x2/df<5.00 1.77
RMSEA .00 <RMSEA<.05 .05 <RMSEA<.10 .050
SRMR .00 <SRMR<.05 .05 <SRMR<.10 .047
GFI .95 <GFI<1.00 .90 <GFI<.95 .76
AGFI .90 <AGFI<1.00 .85 <AGFI<.90 .74
NFI .95 <NFI<1.00 .90 <NFI<.95 .97
NNFI .95 <NNFI<1.00 .90 <NNFI<.95 .98
According to the CFA results of scale, which was conducted through LISREL 8.7, the ratio of the chi-square value (2866.53) to the degree of freedom (1616) was 1.77. In addition, the goodness-of-fit values for the model revealed by the CFA were as follows: GFI=0.76, AGFI=0.74, NFI=0.97, NNFI=0.98, IFI=0.99, CFI=0.99, RMR=0.036, SRMR=0.047, RMSEA=0.050. A RMSEA value of 0.05 and lower suggests a good fit whereas one that is 0.08 or lower indicates an acceptable fit (Simsek, 2007). It can be safely argued that the scale had acceptable goodness-of-fit values, seeing that the ratio of the chi-square value (2866.53) to the degree of freedom (1616) was 1.77, SRMR was 0.047 and RMSEA was 0.050, and all the other values, excluding GFI and AGFI, were higher than 0.95 (MacCallum and Austin; 2000).
Discussion and Conclusion
Today’s researchers have been discussing how educationists can effectively use their content knowledge, pedagogical knowledge and technological knowledge during the instructional process. In that pursuit, the first step must be to conduct a proper needs analysis so that the current situation can be identified. Accordingly, studies of educational sciences often use surveys. In fact, there are a number of attempts in the literature to develop scales associated with TPACK and to test the current situation through administration of such scales. For instance, Koehler and Mishra (2005) worked with graduate students and instructors to conduct a Likert-type scale in order to have a clear idea about the learning environment, online course design, group dynamics, and TPACK. According to the findings derived from this scale, which actually had few questions as to TPACK, the participants viewed technology, pedagogy and content as independently of one another early in the term; however, they experienced a change at the end of the term and started to believe that these three structures were linked with each other. Similarly, Archambault and Crippen (2009) designed a 24-item measurement tool in order to study how competent 596 teachers from 25 regions were in terms of their technological pedagogical knowledge.
Schmidt et al. (2009) intended to design a valid and reliable measurement tool to assess prospective teachers’ TPACKs. In the study, which was conducted on 124 prospective teachers, TPACK was defined as what the participants needed to know in order to integrate technology into effective instructional practices. The scale was a promising instrument for measuring pre-service teachers’ self-evaluation. Likewise, Kabakci Yurdakul et al. (2012) and Sahin (2011) developed valid and reliable scales on the basis of the components of TPACK so as to measure prospective teachers’ technological pedagogical content knowledge. In contrast, Landry (2010) worked only with math teachers and developed M-TPACK in order to measure their TPACKs. In addition to the scale, the researcher was also involved in individual interviews with the participants, thus providing an in-depth analysis of their TPACKs.
The present study, on the other hand, attempted to develop a scale to measure prospective math teachers’ technological pedagogical content knowledge and presented valid and reliable findings. TPACK is commonly described in existing literature as a framework comprised of eight dimensions, namely TK, PK, CK, TPK, TCK, PCK, TPCK, and Contexts Knowledge. However, the results of the EFA in the present study suggested that TPK was divided into two other factors: online and offline technological pedagogical knowledge. This was also supported by the CFA. In this way, a 59-item, 9-dimensional, valid, and reliable scale was developed in the present study in order to reveal prospective math teachers’ TPACKs. The scale can hopefully be administered to both math teachers and prospective math teachers. In addition, future studies could adapt the scale to different disciplines and use it to determine novice and expert teachers’ TPACKs.
References
Archambault, L., & Crippen, K. (2009). Examining TPACK among K-12 online distance educators in the United States. Contemporary Issues in Technology and Teacher Education, 9(1), 71-88.
Baki, A. (2001). Bilişim teknolojisi ışığı altında matematik eğitiminin değerlendirilmesi. Milli Eğitim Dergisi,
149, 26-31.
Bentler, P. M. (1990). Comparative fit indexes in structural models. Psychological Bulletin, 107(2), 238–246.doi: 10.1037/0033-2909.107.2.238
Bollen, K.A. (1989). Structional equations with latent variables. New York: Wiley.
Bozkurt, A., & Cilavdaroğlu A. K. (2011). Matematik ve sınıf öğretmenlerinin teknolojiyi kullanma ve derslerine teknolojiyi entegre etme algıları. Kastamonu Eğitim Dergisi, 19(3), 859-870.
Bryant, F. B., & Yarnold, P. R. (1995). Principal components analysis and exploratory and confirmatory factor analysis. In L. G. Grimm & R R. Yarnold (Eds.), Reading and understanding multivariale statistics (pp. 99-136). Washington, DC: American Psychological Association.
Büyüköztürk, Ş. (2008). Sosyal bilimler için very analizi el kitabı (Dokuzuncu Baskı). Ankara: Pegem A Yayıncılık. Chai, C. S., Koh, J. H. L., & Tsai, C. C. (2011). Exploring the factor structure of the constructs of technological,
Dreger, R.M., & Aitken, L.R. (l957). The identifical of number anxiety in a college population. Journal of
Educational Psychology, 48(6), 344-351.
Erkuş, A. (2009). Davranış bilimleri için bilimsel araştırma süreci (İkinci Baskı). Ankara: Seçkin Yayıncılık. Escudero, I., & Sanchez, V. (2002). Integration of domains of knowledge in mathematics teachers practice. In
Cockburn & Nardi (Eds.) Proceedings of the 26 Conference of International Group of PME, 2, 177-184. Fennema, E., & Sherman, J. A. (1976). Fennema-Sherman mathematics attitudes scales: Instruments designed
to measure attitudes toward the learning of mathematics by males and females. Catalog of Selected
Documents in Psychology, 6(1), 31.
Field, A. (2005). Discovering statistics using SPSS. London: Sage.
Garson, D. G. (2008). Factor analysis: Statnotes. Retrieved May 26, 2014, from North Carolina State University Public Administration Program, http://www2.chass.ncsu.edu/garson/pa765/factor.htm.
Graham, C. R., Burgoyne, N., Cantrell, P., Smith, L., St. Clair, L., & Harris, R. (2009). TPACK development in science teaching: measuring the TPACK confidence of in-service science teachers. TechTrends, Special
Issue on TPACK, 53(5), 70-79.
Hair, J.F. Jr., Anderson, R.E., Tatham, R.L., & Black, W.C. (1998). Multivariate data analysis (5th Edition). Upper Saddle River, NJ: Prentice Hall.
Kabakçı Yurdakul, I. (2011). Öğretmen adaylarının teknopedagojik eğitim yeterliklerinin bilgi ve iletişim teknolojileri kullanımları açısından incelenmesi. Hacettepe Üniversitesi Eğitim Fakültesi Dergisi, 40, 397-408.
Kabakci Yurdakul, I., Odabasi, H. F., Kilicer, K., Coklar, A. N., Birinci, G., & Kurt, A. A. (2012). The development, validity and reliability of TPACK-deep: A technological pedagogical content knowledge scale. Computers & Education, 58(3), 964-977. doi: 10.1016/j.compedu.2011.10.012
Koehler, M., & Mishra, P. (2008). Introducing TPCK. In. AACTE committee on innovation and technology (Eds.), Handbook of technological pedagogical content knowledge (TPCK) for teaching and teacher educators, (pp. 3-29). New York and London: Routledge.
Koehler, M. J., & Mishra, P. (2005). What happens when teachers design educational technology? The development of technological pedagogical content knowledge. Journal of Educational Computing Research,
32(2), 131-152.
Koehler, M. J., & Mishra, P. (2009). What is technological pedagogical content knowledge? Contemporary Issues
in Technology and Teacher Education, 9(1), 60-70.
Landry, G. A. (2010). Creating and validating an instrument to measure middle school mathematics teachers’
technological pedagogical content knowledge (TPACK). Unpublished Doctoral Thesis, University of
Tennessee.
Lee, H., & Hollebrands, K. (2008). Preparing to teach mathematics with technology: An integrated approach to developing technological pedagogical content knowledge. Contemporary Issues in Technology and
Teacher Education, 8(4), 326-341.
MacCallum, R.C., & Austin J.T. (2000). Applications of structural equation modeling in psychological research.
Annual Review of Psychology, 51, 201-226. doi: 10.1146/annurev.psych.51.1.201
MacCallum, R. C., Widaman, K. F., Zhang, S., & Hong S. (1999). Sample size in factor analysis. Psychological
Methods, 4(1), 84-99. doi: 10.1.1.536.6317
Marsh, H. W., Balla, J. R., & McDonald, R. P. (1988). Goodness of fit indexes in confirmatory factor analysis: The effect of sample size. Psychological Bulletin, 103(3), 391-410.
McDonald, R.P., & Moon-Ho, R.H. (2002). Principles and practice in reporting structural equation analyses.
Miller, L.D., & Mitchell, C.E. (1994). Mathematics anxiety and alternative methods of evaluation. Journal of
Instructional Psychology, 21(4), 353-358.
Mishra, P., & Koehler, M. (2009). What is technological pedagogical content knowledge? Contemporary Issues
in Technology and Teacher Education, 9(1), 60-70.
Mishra, P., & Koehler, M. J. (2006). Technological pedagogical content knowledge: A framework for teacher knowledge. Teachers College Record, 108(6), 1017-1054.
Mumcu, F. K., Haşlaman, T. & Usluel, Y. K. (2008, Mayıs). Teknolojik pedagojik içerik bilgisi modeli çerçevesinde
etkili teknoloji entegrasyonunun göstergeleri. International Educational Technology Conference (IECT)’nda
sunulmuş bildiri. Anadolu Üniversitesi, Eskişehir, Türkiye.
Mumcu, F.K. & Usluel, Y.K. (2010, Nisan). TPİB modeline göre BİT’in öğrenme-öğretme sürecine entegrasyonuyla
ilgili ölçek geliştirme çalışması. International Educational Technology Conference (IETC)’nda sunulmuş
bildiri. Istanbul, Turkey.
NCTM, (2014). National council of teachers of mathematics, principles for school mathematics-the technology principle Retrieved from: http://www.nctm.org/standards/content.aspx?id=26809.
Netemeyer, R., Bearden, W., & Sharma, S. (2003). Scaling procedures. Thousand Oaks, CA: Sage Publications. Niess, M. L. (2005). Preparing teachers to teach science and mathematics with technology: Developing a
technology pedagogical content knowledge. Teaching and Teacher Education, 21(5), 509-523. DOİ: 10.10.1016/j.tate.2005.03.006
Niess, M. L. (2011). Investigating TPACK: Knowledge growth in teaching with technology. Journal of
Educational Computing Research, 44(3), 299-317. doi: 10.2190/EC.44.3.c
Niess, M. L., Ronau, R. N., Shafer, K. G., Driskell, S. O., Harper S. R., Johnston, C., Browning, C., Ozgun-Koca, S. A., & Kersaint, G. (2009). Mathematics teacher TPACK standards and development model.
Contemporary Issues in Technology and Teacher Education, 9(1), 4-24.
Özmantar. M. F., & Bingölbali, E. (2009). Sınıf öğretmenleri ve matematiksel zorlukları. Gaziantep Üniversitesi
Sosyal Bilimler Dergisi, 8(2), 401-427.
Powers, R., & Blubaugh, W. (2005). Technology in mathematics education: Preparing teachers for the future.
Contemporary Issues in Technology and Teacher Education, 5(3/4), 254-270.
Quinn, R. J. (1997). Effects of mathematics methods courses on the mathematical attitudes and content knowledge of preservice teachers. Journal of Educational Research, 91(2), 108-113.
Schermelleh-Engel, K., Moosbrugger, H., & Muller, H. (2003). Evaluating the fit of structural equation models: Tests of significance and descriptive goodness-of-fit measures. Methods of Psychological Research Online,
8(2), 23-74.
Schmidt, D. A., Baran, E., Thompson A. D., Koehler, M. J., Mishra, P., & Shin, T. (2009). Technological pedagogical content knowledge (TPACK): The development and validation of an assessment instrument for preservice teachers. Journal of Research on Technology in Education, 42(2), 123-149.
Sahin, I. (2011). Development of survey of technological pedagogical and content knowledge (TPACK). The
Turkish Online Journal of Educational Technology, 10(1), 97-105.
Şimsek, Ö. F. (2007). Yapısal eşitlik modellemesine giriş: Temel ilkeler ve LISREL uygulamaları. Ankara: Ekinoks Yayıncılık.
Sümer, N. (2000). Yapısal eşitlik modelleri: Temel kavramlar ve örnek uygulamalar. Türk Psikolojileri Yazıları,
3(6), 74-79.
Tabachnick, B. G., & Fidell, L. S. (2007). Using multivariate statistics. Boston: Allyn and Bacon.
Terpstra, M. A. (2009). Developing technological pedagogical content knowledge: preservice teachers' perceptions of
how they learn to use educational technology in their teaching. Unpublished Doctoral Thesis, Michigan State
University.
Teo, T., Chai, C. S., Hung, D., & Lee, C. B. (2008). Beliefs about teaching and uses of technology among pre-service teachers. Asia-Pacific Journal of Teacher Education, 36(2), 163-174. doi: 10.1080/13598660801971641 Teo, T., Ursavaş, F. O., & Bahçekapili, E. (2012). An assessment of pre-service teachers’ technology acceptance
in Turkey: A structural equation modeling approach. The Asia-Pacific Education Researcher, 21(1), 191–202. Thompson, B. (2000). Ten Commandments of structural equation modeling. In L.G. Grim and P. R. Yarnold (Eds.), Reading and understanding more multivariate statistics (pp. 261-283). Washington, DC: American Psychological Association.
Tirosh, D., Even, R., & Robinson, N. (1998). Simplifying algebraic expressions: Teacher awareness and teaching approaches. Educational Studies in Mathematics, 35(1), 51-64.
Tokmak, H. S., Incikabi, L., & Ozgelen, S. (2012). An investigation of change in mathematics, science, and literacy education pre-service teachers’ TPACK. The Asia-Pacific Education Researcher, 22(4), 407-415. Yeşildere, S., & Akkoç, H. (2010). Matematik öğretmen adaylarının sayı örüntülerine ilişkin pedagojik alan
bilgilerinin konuya özel stratejiler bağlamında incelenmesi. Ondokuz Mayıs Üniversitesi Eğitim Fakültesi
Appendix 1
Technological Pedagogical Content Knowledge Scale (TPACK-Math)
General Competences I n co m p et en t S li g h tl y C o mp et en t S o mew h at C o m p et en t F ai rl y C o mp et en t C o mp le te ly C o m p et en t Technological Knowledge (TK) 1 2 3 4 5
1 Ability to overcome technical problems that may be experienced in the instructional environment on one’s own 2 Ability to choose appropriate technologies to be used for instructional purposes 3 Ability to use new developing technologies for instructional purposes
4 Ability to solve hardware problems of technological devices in the instructional environment 5 Ability to install necessary software into technological devices in the instructional
environment
6 Ability to use software already installed in technological devices in the instructional environment
7 Ability to help students with problems they may experience with computers
Pedagogical Knowledge (PK) 1 2 3 4 5
1 Ability to keep up-to-date with instructional strategies, methods and techniques 2 Ability to detect misconceptions students might experience
3 Ability to use the best instructional strategy and method for teaching a particular concept 4 Ability to use those instructional techniques that are based on student performance 5 Ability to take into account any potential individual differences in the instructional process 6 Ability to take measures against potential problems that might be experienced in the
classroom
7 Ability to exhibit effective classroom management during classes 8 Ability to prepare expedient measurement tools for examinations 9 Ability to decide how to assess in-class student performance 10 To get rid of misconceptions that students might experience 11 To make classes attractive to stimulate student learning
Content Knowledge (CK) 1 2 3 4 5
1 Ability to use existing knowledge about mathematical subjects 2 Ability to solve potential daily problems with mathematical thinking 3 Ability to decide on the scope of mathematical subjects to be covered
4 Ability to decide on the order of mathematical subjects and concepts to be covered 5 Ability to use various ways and strategies for solving mathematical problems 6 Ability to explain objectives of mathematical subjects in accordance with grade level 7 Ability to improvise examples and problems different from those presented in sources 8 Ability to associate mathematical subjects with similar courses
9 Ability to provide examples of how math can be used in daily life
Technological Pedagogical Knowledge (TPK) 1 2 3 4 5
TPK)-Offline
1 Ability to plan how to use a technology for instructional purposes
2 Ability to predict how technology can affect the learning-instructional process
3 Ability to evaluate students in reference to a class in which technology is effectively used (TPK)-Online
4 Ability to provide students with online environments that contribute to their knowledge and skills
5 Ability to use various methods and approaches during online instruction 6 Ability to promote online learning among students
General Competences I n co m p et en t S li g h tl y C o mp et en t S o mew h at C o m p et en t F ai rl y C o mp et en t C o mp le te ly C o m p et en t
Technological Content Knowledge (TCK) 1 2 3 4 5
1 Ability to use software already installed in computers (MS Office, calculator, paint, and so forth) for math
2 Ability to use flash animations and graphical drawings to enrich math classes 3 Ability to make multimedia or presentations to teach mathematical subjects 4 Ability to search the Web for those subjects and concepts related to math classes 5 Ability to explain the advantages of using technology in teaching math
Pedagogical Content Knowledge (PCK) 1 2 3 4 5
1 Ability to teach math classes in accordance with the theoretical foundations of the curriculum 2 Ability to explain the contents of mathematical subjects in the curriculum
3 Ability to determine instructional strategies, methods and techniques suitable for mathematical subjects
4 Ability to have students research mathematical subjects
5 Ability to identify what learning difficulties students might have in reference to a particular mathematical subject
6 Ability to overcome any misconceptions that students might have in reference to a particular mathematical subject
7 Ability to help students associate a particular mathematical subject or concept with other subjects or concepts
Technological Pedagogical Content Knowledge (TPCK) 1 2 3 4 5
1 Ability to take into account mathematical contents, learning-teaching strategies and relevant new technologies during lesson planning
2 Ability to use technology-assisted evaluation tools while assessing the learning-teaching process
3 Ability to make use of technological devices in order to measure students’ preliminary knowledge about mathematical subjects
4 Ability to make use of technological devices in order to identify students’ misconceptions about mathematical subjects
5 Ability to use technology to reinforce students’ skills in, comprehension of and predictions about a particular mathematical subject
6 Ability to use technology to provide effective examples in parallel with the math textbook 7 Ability to satisfy student requirements during online math instruction
8 Ability to integrate technology with math classes in a proper and effective way in order to make them easier and more comprehensible
9 Ability to help others at school for coordinated use of mathematical, technological and instructional strategies
Contexts Knowledge (CK) 1 2 3 4 5
1 Ability to take into account certain demographics of students for whom math instruction will be provided, such as parental educational status, income level, and so forth
2 Ability to take into account technological facilities of the classroom where math instruction will take place
3 Ability to take into account certain physical conditions of the classroom where math instruction will take place, such as lighting, airiness, and so forth
4 Ability to take into account the structure of the society in which the school where math instruction will take place exists
5 Ability to take into account how well students at the school where math instruction will take place can access technology
Appendix 2 (Turkish Version)
Matematik İçin Teknolojik Pedagojik Alan Bilgisi Ölçeği (TPAB-Mat)
Genel Yeterlilikler Y et er si zi m Ç ok A z Y et er liy im B ir az Y et er li y im O ld uk ça Y et er liy im Ta mam en Y et er li y im Teknoloji Bilgisi (TB) 1 2 3 4 5
1 Öğretim ortamında yaşanabilecek teknik problemleri kendi başıma çözebilmek 2 Öğretim amaçlı kullanılabilecek ihtiyaca uygun teknolojileri seçebilmek 3 Öğretim amaçlı kullanılabilecek gelişen yeni teknolojileri kullanabilmek 4 Öğretim ortamındaki teknolojik araçların donanımsal sorunlarını giderebilmek 5 Öğretim ortamındaki teknolojik araçlara gerekli olan yazılımları yükleyebilmek 6 Öğretim ortamındaki teknolojik araçlardaki kurulu yazılımları kullanabilmek 7 Bilgisayarlarıyla yaşanabilecek teknik sorunlarda öğrencilere yardımcı olabilmek
Pedagoji Bilgisi (PB) 1 2 3 4 5
1 Güncel öğretim strateji, yöntem ve tekniklerini takip edebilmek 2 Öğrencilerin karşılaşabileceği kavram yanılgılarını tespit edebilmek
3 Bir kavramın öğretilmesi için gerekli en iyi öğretim stratejisini ve yöntemini uygulayabilmek 4 Öğretimde öğrenci performanslarına dayalı öğretim teknikleri kullanabilmek
5 Öğretim esnasında olabilecek bireysel farklılıkları dikkate alabilmek
6 Sınıf ortamında karşılaşılabilecek olumsuzluklar için önceden önlem alabilmek 7 Ders esnasında etkili sınıf yönetimi sergileyebilmek
8 Sınavlarda kullanılan ölçme araçlarını amaca uygun bir şekilde hazırlayabilmek 9 Öğrencilerin sınıf içi performanslarının nasıl değerlendirilebileceğine karar verebilmek 10 Öğrencilerde yaşanabilecek kavram yanılgılarını giderebilmek
11 Öğrencilerin öğrenmelerini teşvik için dersi çekici hale getirebilmek
Alan Bilgisi (AB) 1 2 3 4 5
1 Matematik dersinin konuları ile ilgili sahip olduğum bilgileri etkin kullanabilmek 2 Karşılaşılabilecek günlük problemleri matematiksel düşünmeyle çözebilmek 3 Öğretilecek matematik konularının kapsamına karar verebilmek
4 Öğretilecek matematik konu ve kavramlarının sırasına karar verebilmek 5 Matematik problemlerini çözerken farklı yol ve stratejileri kullanabilmek 6 Sınıf düzeyine göre matematik konularının amaçlarını açıklayabilmek
7 Yararlanılan kaynaklardaki örneklerden farklı olarak anlık örnek ve problemler üretebilmek 8 Matematik konularını benzer sayısal derslerle ilişkilendirebilmek
9 Günlük hayatta matematiğin nasıl kullanılacağı konusunda örnekler verebilmek
Teknolojik Pedagoji Bilgisi (TPB) 1 2 3 4 5
(TPB)-Çevrimdışı
1 Öğretim amaçlı kullanılacak bir teknolojinin nasıl kullanılacağını planlayabilmek 2 Teknolojinin öğrenme-öğretme sürecini nasıl etkilediğini tahmin edebilmek 3 Teknolojinin etkin kullanıldığı bir ders kapsamında öğrencileri değerlendirebilmek
(TPB)-Çevrimiçi
4 Öğrencilere bilgi ve beceri kazanmalarına yardımcı çevrimiçi ortamlar sunabilmek 5 Yapılacak çevrimiçi öğretimler sırasında farklı yöntem ve yaklaşımlar kullanabilmek 6 Öğrenciler arasında çevrimiçi öğrenme oluşmasını teşvik edebilmek
Genel Yeterlilikler Y et er si zi m Ç ok A z Y et er li y im B ir az Y et er li y im O ld uk ça Y et er liy im Ta mam en Y et er li y im
Teknolojik Alan Bilgisi (TAB) 1 2 3 4 5
1 Bilgisayarda var olan yazılımları (MS Office programı, hesap makinesi, paint vb.) matematik dersi için kullanabilmek 2 Matematik derslerinde içeriği zenginleştirmek için flash animasyonları ve grafik çizim programlarından faydalanabilmek
3 Matematik konularının öğretimi için çoklu ortamlar veya sunumlar yapabilmek 4 Internetten matematik dersiyle ilgili konu ve kavramları araştırabilmek
5 Matematik öğretiminde teknolojiden faydalanmanın olumlu yönlerini açıklayabilmek
Pedagojik Alan Bilgisi (PAB) 1 2 3 4 5
1 Matematik derslerini öğretim programının kuramsal temellerine uygun olarak işleyebilmek 2 Matematik konularının öğretim programındaki içeriğini açıklayabilmek
3 Matematik konularına uygun öğretim strateji, yöntem ve tekniklerini belirleyebilmek 4 Öğrencilerin matematik konuları ile ilgili araştırmalar yapmalarını sağlayabilmek
5 Bir matematik konusu ile ilgili öğrencilerin yaşayabileceği öğrenme zorluklarını tespit edebilmek 6 Bir matematik konusu ile ilgili öğrencilerin yaşayabileceği kavram yanılgılarını giderebilmek 7 Öğrencilerin belirli bir matematik konusu veya kavramıyla diğer ders konuları veya kavramları arasında ilişki kurmalarına yardımcı olabilmek
Teknolojik Pedagojik Alan Bilgisi (TPAB) 1 2 3 4 5
1 Ders planlaması yaparken matematik içeriğini, öğrenme-öğretme stratejilerini ve bunlara uygun yeni teknolojileri dikkate alabilmek
2 Öğrenme-öğretme sürecinin değerlendirmesini yaparken teknoloji destekli ölçme-değerlendirme araçları kullanabilmek 3 Matematik konuları ile ilgili öğrencilerin ön bilgilerinin ölçülmesinde teknolojik araçlardan
faydalanabilmek
4 Matematik konuları ile ilgili öğrencilerin kavram yanılgılarının tespitinde teknolojik araçlardan faydalanabilmek
5 Matematiğin belirli bir konusunda öğrencilerin becerilerini, anlamalarını ve tahminlerini güçlendirmek için teknolojiyi kullanabilmek 6 Matematik ders kitabındaki konulara paralel etkili örnekler vermek için teknoloji kullanabilmek 7 Online matematik eğitimi sırasında öğrencilerden gelen talepleri karşılayabilmek
8 Daha kolay ve anlaşılır hale getirebilmek için matematik derslerine teknolojiyi doğru ve etkili entegre edebilmek
9 Okulda matematik, teknoloji ve öğretim stratejilerinin koordineli kullanımı için başkalarına (diğer öğretmenler, yöneticiler) yardım edebilmek
Bağlam Bilgisi (BB) 1 2 3 4 5
1 Matematik öğretimi yapılan öğrencilerin ailelerinin eğitim düzeyi, gelir düzeyi vb. durumlarını dikkate alabilmek
2 Matematik öğretimi yapılan sınıf ortamının teknolojik donanım durumunu dikkate alabilmek 3 Matematik öğretimi yapılan sınıf ortamının aydınlığı, havadarlığı vb. durumlarını dikkate alabilmek 4 Öğretim yapılan okulun bulunduğu toplumun yapısını dikkate alabilmek