Alinteri J. of Agr. Sci. (2021) 36(1): 77-83 e-ISSN: 2587-2249 [email protected] http://dergipark.gov.tr/alinterizbd http://www.alinteridergisi.com/ DOI:10.47059/alinteri/V36I1/AJAS21013
Determination of Factors Affecting Hazelnut Farmers' Agricultural
Insurance by Data Mining Algorithms
Figen Çukur
1• Tayfun Çukur
2*• Nuray Kızılaslan
3• Halil Kızılaslan
41Muğla Sıtkı Koçman University, Milas Vocational School, Department of Management and Organization, Turkey. E-mail: [email protected]
2*Muğla Sıtkı Koçman University, Milas Vocational School, Department of Marketing and Advertising, Turkey. E-mail: [email protected]
3Tokat Gaziosmanpaşa University, Agricultural Faculty, Department of Agricultural Economics, Turkey. E-mail: [email protected]
4Tokat Gaziosmanpaşa University, Agricultural Faculty, Department of Agricultural Economics, Turkey. E-mail: [email protected] A R T I C L E I N F O Article History: Received: 16.09.2020 Accepted: 15.11.2020 Available Online: 05.02.2021 Keywords: Decision Tree J48 Machine Learning Roc Curve A B S T R A C T
Agriculture is an open factory. With this characteristic of it, it faces many risks and uncertainties at any time. Farms are faced with natural, social and economical risks during the agricultural production period. Risk arising from natural conditions is the one of the most important risks in the agricultural sector. Agriculture is the only sector that meets the nutritional needs of the society. So it is very important protection of agriculture against risks. Agricultural insurance is one of the primary measures taken by farmers against these risks and uncertainties. For this reason, it is of great importance for farmers to have agricultural insurance in order to ensure economic sustainability. The main material of the study is the data collected from 70 different hazelnut producers in 7 villages in the Karasu district in the city of Sakarya in Turkey and they were selected with the purposeful sampling method. In the current study, it is aimed to determine the factors affecting farmers' getting agricultural insurance. According to the decision tree model created in the current study, it was determined that the factors affecting farmers' getting insurance are the amount of hazelnut production, non-agricultural income status, farmer's agricultural experience, total agricultural land assets and the profitability of hazelnut production. In the current study, the performances of different classification algorithms were also compared. According to the results of the research, it was determined that the classification algorithms used gave successful results. According to the results obtained with percentage split method, J48 and PART algorithms were determined to have the highest degree of accuracy in the cross validation method.
Please cite this paper as follows:
Çukur, F., Çukur, T., Kızılaslan, N. and Kızılaslan, H. (2021). Determination of Factors Affecting Hazelnut Farmers' Agricultural Insurance by Data Mining Algorithms. Alinteri Journal of Agriculture Sciences, 36(1): 77-83. doi: 10.47059/alinteri/V36I1/AJAS21013
Introduction
It is among the general characteristics of farmers engaged in small-scale agricultural production that businesses are run by family members, there is no product diversification, they experience economic fluctuation and their level of education is low. These conditions put farmers at various risks (Lopulisa et al., 2018).
*Corresponding author: [email protected] ORCID: 0000-0003-4273-6449
Agricultural production faces many risks compared to other production activities. Risks related to production, marketing, financing and human resources are among the primary risks faced by farmers. Each of these risks plays a role in the farmer's decision-making process. Therefore, it is very important to evaluate these risks and take appropriate measures (Girdziute and Slavickiene, 2012). Management of risks in agriculture is a big challenge for both researchers and politicians, as economic growth and agricultural growth are linked (Oladipo et al., 2018).
Recently, climate change has caused water shortages and serious natural disasters. Losses and harms caused by weather conditions in the agriculture sector have led to decrease in the agricultural production and food insecurity (Yoshida et al., 2019).
Agricultural insurance ensures that farmers are protected from financial losses. Insurance can allow farmers to take risks they would not normally take, as insurance creates a safety net. Insurance can allow farmers to invest in agricultural inputs. Insurance against risk promotes the availability of and demand for credit (Born et al., 2019).
Agricultural insurance is among the types of property insurance and protects farmers against certain risks (Marin, 2019). Agricultural insurance is considered to be one of the fastest growing insurance markets. Over the past few decades, agricultural insurance has an increasing role in improving food efficiency, ensuring food safety and helping to maintain economic growth (Zhu et al., 2019).
Concerns about food safety, price volatility and adverse weather conditions create the need to do more to protect and stabilize agricultural income and production capacity. Undoubtedly, agricultural insurance has an important place in solving these problems. By balancing revenues, insurance helps farmers to compensate for their crop losses due to negative weather conditions. Insurance also contributes to increasing the efficiency of farm resources and strengthening the sustainable development of agricultural businesses (Kurdys-Kujawska and Sompolska-Rzechula, 2018).
In the current study, it was aimed to determine the factors affecting farmers' getting insurance in the Karasu district in the city of Sakarya, where there is intense production of hazelnut. In the current research, the performances of different data mining algorithms were also compared.
Farmers have to make very different decisions during agricultural production. The decision on whether to take out agricultural insurance for farmers is also an important decision in terms of agricultural income. When the previous studies on agricultural insurance are analyzed, it is seen that many factors have an effect on farmers' decision to purchase agricultural insurance. Some of these studies are given below.
Xing et al. (2014) determined that the quality level of the cultivated land, farmers’ perceptions of the natural disaster loss rate and the ratio of household income to production losses have a significant effect on farmers' behaviour of risk management selection. In the research conducted by Liesivaara and Myyra (2014), it was determined that young farmers and large landowners showed more demand for agricultural product insurance. In the research conducted by Mutaqin and Usami (2019), it has been determined that the producers who cultivate big lands, communicate more with extentionists and have low product expectations for the next production season tend to have insurance. Wang et al. (2020) determined that farmers' positive past insurance experiences had a significant impact on their demand for insurance. In the study conducted by Nalinci and Kızılaslan (2019), it was determined that the status of having non-agricultural income, the source of
learning innovations, the factors that encourage the adoption of innovation, the frequency of listening to the radio, the frequency of reading the newspaper and the problems encountered in the agricultural insurance are related to farmers’ tendency to get insurance. In the research carried out by Kızıloğlu (2017), it was found that the factors that are statistically effective in deciding to get insurance are the education level of producers, the size of their land, their annual total income and their state of having continuous insurance due to the risk of permanent disaster. Tumer et al. (2019) found that there is a positive relationship between farmers' crop production experience, the number of individuals in the family, the farmer's level of education, crop production income, and the desire to expand the coverage of crop insurance and their willingness to have agricultural insurance. Aydın et al. (2016) determined that the education level, agricultural experiences, total annual income and total agricultural income, size of land and status of membership to the agricultural organizations have a positive effect on the status of getting agricultural insurance and the status of being engaged in non-agricultural activities have a negative effect. In the research conducted with hazelnut producers by Kabaoğlu and Birinci (2019), the main reason for the producers’ getting insurance was found to be that the producers are afraid to risk taking with 31.5%.
When the previous studies on the subject are evaluated in general, it is seen that statistical methods such as logistic regression analysis and probit analysis have been used in determining the factors that affect producers' having agricultural insurance. However, in the current study, data mining algorithms were used as a method. This is the most important feature that makes our study different from other studies.
Material and Methods
The main material of the study is the data collected from 70 different hazelnut producers selected with the purposive sampling method from 7 villages in the Karasu district in the city of Sakarya in Turkey. The data were collected through the questionnaire method. The data collected through a questionnaire belong to November 2017.
Data mining is a business of obtaining information considered to be valuable from large-scale data. In this way, it is possible to reveal the relationships between the data and make predictions when necessary. This means that data mining can be considered to be the process of uncovering hidden information that exists or may emerge in the future from all the data produced in an institution by using certain methods (Özkan, 2016). Data mining is not a solution by itself, but it supports decision making processes and provides the necessary information to solve the problem (Aydemir, 2019). The data mining process consists of many stages. These stages are given below:
1. Understanding the problem 2. Data selection
3. Pre-processing and data clearing 4. Establishment of the model
5. Interpretation and confirmation of the model (Baykal and Coşkun, 2018).
Data mining supports different techniques such as classification, clustering, association rule (Khedikar and Lobo, 2013). There are algorithms developed for each of these techniques. The main purpose of the classification is to correctly calculate the value of each class variable (Sarangi et al., 2013).
Within the context of the current study, J48, Hoeffding Tree, Random Tree, Random Forest, Bayes Net, Naive Bayes, IBk, KStar, LWL and PART classification algorithms were
used. In the evaluation of the performances of the algorithms, the degree of accuracy was taken as the criterion. In the study, a decision tree was also created for the J48 algorithm, which is one of the algorithms having the highest accuracy. The variables used in the study are shown in Table 1.
Table 1. Variables used in the data mining algorithms
Acronym Variable description Type of measure Data type AGE Age
If it is <31, then he/she is young
If it is 30<X<51, then he/she is middle-aged If it is >50, then he/she is old
Numerical
EXPE Agricultural experience Experience <=30 years, then he/she is experienced
Experience >30 years, then he/she is very experienced Numerical NONA Non-agricultural income Yes, he/she has; no he/she hasn’t Nominal LAND The size of the total agricultural land Size of land <=30 decare, then it is small
Size of land >30 decare, then it is big Numerical TREE The number of hazelnut trees The number of trees <1901, then the number is low The number of trees >1900, then the number is high Numerical PROD The amount of hazelnut production Production <=7 ton, then it is low
Production >7 ton, then it is high Numerical PROFIT The profitability of hazelnut production Profitable, not profitable Nominal
Results and Discussion
General Features of Producers and Businesses
The mean age of the producers was found to be 51.13. Of the producers, 98.57% are males and 1.43% are females. The mean household size was found to be 4.64.
When the producers’ levels of education are examined, it is seen that 64.29% are elementary school graduates, 15.71% are middle school graduates, 2.85% are university graduates and 4.29% are literate.
Of the producers, 25.71% (18 producers) were found to have non-agricultural income. Of these producers having extra income in addition to their agricultural income, 50% also earn money as workers and 27.78% as tradesmen. The rate of the producers having agriculture insurance was found to be 60%.
It was found that the producers have been in the business of hazelnut production for 39.44 years on average. The mean land size for hazelnut production was found to be 36.61 decares. The mean number of trees of the producers
was found to be 1936.93. The mean hazelnut production of the producers for the year 2017 was found to be 7.67 tons. Per-tree hazelnut yield was calculated to be 3.91 kg/tree.
Findings Obtained with the Decision Tree
In order to create the decision tree, 7 independent variables are included in the model: the age of the farmer, the farmer's agricultural experience, the state of having non-agricultural income, the total land size, the number of hazelnut trees, the amount of hazelnut production and the state of profitability of hazelnut production. The following 5 variables were found to be involved in the decision tree: hazelnut production, the state of having non-agricultural income, the farmer's agricultural experience, the total agricultural land size and the profitability of the hazelnut production (Figure 1).
Figure 1. Decision Tree
The decision tree generates rules. The decision tree obtained in the current study seems to have produced six rules. The rules created by the decision tree are shown in Table 2. First the decision tree’s state of production was examined. The producers having high hazelnut production are getting insurance. The experienced producers producing little and having non-agricultural income get agricultural insurance. The very experienced producers having little production and non-agricultural income were found to not get agricultural insurance on the other hand. Moreover, the producers having little production, having no non-agricultural income and having small agriculture land were found to not get agricultural insurance. The producers having little production, having no non-agricultural income, having big agriculture land and not finding hazelnut production profitable were found to get agricultural insurance.
The producers having little production, having no non-agricultural income, having big agriculture area and thinking that hazelnut production is profitable were found to have no agricultural insurance.
Table 2. Rules created by the decision tree (J48) Rule no Rules
1 If it is =muchproduct then yesinsurance 2 If it is =lowroduct and yes outagriculture and =experince then yesinsurance 3 If it is =lowroduct and yes outagriculture and =muchexperince then noinsurance 4 If it is =lowroduct and no outagriculture and =landsmall then noinsurance 5 If it is =lowroduct and no outagriculture and =landbig and no profitability then yesinsurance 6 If it is =lowroduct and no outagriculture and =landbig and yes profitability then nosinsurance
Findings obtained with the Classroom
Algorithms
Test and training groups for the determination of the classification success were determined through two different methods. In the first method, the data set was divided by using the percentage split method. In the percentage split method, 66% of the data set was allocated for training and 34% for test. In the second method, 10-fold cross validation method was employed.
When the results obtained through the percentage split method were examined, the J48 and PART algorithms were found to yield the best results with 75% accuracy rate in the model test (Table 3). According to this criterion, these algorithms were followed by Hoeffding Tree, Bayes Net, Naive Bayes, KStar, LWL algorithms with 70.83% accuracy rate. In the study conducted by Mangani and Kousalya (2019), the decision tree method was found to be an effective method in the prediction of crops insurance. In the study by Sheikh et al. (2016), the performance of the J48 algorithm (88.2%) was found to be better than that of the Naive Bayes algorithm (54.8%) in the prediction of weather.
In the study conducted by Masjkur and Tan (2019), stating that index-based insurance is a variety of crops insurance, the most successful algorithm in the determination of weather forecast for the yield estimation was found to be the Boosted Regression Tree.
Kappa statistics (Kappa coefficient) is used to measure the consistency between observations. 1 indicates a perfect compliance (Viera and Garrett, 2005). In the current study, the algorithms with the highest Kappa statistics were found to be the J48 and PART algorithms (Table 3).
Mean Absolute Error (MAE) is used to determine the absolute error between measurement values and model estimations. The closer the MAE value to zero is, the higher the ability of the model to estimate is (Eren and Eyüboğlu, 2011). In the current study, the algorithm having the best MAE value was found to be the PART algorithm (Table 3).
Root Mean Squared Error (RMSE) is used to determine the rate of error between the measurement values and model estimations and a RMSE value converging zero indicates that the estimation ability of the model increases (Eren and Eyüboğlu, 2011). In the current study, the algorithm with the lowest RMSE value was found to be the J48 algorithm (Table 3).
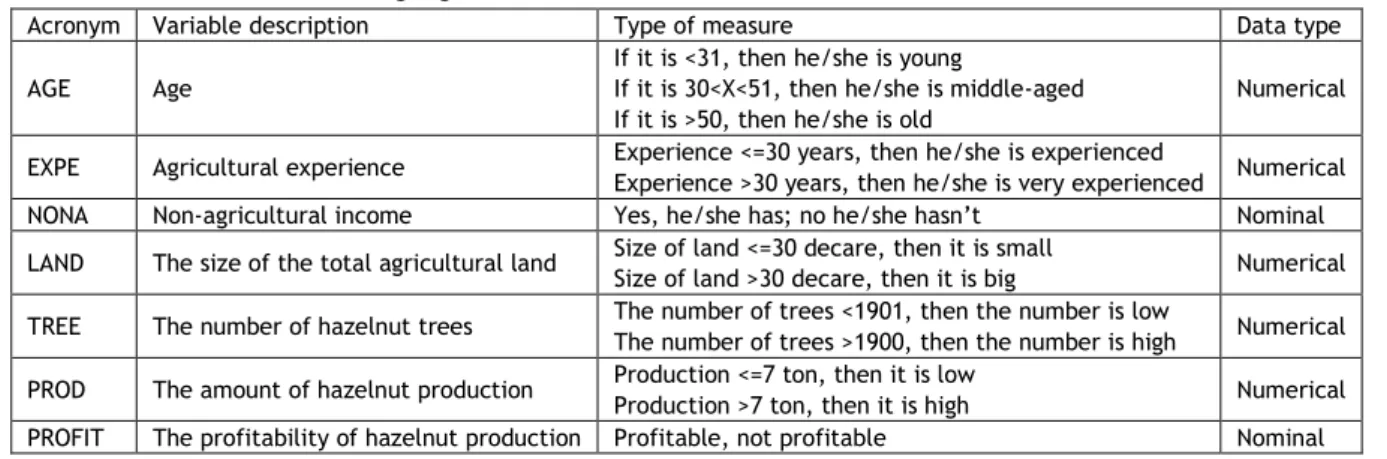
Table 3. Evaluation of classifiers with percentage split mode Classifier Kappa statistic
Correctly classified instances Mean absolute error Root Mean squared error J48 0.5000 18/24 (75%) 0.3921 0.4509 Hoeffding Tree 0.4167 17/24 (70.8333%) 0.4513 0.4753 Random Tree 0.3333 16/24 (66.6667%) 0.4306 0.5443 Random Forest 0.3333 16/24 (66.6667%) 0.4409 0.4817 Bayes Net 0.4167 17/24 (70.8333%) 0.4487 0.4735 Naive Bayes 0.4167 17/24 (70.8333%) 0.4513 0.4753 IBk 0.1667 14/24 (58.3333%) 0.4039 0.4796 KStar 0.4167 17/24 (70.8333) 0.4263 0.4705 LWL 0.4167 17/24 (70.8333) 0.4592 0.4914 PART 0.5000 18/24 (75%) 0.3919 0.4511
In the 10-fold cross validation method, the data set was divided into ten equal groups and 9 of them were used for training and 1 for test. In this way, 10 applications were conducted, one for test and 9 for training. In the 10-fold cross validation method, the highest degree of accuracy was found for the J48 and KStar algorithms with 68.5714% (Table 4).
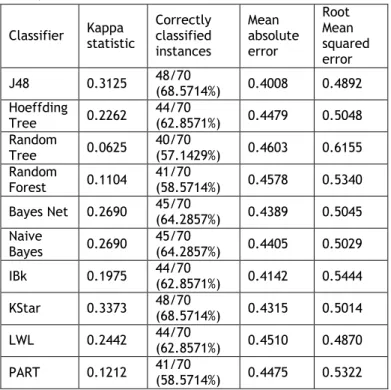
Table 4. Evaluation of classifiers with cross validation (10 folds) mode
Classifier Kappa statistic Correctly classified instances Mean absolute error Root Mean squared error J48 0.3125 48/70 (68.5714%) 0.4008 0.4892 Hoeffding Tree 0.2262 44/70 (62.8571%) 0.4479 0.5048 Random Tree 0.0625 40/70 (57.1429%) 0.4603 0.6155 Random Forest 0.1104 41/70 (58.5714%) 0.4578 0.5340 Bayes Net 0.2690 45/70 (64.2857%) 0.4389 0.5045 Naive Bayes 0.2690 45/70 (64.2857%) 0.4405 0.5029 IBk 0.1975 44/70 (62.8571%) 0.4142 0.5444 KStar 0.3373 48/70 (68.5714%) 0.4315 0.5014 LWL 0.2442 44/70 (62.8571%) 0.4510 0.4870 PART 0.1212 41/70 (58.5714%) 0.4475 0.5322
In the current study, the degrees of accuracy obtained with the percentage split method were found to be higher compared to the degrees of accuracy obtained with the cross validation method. In the study conducted by Pandey and Sharma et al. (2018), similar results were obtained and the degree of accuracy obtained with the percentage split method was found to be 82.58% for the J48 algorithm and the degree of accuracy obtained with the cross validation method was found to be 80.15% for the J48 algorithm. On the basis of the results of the decision tree, Njavro et al. (2007) concluded that the farmers trying to avoid risks should select livestock insurance as a tool of risk management.
ROC analysis is an analysis used to evaluate the performance of diagnostic tests and, more generally, to classify objects into two categories by evaluating the accuracy of the statistical model (Zou et al., 2007). The ROC value ranges from 0.5 to 1, with a value of 1 indicating a perfect fit, while 0.5 indicates a random fit (Ayalew and Yamagishi, 2005). According to the results of ROC analysis in the current study, the J48 algorithm was determined as the closest to 1 with 0.75 ROC score (Table 5).
Table 5. ROC analysis results
Classifier ROC value
J48 0.7500 Hoeffding Tree 0.6979 Random Tree 0.5972 Random Forest 0.6632 Bayes Net 0.7396 Naive Bayes 0.6979 IBk 0.7292 KStar 0.7674 LWL 0.7396 PART 0.7083
The ROC curve obtained for the J48 algorithm is shown in Graph 2. The closer the graph is to the upper left corner, the better it is accepted to classify. In other words, the larger the area under of the graph and the more it is approaching 1, the more successful the classification is (Aydemir, 2019).
Figure 2. ROC curve Conclusion
It has been determined that the farmers participating in the current research are middle-aged, primary school graduates and have been engaged in hazelnut production for a long time in general. In the study, it was determined that the rate of producers getting agricultural insurance is 60%. This rate shows that farmers do not have sufficient knowledge about and awareness of agricultural insurance. It is thought that increasing this rate will be very useful for farmers. Since it will be difficult to give formal education to farmers, it should be aimed to increase awareness of agricultural insurance through informal education.
In the current research, a positive relationship was determined between the amount of hazelnut production and getting agricultural insurance. For this reason, measures should be taken to increase the hazelnut production and productivity of farmers.
Data mining techniques are used extensively in the fields of health, education, transportation and finance. This study is considered important in terms of demonstrating that data mining techniques result in successful outcomes in research focusing on agriculture sector and especially on the adoption of agricultural insurance. In the current study, the performances of the different classification algorithms selected to determine the factors having impact on farmers' preference for agricultural insurance were compared. When the research results were examined, it was determined that the classification algorithms used gave successful results. In the study, the J48 and PART algorithms were found to have the highest degree of accuracy. Although the accuracy levels obtained in the current study are satisfactory, it is possible to further increase the accuracy levels. Therefore, it is thought that it will be useful to increase the number of questionnaires and attributes in the future studies on the subject.
Authors’ Contributions: Author TÇ designed the study, HK and NK make a survey, FÇ performed and managed
statistical analyses. All authors read and approved the final manuscript.
Conflict of Interest: The authors declare that there is no conflict of interest.
Acknowledgements
We wish to thank all farmers that participated in our study.
References
Ayalew, L., and Yamagishi, H., 2005. The application of GIS-based logistic regression for landslide susceptibility mapping in the Kakuda-Yahiko Mountains, Central Japan. Geomorphology, 65(1-2): 15-31.
Aydın, B., Özkan, E., Hurma, H., and Yılmaz, F., 2016. Approach of producers to product insurance practices in Kırklareli and Edirne provinces. Derim, 33(2): 249-262.
Aydemir, E., 2019. Artificial Intelligence with Weka, 2nd Edition, Seçkin Publishing, Ankara.
Baykal, A., and Coşkun, C., 2018. Performance analysis of classification algorithms of several data mining softwares. Middle East Journal of Science, 4(2): 104-112.
Born, L., Spillane, C., and Murray, U., 2019. Integrating gender into index-based agricultural insurance: a focus on South Africa. Development in Practice, 29(4): 409-423.
Eren, B., and Eyüpoğlu, V., 2011. Modeling Ni (II) ion recovery efficiency with artificial neural networks. In A. Varol (Ed.), 6th International Advanced Technologies Symposium, Elazığ, Turkey, 186-190. Girdziute, L., and Slavickiene, A., 2012. Decision making in
agriculture and insurance as a risk management tool. Agricultural Sciences, 19(1): 45-52.
Kabaoğlu, H., & Birinci, A., 2019. Approaches of Hazelnut Producers to Agricultural Insurance and Determination of Future Attitudes: The Case of Düzce Province. Journal of Iğdır University Institute of Science, 9(3), 1719-1728.
Khedikar, K.A., and Lobo, L.M.R.J., 2013. Data Mining: You’ve missed it If Not Used. IOSR Journal of Computer Engineering, 6-14.
Kızıloğlu, R., 2017. Determination of Factors Affecting Producers to Have Agricultural Insurance Out (Konya Province Akşehir District Example). Alınteri Journal of Agricultural Sciences, 32(1):19-26.
Kurdys-Kujawska, A., and Sompolska-Rzechula, A., 2018. Determinants of farmers demand for subsidized agricultural insurance in Poland. In V. Dislere (Ed.), Proceedings of the 2018 International Conference "Economic Science for Rural Development", Jelgava, Latvia, 164-173.
Liesivaara, P., and Myyra, S., 2014. Willingness to pay for agricultural crop insurance in the northern EU. Agricultural Finance Review, 74(4): 539-554.
Lopulisa, C., Neswati, R., Ramlan, A., and Suryani, I., 2018. The emerging roles of agricultural insurance and farmers cooperatives on sustainable rice productions
in Indonesia. IOP Conference Series: Earth and Environmental Science, 157: 1-7.
Mangani, K.P., and Kousalya, R., 2019. Weather based prediction model for recommending the crop insurance using cart algorithm. International Journal of Computer Trends and Technology, 67(4): 1-4. Marin, L., 2019. Classification of risks in agricultural
insurance. Scientific Papers Series Management, Economic Engineering in Agriculture and Rural Development, 19(4): 173-178.
Masjkur, M., and Tan, K.S., 2019. Comparing decision tree, random forest and boosting in identifying weather index for rice yield prediction. In F.M. Afendi, K.Sadik, U.D. Syafitri (Ed.), Proceedings of the 1st International Conference on Statistics and Analytics, Bogor, Indonesia, 454-463.
Mutaqin, D.J., and Usami, K., 2019. Smallholder farmers’ willingness to pay for agricultural production cost insurance in rural west Java, Indonesia: a contingent valuation method (cvm) approach. Risks, 7(69): 1-18. Nalınci, S., and Kızılaslan, H., 2019. Analysıs of the Attıtude
of the Manufacturers agaınst Rısk and the Factors Affectıng the Agrıcultural Insurance Decısıon Process. Gaziosmanpaşa Scientific Research Journal, 8(2), 98-112.
Njavro, M., Par, V., and Plesko, D., 2007. Livestock insurance as a risk management tool on dairy farms. Poljoprivreda, 13(1):78-82.
Oladipo, O.F., Oluwafunmilola, O.O., Adesoji, S.A., and Daudu, A.K., 2018. Fish farmers’ attitude toward agricultural insurance scheme in Ondo State Nigeria. Journal of Agricultural Extension, 22(3): 97-108. Özkan, Y., 2016. Data Mining Methods, 3. Edition, Papatya
Publishing Education, Istanbul.
Pandey, M., and Sharma, V.K., 2013. A decision tree algorithm pertaining to the student performance analysis and prediction. International Journal of Computer Applications, 61(13): 1-5.
Sarangi, S.K., Jaglan, V., and Dash, Y., 2013. A review of clustering and classification techniques in data mining. International Journal of Engineering, Business and Enterprise Applications, 4(2):140-145. Sheikh, F., Karthick, S., Malathi, D., Sudarsan, J.S., and
Arun, C., 2016. Analysis of data mining techniques for weather prediction. Indian Journal of Science and Technology, 9(38): 1-9.
Tümer, E.İ., Ağır, H.B., and Uslu, Z., 2019. Willingness of Farmers to Have Agricultural Insurance: The Case of Ilgın District of Konya Province. Kahramanmaraş Sütçü İmam University Journal of Agriculture and Nature, 22(4): 571-576.
Viera, A.J., and Garret, J.M., 2005. Understanding interobserver agreement: the kappa statistic. Family Medicine, 37(5): 360-363.
Wang, H.H., Liu, L., Ortega, D.L., Jiang, Y., and Zheng, Q., 2020. Are smallholder farmers willing to pay for different types of crop insurance? An application of labelled choice experiments to Chinese corn growers. The Geneva Papers on Risk and Insurance - Issues and Practice, 45: 86-110.
Xing, H., Jin, J., and Tao, J., 2014. The factors influencing the Hubei farmers’ behavior of risk management
under agricultural insurance. Eastern Academic Forum: 192-200.
Yoshida, K., Srisutham, M., Sritumboon, S., Suanburi, D., Janjırauttikul N., and Suanpaga W., 2019. Evaluation of economic damages on rice production under extreme climate and agricultural insurance for adaptation measures in northeast Thailand. Engineering Journal, 23(6): 451-460.
Zou, K.H., O’malley, A.J., and Mauri, L., 2007. Receiver-operating characteristic analysis for evaluating diagnostic tests and predictive models. Circulation, 115(7): 654-657.
Zhu, W., Tan, K.S., and Porth, L., 2019. Agricultural insurance ratemaking: development of a new premium principle. North American Actuarial Journal, 23(4): 512-534.