A Study On Pre-Service Teachers’ Spatial Visualization
Ability and Spatial Anxiety1
Öğretmen Adaylarının Uzamsal Görselleştirme Yetenekleri ve Uzamsal Kaygıları Üzerine Bir Çalışma
Özlem Erkek, Mine Işıksal, Erdinç Çakıroğlu
Orta Doğu Teknik Üniversitesi, Eğitim Fakültesi, Matematik ve Fen Bilimleri Eğitimi Bölümü, Ankara
İlk Kayıt Tarihi:03.03.2015 Yayına Kabul Tarihi:03.05.2016 Abstract
This study aims to investigate the pre-service teachers’ spatial visualization ability and spatial anxiety levels with respect to their gender and undergraduate programs. Data were collected from 1007 third and fourth year undergraduate pre-service teachers enrolled in elementary mathematics, science, and early childhood education programs from four universities in Ankara, Turkey. Spatial Visualization Test and the Spatial Anxiety Scale were used as data collection instruments. The results revealed a statistically significant difference between the spatial visualization ability and spatial anxiety scores of participants in terms of both gender and undergraduate program.
Keywords: Spatial visualization ability, spatial anxiety, pre-service teachers.
Özet
Bu çalışmanın amacı öğretmen adaylarının cinsiyetlerini ve lisans programlarını dikkate alarak uzamsal görselleştirme yetenekleri ve uzamsal kaygı seviyelerini incelemektir. Veriler ilköğretim matematik, fen bilgisi ve okulöncesi öğretmenliği bölümlerinde üçüncü ve dördüncü sınıfta okuyan 1007 öğretmen adayından toplanmıştır. Veri toplama aracı olarak Uzamsal Görselleştirme Testi ve Uzamsal Kaygı Ölçeği kullanılmıştır. Bulgular katılımcıların uzamsal görselleştirme ve uzamsal kaygı puanlarının cinsiyetlerine ve lisans programlarına göre anlamlı düzeyde farklılaştığını göstermiştir.
Anahtar Kelimeler: Uzamsal görselleştirme yeteneği, uzamsal kaygı, öğretmen adayları.
1. Introduction
Spatial perception is important for individuals because it is “necessary for interp-reting, understanding, and appreciating our inherently geometric world” (NCTM, 1989, p. 48). In general, spatial ability was claimed to be an ability related to the use of space (Olkun, 2003). As for spatial visualization ability, it corresponds to one of the
major components of spatial ability requiring mental manipulation of visual objects (McGee, 1979). Spatial visualization ability could affect not only daily life but also school life of individuals since in the literature numerous studies have documented a positive relationship between spatial visualization ability and mathematics achieve-ment (Battista, 1994; Fennema & Sherman, 1977; Guay & McDaniel, 1977; Guzel & Sener, 2009; Jakubowski & Unal, 2004; Manger & Eikeland, 1998; Mitchelmore, 1976). For instance, Guzel and Sener (2009) claimed that spatial ability is associated with the comprehension of symbols, shapes, and figures. They also pointed out the importance of spatial ability in mathematics achievement, since it helps students to make sense of figures, shapes, or graphs, to interpret the visual representations, to no-tice the links between different concepts easily, to make generalizations about comp-lex concepts, and to think in a multidirectional way (Guzel & Sener, 2009). Teachers who lack spatial visualization abilities or who have spatial anxieties may have diffi-culties in providing their students with effective learning opportunities through visual materials. It can be argued that teacher education programs should pay attention to the spatial visualization abilities of pre-service teachers. However, spatial visualization ability levels of pre-service teachers have not been studied in mainstream spatial vi-sualization ability literature. In addition, literature review revealed that many studies focused on gender difference in spatial ability (Battista, 1990; Halpern, Beninger, & Straight, 2011; Kaufman, 2007; Lawton, 1994; Linn & Petersen, 1985; Mohler, 2008; Nemeth, 2007). Although most of the studies investigating spatial ability of different age groups reveal that males have higher spatial ability (Battista, 1990; Ben-Chaim, Lappan & Houang, 1988; Halpern, Beninger, & Straight, 2011; Kaufman, 2007; Law-ton, 1994; Mohler, 2008; Nemeth, 2007) there is still room for more work especially at undergraduate level. Thus, the focus of the present study is to investigate the pre-service teachers’ spatial visualization ability and spatial anxiety with respect to their undergraduate program and gender.
1.1. Theoretical Background
There exist several definitions of spatial ability in the literature. For instance, Loh-man (1993) defined spatial ability as the skill of generating, retaining, retrieving, and transforming well-structured visual images, while in another study, spatial ability was defined as the skill of mentally manipulating objects and their parts in 2D and 3D space (Olkun, 2003). In a recent study, Mulligan (2015) defined spatial ability as “the ability to recognize and mentally manipulate the spatial properties of objects and the spatial relations among objects” (p.513). Spatial ability is an important element of intellectual ability (Boulter, 1992), that involves not only rotating, manipulating or transforming a visual object but also visualizing the appearance of an object after a motion takes place. Whiteley, Sinclair and Davis (2015) also listed the skills characte-rizing the spatial ability as locating, orienting, decompozing/recomposing, balancing, diagramming, symmetry, navigating, comparing, scaling, and visualizing.
vi-sualization and spatial orientation (Battista, 1994; Hegarty & Waller, 2004; McGee,
1979). McGee (1979) described spatial visualization as “the ability to mentally ma-nipulate, rotate, twist, or invert a pictorially presented stimulus object” (p. 893). In addition, he defined spatial orientation as “the comprehension of the arrangement of elements within a visual stimulus pattern, the aptitude to remain unconfused by the changing orientations in which a spatial configuration may be presented” (p. 897). With respect to McGee’s (1979) view, if individuals possess well-developed spati-al visuspati-alization ability, they can move the object mentspati-ally and imagine the visuspati-al representation from different views. On the other hand, if individuals possess a high level of spatial orientation ability, they will comprehend the arrangement of elements within a visual pattern and not be affected when their own orientation is changed around the visual object (McGee, 1979). In addition, they can easily imagine how the elements of an object are arranged. In the literature, in addition to studies that focus on dimensions of spatial ability individually, there are others that consider spatial ability in general sense. For this reason, in this paper, the terms “spatial ability” and “spatial visualization ability” will be used interchangeably.
A widespread evidence has been provided that spatial reasoning can be developed in all ages from early childhood to adulthood (Hawes, Tepylo & Moss, 2015). In particular, many research studies found out that spatial ability of an individual can be improved by means of effective instruction in which concrete materials (Battista, Cle-ments, Arnoff, Battista, & Borrow, 1998; Robichaux, 2000), manipulatives (Bishop, 1973), digital manipulatives (Olkun, 2003), various toys (Roorda, 1994; Tracy, 1987) and computer programs (Francis, Khan, & Davis, 2016; Onyancha, Derov, & Kinsey, 2009) are employed. For instance, Robichaux (2000) concluded that spatial visuali-zation abilities of undergraduates majoring in architecture, mathematics education, mathematics and mechanical engineering are significantly related to their childhood experiences. In a recent study, Francis, Khan and Davis (2016) examined how the spatial reasoning of the children aged 9 to 10 developed when they were learning how to program LOGO, Mindstorms and EV3 robots. During the coding process, children were imagining the robot movements in three dimension while they were coding in two dimension. The researchers asserted that this coding application included fluency in shifting between 2D and 3D and developed children’s spatial reasoning (Francis, Khan, & Davis, 2016).Similarly, Sundberg (1994) organized a summer school with 36 voluntary students who were distributed to four groups randomly. Two groups were spatial groups in which concrete materials such as geoboards, tangram pieces, cubes, spatial puzzles and pentominoes were used to develop students’ spatial visua-lization ability while the other two groups were traditional geometry instruction gro-ups in which an eighth grade textbook was used. Mathematics achievement test and Spatial Visualization Test developed in Middle Grades Mathematics Project (MGMP, 1983) were administered as pre and post tests. The results indicated that there was an increase in the spatial visualization ability levels of 6th, 7th and 8th grade students in spatial groups subsequent to receiving instruction based on concrete materials.
Ho-wever, there was no difference in spatial visualization ability levels of the students in traditional instruction groups. In addition to middle grade students, there were also research studies with young children regarding spatial visualization ability. Roorda (1994) and Tracy (1987), for instance, found out that playing with various toys imp-roved the spatial ability of children to a significant degree. Thus, it can be claimed that individuals’ experiences have a significant role in the development of their spatial visualization abilities.
A review of the literature illustrated that one of the important issues in studies re-lated to spatial ability is gender (Battista, 1990; Halpern, Beninger, & Straight, 2011; Kaufman, 2007; Lawton, 1994; Linn & Petersen, 1985; Mohler, 2008; Nemeth, 2007). There is no consensus in the literature about gender difference regarding spatial ability but most of the studies supported that males have better spatial ability than females. For instance, Nemeth (2007) investigated the engineering students’ spatial ability de-velopment and concluded that male and female students’ spatial ability performances are different, in favor of males. Similarly, Battista (1990) reported in his crossectional study that, in high school, males outperformed females in most situations requiring spatial visualization (Battista, 1990). In the same way, Ben-Chaim, Lappan and Ho-uang (1988) conducted a study on fifth through eighth grade students to investigate differences in spatial visualization abilities and effects of instruction on spatial visu-alization skills by grade, gender and site. They found a positive correlation between grade level and spatial visualization skills and reported male superiority in their study. On the other hand, Linn and Petersen (1985) indicated that there were gender differen-ces in two of three categories of spatial ability, especially a large gender difference for mental rotation which requires rotation of two-dimensional or three-dimensional ob-jects in the mind and involves Gestalt-like analogue process. The reasons underlying gender differences in spatial ability are attributed to multiple factors, which include genetic factors (Coluccia & Louse, 2004; Linn & Petersen, 1985), educational experi-ences (Richardson, 1994; Sorby, Leopold, & Gorska, 1999), parental encouragements towards gender-typed activities (Lytton & Romney, 1991) and social experiences (Ba-enninger & Newcombe, 1989; Ramirez, Gunderson, Levine, & Beilock, 2012).
As the other variable of the present study, spatial anxiety, which was defined as “anxiety about environmental navigation” (Lawton, 1994, p. 767), is an important factor affecting individual’s behaviors and performance. It is indicated that different stressors like spatial anxiety have negative impacts on individuals’ performance on the grounds that worries caused by these stressors interfere with their working me-mory (Ramirez et al., 2012). In the literature, much research investigated the gender differences regarding anxiety (Lawton, 1994; Lawton & Kallai, 2002; O’Laughlin, & Brubaker, 1998; Ramirez et al., 2012; Schmitz, 1997). For instance, in a study by O’Laughlin and Brubaker (1998), females demonstrated a higher level of anxiety in drawing the plan of a floor and were not as successful as males in way-finding tasks in a building. Likewise, a study by Lawton (1994) reported that females, compared to
males, experienced greater anxiety levels in navigation tasks. Moreover, males pre-ferred global reference points, such as cardinal directions, North, South, East and West, to explain their strategies, whereas females preferred landmarks. On the other hand, there are also studies reporting results which indicated no significant difference in way-finding strategies and anxiety levels by gender. For example, an experimental study conducted by Hund and Minarik (2006) with adults, whose ages change be-tween 19 and 47, indicated that there was no significant gender difference in terms of the spatial anxiety level, navigation time and navigation errors. Briefly, spatial anxiety has the potential to affect especially females’ performances requiring the use of spatial visualization ability negatively.
In addition to the above studies, related literature also includes studies that exam-ine the relationship among spatial perception and mental rotation, which are two com-ponents of spatial ability, and spatial anxiety (Lawton, 1994; Ramirez et al., 2012). To illustrate, Lawton (1994) found a significant relationship between spatial anxiety and the use of strategies which are route and orientation. A route strategy was defined as “attending to instructions on how to get from place to place” (Lawton, 1994, p.765) while an orientation strategy is defined as “maintaining a sense of their own position in relation to environmental reference points” (Lawton, 1994, p.765). It is believed that spatial anxiety prevents people from focusing on the clues in the environment to find their way. The results of the study by Lawton (1994) indicated a positive relation-ship between orientation strategy and spatial perception, but a negative relationrelation-ship between orientation strategy and spatial anxiety. Thus, Lawton (1994) concluded that if individuals have greater spatial anxiety, they are more liable to get lost. In another study, Ramirez et al. (2012) investigated the relationship between spatial anxiety and the mental rotation component of the spatial ability of young children by considering their working memory and gender. They concluded that young children experienced spatial anxiety, which negatively impacted their mental rotation ability. As for gender, their findings indicated that females had greater spatial anxiety than males. In addi-tion, it was found that females preferred to employ verbal problem solving strategies, while males preferred to use the spatial approach (Ramirez et al., 2012).
1.2. Rationale
Pre-service teachers of different grade levels and undergraduate majors take cour-ses in which they can use or enhance their own spatial visualization ability in Turkey. For instance, pre-service early childhood teachers are required to complete courses, such as “Visual Art and Material Development” and “Anatomy and Physiology”. These courses could contribute to their spatial understandings. Similarly, pre-service elementary science teachers need to make use of their spatial visualization abilities in most of their undergraduate courses. For instance, in “Organic Chemistry” and “Inorganic Chemistry” courses, chemical bonding structures of compounds are often drawn. Being able to draw the chemical bonding structures of compounds primarily necessitates the mental visualization of these structures and their manipulation. In
the same frame of mind, spatial visualization ability is also important for pre-service mathematics teachers because spatial visualization ability is used very often in ele-mentary mathematics teacher education program courses especially in the topics relat-ed to 2D and 3D geometry. Regardless of the areas they specialize in, all pre-service teachers may often encounter situations in which they need to use their own spatial visualization ability during instructional processes. However, different undergraduate programs have different curricula. In this sense, the answers of the following ques-tions are of great importance. Is the spatial visualization ability level of pre-service teachers majoring in different areas developed enough to be able to contribute to their students’ spatial visualization ability? Does the spatial visualization ability level vary according to the undergraduate program enrolled or gender? If the differences exist in terms of the undergraduate program or gender, this could affect pre-service teachers’ teaching activities and so their students’ spatial visualization ability level could also differ. Thus, it can be inferred that spatial visualization ability is an issue to be consid-ered in teacher education programs of different areas.
Although there are studies conducted with different age groups’ spatial visualiza-tion ability, the current spatial visualizavisualiza-tion ability level of pre-service teachers is an aspect that has not been discussed in spatial visualization ability literature. In order to improve the quality of teacher education, the differences in terms of the undergra-duate program or gender should be specified and awareness regarding the importance of spatial visualization ability should be raised. For this reason, this study aims to eliminate this gap by exploring spatial visualization ability of pre-service teachers majoring in Early Childhood, Elementary Science, and Elementary Mathematics Edu-cation programs.
Spatial anxiety has the potential to affect individual performance in tasks requiring the spatial visualization ability since it was asserted that spatial ability is negatively related to spatial anxiety (Lawton, 1994, 1996; Ramirez et al., 2012). Hence, the spa-tial anxiety level of pre-service teachers has a potenspa-tial to affect the teaching of the tasks related to spatial visualization negatively. If teachers do not feel competent eno-ugh in teaching spatial tasks or they have high spatial anxiety, they might avoid doing spatial activities or ignore tasks related to the spatial visualization ability, and this si-tuation will limit students’ spatial reasoning (Levine, Ratliff, Huttenlocher & Cannon, 2012). Morover, since today’s pre-service teachers are tomorrow’s inservice teachers, examining their spatial anxiety may give valuable clues for their future practices in the use of spatial visualization ability.
To sum up, spatial visualization ability and spatial anxiety are two important issu-es to be considered in pre-service teachers’ future teaching performancissu-es. Yet, thissu-ese issues still lack attention in the Turkish curriculum. Having the potential to affect in-dividuals’ interpretations, visualization and orientation in daily and professional life, this study will bridge the gap by exploring spatial visualization ability and spatial an-xiety of pre-service teachers with respect to their undergraduate program and gender.
In accordance with the above-mentioned rationale, the present study seeks to answer the following research questions:
1. Is there a significant difference in pre-service teachers’ spatial visualization ability in terms of undergraduate program and/or gender?
2. Is there a significant difference in pre-service teachers’ spatial anxiety in terms of undergraduate program and/or gender?
2. Method 2.1. Participants
Three public and one private university in Ankara, the capital of Turkey, offering elementary level undergraduate teacher education programs – Elementary Mathema-tics Education (EME), Elementary Science Education (ESE), and Early Childhood Education (ECE) programs – were selected for this study. In total, the study group comprised of 1007 third and fourth grade students who had completed most of the-ir undergraduate courses offered in the mentioned programs. The study group was comprised of 783 (77.86%) female students and 224 (22.24%) male students (Tab. 1). The number of females was higher than that of males in each undergraduate program. Table 1. The number of pre-service teachers across the universities and
prog-rams based on gender
Male Female Total %
Universities University 1 38 120 158 15.7 University 2 55 222 277 27.5 University 3 124 359 483 48 University 4 7 82 89 8.8 Undergraduate Program EME 114 286 400 39.7 ESE 105 331 436 43.3 ECE 5 166 171 17 Total 224 783 1007 100
Before conducting the study, all participants were provided with information abo-ut the nature and purpose of the study and the voluntary students participated in the study. In addition, they were informed that they could withdraw their contributions at any time without penalty. All ethical aspects of this study were approved by The Human Ethics Committees of the participant universities.
2.2. Data Collection Instruments
Vi-sualization Test (SVT) and the Spatial Anxiety Scale (ANX). Both of the scales were administered in a single session of the students’ classrooms by the first author. The completion of the tests lasted approximately 35 minutes. In most of the classes, data collection was done at the end of the regular class hour after the instructor of the class finished lecturing.
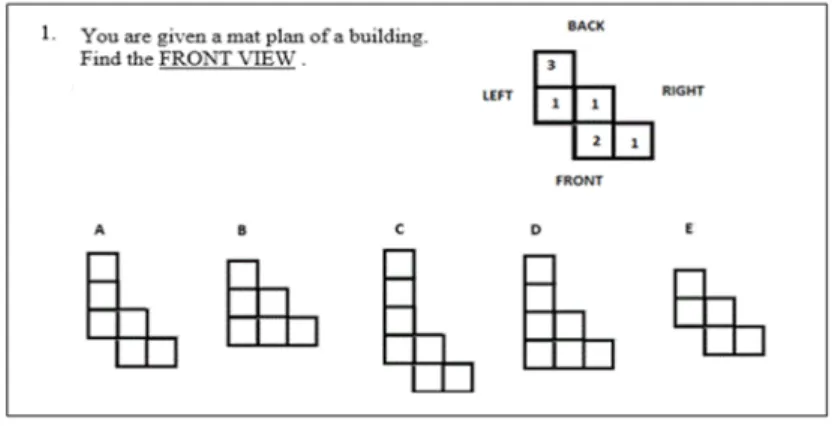
The Spatial Visualization Test (SVT) was originally developed for 6th, 7th and 8th grade students in the Middle Grades Mathematics Project (MGMP, 1983). However, the test was applied to adults in many studies since some of the images were too complex for elementary school students to mentally rotate or visualize (Robichaux, 2000). SVT has 32 multiple choice items including representations such as 2D flat view, 3D corner view, and “map plan”. In a map plan, there are numbers inside squa-res repsqua-resenting the number of cubes to be placed on that square. The items in the test require finding either flat or corner views of buildings, adding and removing cubes, combining two solids, and appliying the map plan (Ben-Chaim, Lappan & Houang, 1988). In this study, spatial visualization ability refers to mental manipulation, rota-tion, twisting or inversion of a pictorially presented stimulus object (McGee, 1979). The SVT items falls within the domain of spatial visualization described by McGee (1979) and spatial visualization subfactor in Lohman’s spatial ability categorization (Lohman & Kyllonen, 1983). In addition, the sample of this study includes pre-service teachers of different areas and SVT not being dependent on specific mathematics con-tent or a specific age group. Therefore, this instrument was regarded as appropriate for measuring the spatial visualization ability level of pre-service teachers from different backgrounds. Sample item of SVT is illustrated in Figure 1.
Figure 1. Sample item from the spatial visualization test
The sample item in Figure 1 asks for the front view of a building, the top view of which is given. In this item, the participant needs to imagine the 3D view of the buil-ding mentally to arrive at the desired view.
SVT was previously used by Ben-Chaim, Lappan and Houang (1988) and in that study they administered the test with Differential Aptitude Space Relations Test on the students in grades 8 through 12. In order to provide evidence for validity, they calculated the correlation coefficient as .66 that means high correlation according to the guidelines suggested by Cohen (1988, pp. 79-81). In addition, in the literature, the Cronbach’s alpha value for that scale was reported to change in the range of .72 and .86 which was of satisfactory value. In the present study, SVT was adapted into Turkish by the researchers so that the participants, whose native language is Turkish, could comprehend the items more easily. In order to assure the content validity of the scale, the expert opinions of mathematics educators were received. Using the KR-20 formula, the reliability was calculated as .73. Thus, SVT could be accepted as valid and reliable instrument.
The Spatial Anxiety Scale (ANX) was developed by Lawton (1994) to measure the level of anxiety felt by an individual in given situations which required spatial/navi-gational skills. The instrument comprised 8 items and was based on a 5-point Likert type scale with two end points labeled from ‘Not at all’ to ‘Very much’. The partici-pants were asked to rate the level of anxiety they believed they would feel in each of the situations described in the items. A sample item read as follows: “Pointing in the direction of a place outside that someone wants to get to and has asked you for direc-tions, when you are in a windowless room”. Obtaining a high score from this scale in-dicates having a high level of spatial anxiety. This scale was the only scale measuring the spatial anxiety level of adults in the accessible literature and the statements in the items were about daily life situations. Thus, this scale was accepted to be appropriate for measuring the spatial anxiety level of pre-service teachers.
The spatial anxiety scale was translated into Turkish by the researchers and during the translation process, experts in teacher education and mathematics education were consulted in order to assure conceptual translation of the items match the original English statements. In order to assure construct validity, the researchers also conduc-ted a factor analysis, which resulconduc-ted in unifactor structure as in the original scale, and this factor explained 52.83% of the total variance. The Cronbach’s alpha was found to be .87, which indicated that the spatial anxiety scale was reliable.
2.3. Data Analysis
The Spatial Visualization Ability test (SVT) has 32 multiple choice items. If the answer for an item is correct, the participant gets 1 point; otherwise s/he gets no points. After scoring all items, a total score has been calculated for all participants. Namely, the highest score that could be taken from SVT was 32 points. As for the spatial anxiety scale, the mean score of 8 items has been calculated for all participants.
After scoring the data, the distribution was examined considering normal distribu-tion with Lilliefors Kolmogorov–Smirnov test (p<.05), histogram graphics, Skewness
(between +1 and −1) and Kurtosis (between +2 and –2). Then, descriptive statistics were analyzed for spatial visualization and spatial anxiety test scores separately. In order to examine the difference between SVT and ANX scores in terms of undergra-duate program and gender, a two-way ANOVA was performed. However, preliminary analysis revealed that the homogeneity of variance assumption was violated because there were few male students in the ECE undergraduate program. Thus, a one-way ANOVA and an independent samples t-test were used to investigate the difference in terms of undergraduate program and gender, respectively. On the other hand, the as-sumptions were assured for spatial anxiety scores, so a two-way ANOVA was used in order to examine the impact of undergraduate program and gender on anxiety scores of pre-service teachers.
3. Results
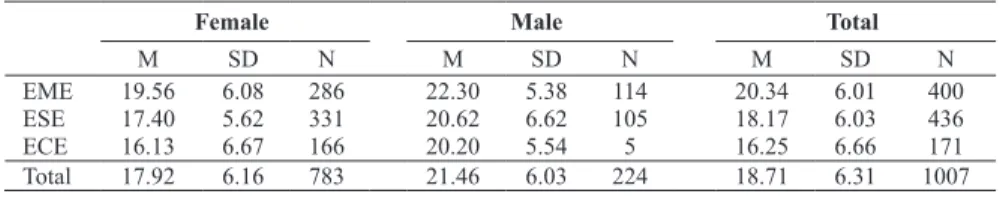
In order to investigate the difference in pre-service teachers’ spatial visualization abilities in terms of undergraduate program and gender, first, descriptive statistics were examined (Tab. 2). The mean scores of SVT for all undergraduate programs were found to be 18.71 out of 32, indicating that participants of the study had rela-tively moderate levels of spatial visualization ability. Undergraduate students in EME program had the highest mean score (M =20.34, SD = 6.01), while the students in ECE program obtained the lowest (M =16.25, SD = 6.66). The mean scores of males were higher than that of females for all undergraduate programs.
Table 2. Descriptives for Spatial Visualization Test scores by undergraduate program and gender
Female Male Total
M SD N M SD N M SD N
EME 19.56 6.08 286 22.30 5.38 114 20.34 6.01 400
ESE 17.40 5.62 331 20.62 6.62 105 18.17 6.03 436
ECE 16.13 6.67 166 20.20 5.54 5 16.25 6.66 171
Total 17.92 6.16 783 21.46 6.03 224 18.71 6.31 1007
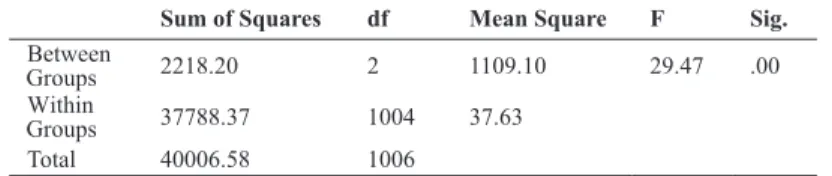
The one-way ANOVA results (Tab. 3) revealed that the difference among three undergraduate programs in terms of SVT scores was statistically significant (F(2, 1004) = 29.47, p < .01). The Post-Hoc comparison using the Tukey HSD test indicated that the spatial visualization mean score of EME students (M = 20.34) was significantly higher than those of ESE (M = 18.17) and ECE students (M = 16.25). Moreover, the mean score for ECE students was significantly lower than that of the EME and ESE students. Eta squared value was calculated as .06 indicating that six percent of the variance in the SVT was explained by the variable undergraduate prog-ram. Eta squared value corresponds to a small effect (Cohen, 1988) indicating practi-cal significance in addition to the statistipracti-cal significance.
Table 3. One-way ANOVA results for Spatial Visualization Test scores in terms of undergraduate program
Sum of Squares df Mean Square F Sig.
Between
Groups 2218.20 2 1109.10 29.47 .00
Within
Groups 37788.37 1004 37.63
Total 40006.58 1006
To identify the difference between male and female students’ spatial visualization test scores, an independent sample t-test was run (Tab. 4). The results revealed a sta-tistically significant difference in favor of males (t(1005) = -7.63, p < .01). The eta squared value for gender difference was calculated as .05, which indicated small effect size and small practical significance.
Table 4. T-test results for Spatial Visualization Test scores in terms of gender
t-test for Equality of Means
95% Confidence Interval of the Diff.
t df Sig(2-tailed) Diff.Mean Std. Error Diff. Lower Upper
Equal variances
assumed -7.63 1005 .00 -3.55 .46 -4.46 -2.63
Equal variances
not assumed -7.72 366.76 .00 -3.55 .46 -4.45 -2.64
In order to investigate the difference in spatial anxiety scores of pre-service teachers in terms of undergraduate program and gender, first descriptive statistics were sum-marized (Tab. 5). The mean scores indicated that the spatial anxiety of the pre-service teachers were relatively low in the general sense. The spatial anxiety mean score for EME, ESE, and ECE students were found to be 2.07 (SD = .69), 1.94 (SD = .70) and 1.93 (SD = .66), respectively. The mean scores of the pre-service teachers of three un-dergraduate programs were found to be around 2 out of 5 and were close to each other. Table 5. Descriptives for Spatial Anxiety scores by undergraduate program and
gender
Female Male Total
M SD N M SD N M SD N
EME 2.11 .68 286 1.96 .73 114 2.07 .69 400
ESE 2.05 .70 331 1.60 .59 105 1.94 .70 436 ECE 1.96 .65 166 1.18 .14 5 1.93 .66 171 Total 2.05 .68 783 1.78 .69 224 1.99 .69 1007 The two-way ANOVA results (Tab. 6) revealed that this difference was statistically
significant with respect to undergraduate program, F(2, 1001) = 10.43, p < .01. More specifically, the post-hoc comparison using the Tukey HSD test indicated that the mean score for EME students was significantly higher than that of ESE and ECE students. The eta square was calculated as .02, corresponding to a small effect size. When gender variable was examined, it could be inferred that the spatial anxiety of males was less than that of females for all undergraduate programs. Inferential statistics revealed that this difference was statistically significant F(1, 1001) = 17.93, p < .01; that is, the spatial anxiety levels of males were significantly lower than that of females (Tab. 6). Namely, females felt more anxious in spatial tasks than males in all three undergraduate programs. The effect size for gender was reported as .02, Additionally, the interaction effect between undergraduate program and gender was not statistically significant,
F(2, 1001) = 5.23, p = .01, which means that regardless of the undergraduate program,
the spatial anxiety scores of females was significantly higher than that of males. Table 6. Two-way ANOVA results for Spatial Anxiety scores in terms of gender
and undergraduate program
Source Type III Sum of Squares df SquareMean F Sig. Partial Eta Squared
Corrected Model 24.51a 5 4.90 10.72 .00 .05 Intercept 509.96 1 509.96 1115.88 .00 .53 Gender 8.19 1 8.19 17.93 .00 .02 Undergrad. Prog. 9.53 2 4.76 10.43 .00 .02 Gender*Undergrad. Prog. 4.78 2 2.39 5.23 .01 .01 Error 457.46 1001 .46 Total 4466.56 1007 Corrected Total 481.97 1006
a. R Squared= .51 (Adjusted R Squared= .46)
To sum up, the findings revealed significant difference in spatial visualization abi-lity levels of pre-service teachers in terms of undergraduate program. Especially EME students got significantly higher scores. As for gender, females obtained significantly lower SVT scores than males. Moreover, spatial anxiety levels of pre-service teachers differed significantly in terms of undergraduate program but the scores of EME, ESE and ECE programs were very close to each other and the effect size was small. How-ever, females got significantly higher ANX scores than males for all undergraduate programs.
4. Discussion, Recommendation and Implications
The findings indicated that the spatial visualization abilities of pre-service teac-hers were at moderate level and differed according to the undergraduate program they were majoring in. That is, the spatial visualization ability of the pre-service teachers majoring in mathematics was found to be significantly higher than that of the ones majoring in science and early childhood education. In addition, the spatial
visualiza-tion ability of science educavisualiza-tion students was significantly higher than that of early childhood education students. The findings also revealed that spatial anxiety levels of elementary mathematics education students were significantly higher than those of elementary science education and early childhood education students. Although the difference was statistically significant, the effect size was found to be too small to assure practical significance.
These findings are in line with the claim of Shea, Lubinski and Benbow (2001) in that students preferring the fields related to engineering, computer science, and mathematics were the ones with a higher spatial visualization ability compared to their verbal ability. Thus, the higher scores gained by mathematics education students and science education students as compared to early childhood education students in the spatial visualization ability test might be attributed to the fact that math and science majors are more familiar with spatial concepts than early childhood education majors based on their educational background. That is, according to the national uni-versity entrance exam in Turkey, elementary mathematics education and elementary science education undergraduate programs accept students who took advanced level mathematics and science courses at high school. Namely, elementary mathematics education and elementary science education undergraduate programs in Turkey are mostly based on courses involving the use of concrete materials like manipulatives, computer programs, and laboratory applications. On the other hand, most of the stu-dents who prefer the early childhood education undergraduate program are graduates of vocational high schools in which mathematics and science courses are offered at basic levels. Thus, high school courses and students’ spatial experiences during higher education might influence the spatial visualization ability of math education and sci-ence education majors more positively than that of early childhood education majors. In the same way, the small difference between spatial anxiety level of mathematics majors and those of the other undergraduate programs may derive from the more ad-vanced spatial experiences of mathematics majors. Additionally, this difference may be because of the higher spatial visualization ability of mathematics majors.
In order to improve and assess the spatial visualization ability of their students, teachers should be highly qualified and experienced in this area. A moderate level of spatial visualization ability might affect the performance of teachers in spatial tasks in a negative way. Such teachers may not apply the tasks requiring spatial visua-lization ability efficiently or they may not detect the student mistakes accordingly. Thus, their students might have difficulties in courses such as mathematics, geometry, chemistry, and visual art. When the courses of elementary teacher education prog-rams were analyzed, it was detected that the course contents do not emphasize spatial visualization ability. Therefore, the importance of spatial visualization ability might be highlighted in the elementary teacher education programs through additional acti-vities carried out during the courses. Accordingly, teacher educators might consider the findings of this study in revising their undergraduate course contents regarding
visualization of 2D and 3D images. Indeed, the revisions might be made especially in early childhood teacher education program since they will educate the age group whose development and learning is quite fast. Sample activities to be integrated to the courses might be way-finding tasks, block building with concrete materials (Battista, Clements, Arnoff, Battista, & Borrow, 1998; Robichaux, 2000), programming and coding practices (Francis, Khan, & Davis, 2016), isometric drawing on the computer (Onyancha, Derov, & Kinsey, 2009) and isometric drawing the views of 3D objects on paper (Olkun, 2003; Sorby, 1999). As suggested in the literature, teachers might make students sketch hand-held models in order to improve their spatial skills at high school, especially in vocational high schools (Sorby, 1999). Such practices are asser-ted to develop the capacity of students for visual imagery and creativity (Sorby, 1999) and decrease their spatial anxiety. In case such arrangements are put into practice, the difference between the pre-service teachers of different areas (ECE, EME, and ESE) will decrease and all pre-service teachers might be graduated from university with similar spatial visualization ability levels. This might affect their own teaching in pro-fessional life and spatial visualization ability development of the future students will be considerably supported. That is, these pre-service teachers will not avoid doing tasks related to 3-D drawings and their students will have the chance of practicing and experiencing spatial tasks in the future.
Apart from undergraduate program pre-service teachers enrolled in, their gender also may play an important role in their spatial visualization ability and spatial an-xiety. The results indicated that males obtained significantly higher scores in spatial visualization test than females consistent with the findings of many studies in the lite-rature, emphasizing that spatial visualization abilities of females are lower than those of males (Battista, 1990; Nemeth, 2007). Parallel to the spatial visualization ability scores, spatial anxiety levels of females were found to be higher than those of males for all undergraduate programs. The finding that females had higher spatial anxiety scores than males corresponds to many research studies (Lawton, 1994; Ramirez et al., 2012).
As for gender difference, there are some possible reasons offered in the literature. One of the reasons is social spatial experiences (Baenninger & Newcombe, 1989). According to Baenninger and Newcombe (1989), females have fewer spatial expe-riences out of school than males do, so they score lower than males in spatial ability tests. Even in early childhood, females prefer to play with stuffed animals and dolls that improve social skills, while males prefer vehicles and blocks, which are benefi-cial for spatial manipulation (Etaugh & Liss, 1992). Parents’ allowing less freedom to their daughters to discover their environment during childhood was another reason asserted for females possessing a higher level of spatial anxiety (Lawton & Kallai, 2002) and lower level of spatial visualization ability (Etaugh & Liss, 1992). Thus, the reason underlying gender difference in the present study can be attributed to the spatial experiences of the participants. That is to say, male pre-service teachers in this
study might have had more spatial experiences (Coluccia & Louse, 2004) than fema-les. Another possible reason put forward for gender difference in spatial visualizati-on ability is cultural effects (Richardsvisualizati-on, 1994). According to research visualizati-on stereotype threat, if individuals belong to a negatively stereotyped group, their performance on tests of skills which are associated with the stereotype decreases (Campbell & Collaer, 2009; Osborne, 2001). Females are claimed to lose their self-confidence in spatial tasks owing to the presence of a stereotype regarding males’ thinking more logically in spatial situations (Campbell & Collaer, 2009). Therefore, the difference observed in this study may be due to the stereotypical favor granted to males regarding spatial performance and upbringing. Thus, pre-service teachers might be encouraged not to conduct gender differentiating tasks and not to use stereotype causing statements in their professional life. By this way, gender difference of future generations regarding spatial visualization ability might be diminished. In addition, pre-service teachers might be encouraged, upon becoming a teacher, to inform parents about giving more freedom to their daughters to discover their environment and about providing toys which are beneficial for spatial manipulation like they do to their sons. In this way, females may gain self confidence in spatial visualization ability requiring tasks and perform spatial tasks better in the future.
In the present study, the Spatial Visualization Test was used to measure the spatial visualization abilities of pre-service teachers, which includes only the spatial visuali-zation ability component of spatial ability. Thus, it can be recommended that a similar study be conducted by using a more comprehensive test containing other components of spatial ability, such as spatial orientation, spatial perception and mental rotation. Additionally, in this study, the difference in terms of undergraduate program and gen-der was detected but the factors causing these differences remain unanswered. Further qualitative studies investigating the factors causing the differences in terms of underg-raduate program and gender in pre-service teachers’ spatial visualization ability and spatial anxiety could be conducted.
5. References
Baenninger, M. & Newcombe, N. (1989). The role of experience in spatial test performance: A meta-analysis. Sex Roles, 20(5/6), 327-344.
Battista, M. T. (1990). Spatial visualization and gender differences in high school geometry. Journal for Research in Mathematics Education, 21(1), 47-60.
Battista, M. T. (1994). On Greeno’s environmental/model view of conceptual domains: A spa-tial/geometric perspective. Journal for Research in Mathematics Education, 25(1), 86-99. Battista, M. T., Clements, D. H., Arnoff, J., Battista, K. & Borrow, C. V. A. (1998). Students’ spatial structuring of 2D arrays of squares. Journal for Research in Mathematics Educa-tion, 29(5), 503-532.
Ben-Chaim, D., Lappan, G. & Houang, R. T. (1988). The effect of instruction on spatial visualization skills of middle school boys and girls. American Educational Research Journal, 25(1), 51-71.
Bishop, A. J. (1973). Use of structural apparatus and spatial ability: A possible relationship. Research in Education, 9, 43-49.
Boulter, D.R. (1992).The effects of instruction on spatial ability and geometry Performance (Unpublished master’s thesis). University of Queen’s, Ontario.
Campbell, S. M. & Collaer, M. L. (2009). Stereotype threat and gender differences in per-formance on a novel visuospatial task. Psychology of Women Quarterly, 33(4), 437-444. Cohen, J. (1988). Statistical Power Analysis for the Behavioral Sciences (2nd ed). Hillsdale,
New Jersey: Erlbaum.
Coluccia, E., & Louse, G. (2004). Gender differences in spatial orientation: A review. Journal of Environmental Psychology, 24, 329-340.
Etaugh, C. & Liss, M. B. (1992). Home, school, and playroom: Training grounds for adult gender roles. Sex Roles, 26, 129-147.
Fennema, E., & Sherman, J. (1977). Sex-related differences in mathematics achievement, spatial visualization and affective factors. American Educational Journal, 14(1), 51-71. Francis, K., Khan, S. & Davis, B. (2016). Enactivism, spatial reasoning and coding. Digital Experiences in Mathematics Education, 2(1), 1-20.
Guay, R. B. & McDaniel, E. D. (1977). The relationship between mathematics achievement and spatial abilities among elementary school children. Journal for Research in Mathe-matics Education, 8(3), 211-215.
Guzel, N. & Sener, E. (2009). High school students’ spatial ability and creativity in geometry. Procedia-Social and Behavioral Sciences, 1, 1763-1766.
Halpern, D. F., Beninger, A. S., & Straight, C. A. (2011). Sex differences in intelligence. In R. J.
Sternberg & S. B. Kaufman (Eds.), The Cambridge Handbook of Intelligence, (pp. 253-272). Cambridge University Press, USA.
Hawes, Z., Tepylo, D. & Moss, J. (2015). Developing spatial thinking. In B. Davis and the Spatial Reasoning Study Group, Spatial Reasoning in Early Years, Principles, Assertions and Speculations, (pp. 29-44). Routhledge, Taylor and Francis Group, NY and London. Hegarty, M. & Waller, D. (2004). A dissociation between mental rotation and
perspective-taking spatial abilities. Intelligence, 32(2), 175-191.
Hund, A. M. & Minarik, J. L. (2006). Getting from here to there: Spatial anxiety, way finding strategies, direction type, and way finding efficiency. Spatial Cognition and Computation, 6, 179-201.
Jakubowski, E. & Unal, H. (2004). Promoting and awakening mathematical creativity. Paper presented at the Florida Council of Teachers of Mathematics Annual Meeting, Miami. Kaufman, S. B. (2007). Sex differences in mental rotation and spatial visualization ability:
Can they be accounted for by differences in working memory capacity? Intelligence, 35, 211-223.
Lawton, C. A. (1994). Gender differences in way-finding strategies: relationship to spatial ability and spatial anxiety. Sex Roles, 30(11/12), 765-779.
Lawton, C. A. & Kallai, J. (2002). Gender differences in wayfinding strategies and anxiety about wayfinding: A cross-cultural comparison. Sex Roles, 47, 389-401.
Levine, S.C., Ratliff, K. R.,Huttenlocher, J.,& Cannon, J. (2012). Early puzzle play: A predic-tor of preschoolers’ spatial transformation skill. Developmental Psychology, 48, 530-542. Linn, M. C., & Petersen, A. C. (1985). Emergence and characterization of sex differences in
spatial ability: A meta-analysis. Child Development, 56, 1479-1498.
Lohman, D. F. (1993, July). Spatial Ability and G. Paper presented at the First Spearman Seminar, Iowa City, Iowa.
Lohman, D. F., & Kyllonen, P. C. (1983). Individual differences in solution strat-egy on spa-tial tasks. In R. F. Dillon & R. R. Schmeck (Eds.), Individual Differences in Cognition, (Vol. 1, pp. 105-135). New York: Academic Press.
Lytton, H. & Romney, D. M. (1991). Parents’ differential socialization of boys and girls: A meta-analysis. Psychological Bulletin, 109, 267-296.
Manger, T. & Eikeland, O. (1998). The effects of spatial visualization and students’ sex on mathematical achievement. British Journal of Psychology, 89, 17-25.
McGee, M. G. (1979). Human spatial abilities: Psychometric studies and environmental, ge-netic, hormonal, and neurological influences. Psychological Bulletin, 86(5), 889-918. Middle Grades Mathematics Project [MGMP] (1983). Spatial Visualization Test. Department
of Mathematics, Michigan State University.
Mitchelmore, M. C. (1976). Space and geometry. In J. L. Martin (Ed.), Cross cultural research on concepts of space and geometry (pp. 143-184). Columbus, OH: Ohio State University. Mohler, J. L. (2008). A review of spatial ability research. Engineering Design Graphics
Jo-urnal, 72(3), 19-30.
Mulligan, J. (2015). Looking within and beyond the geometry curriculum: connecting spatial reasoning to mathematics learning. ZDM Mathematics Education, 47, 511-517.
National Council of Teachers of Mathematics [NCTM] (1989). Curriculum and evaluation standards for school mathematics. Reston, VA: National Council of Teachers of Mathe-matics.
Nemeth, B. (2007). Measurement of the development of spatial ability by mental cutting test. Annales Mathematicae et Informaticae, 34, 123-128.
O’Laughlin, E. M. & Brubaker, B. S. (1998). Use of landmarks in cognitive mapping: Gen-der differences in self report versus performance. Personality and Individual Differences, 24(5), 595-601.
Olkun, S. (2003). Making connections: Improving spatial abilities with engineering drawing activities. International Journal of Mathematics Teaching and Learning, April, 1-10. Onyancha, R. M., Derov, M. & Kinsey, B. L. (2009). Improvements in spatial ability as a
result of targeted training and computer-aided design software use: Analyses of object geometries and rotation types. Journal of Engineering Education, 98(2), 157-167. Osborne, J. (2001). Testing stereotype threat: Does anxiety explain race and sex differences in
achievement? Contemporary Educational Psychology, 26, 291-310.
Ramirez, G., Gunderson, E. A., Levine, S. C. & Beilock, S. L. (2012). Spatial anxiety relates to spatial abilities as a function of working memory in children. The Quarterly Journal of Experimental Psychology, 65(3), 474-487.
Richardson, J. T. E. (1994). Gender differences in mental rotation. Perceptual and Motor Skills, 78, 435-448.
Robichaux, R. L. R. (2000). The spatial visualization of undergraduates majoring in particu-lar fields of study and the relationship of this ability to individual background characte-ristics (Unpublished doctoral dissertation). University of Auburn, Alabama.
Roorda, J. (1994). Visual perception, spatial visualization and engineering drawing. Enginee-ring Design Graphics Journal, 58, 12-21.
Schmitz, S. (1997). Gender-related strategies in environmental development: Effects of anxi-ety on wayfinding in and representation of a three-dimensional maze. Journal of Environ-mental Psychology, 17, 215-228.
Shea, D. L., Lubinski, D. & Benbow, C. P. (2001). Importance of assessing spatial ability in intellectually talented young adolescents: A 20-year longitudinal study. Journal of Educa-tional Psychology, 93(3), 604-614.
Sorby, S. A. (1999). Developing 3-D spatial visualization skills. Engineering Design Grap-hics Journal, 63(2), 21-32.
Sorby, S. A., Leopold, C., & Gorska, R. (1999). Cross-cultural comparisons of gender diffe-rences in the spatial skills of engineering students. Journal of Women and Minorities in Science and Engineering, 5, 279-291.
Sundberg, S. E. (1994). Effect of spatial training on spatial ability and mathematical achie-vement as compared to traditional geometry instruction (Unpublished doctoral dissertati-on). University of Missouri, Kansas City.
Tracy, D. M. (1987). Toys, spatial ability, and science and mathematics achievement: Are they related? Sex Roles, 17, 115-138.
Whiteley, W., Sinclair, N. & Davis, B. (2015). What is spatial reasoning. In B. Davis and the Spatial Reasoning Study Group, Spatial Reasoning in Early Years, Principles, Assertions and speculations, (pp. 3-14). Routhledge, Taylor and Francis Group, NY and London.