««s ·«· ] ;
Ш
û
c
:
а
к
φ
ν.'·^
< 1 , g « . J.>«·?
'У
'
с : : з Ф Ш ' ^с
^
ύ
:
9
0
т
»■¥* »ЛЭГ*Н
О
Ъ . C jС
}
9
:
■V
·
Ф
<
■
ω
■
S-. І’Л Щ ¿ л й } Ш Û İ ^ й Ло
^
■
;
о
>
К
<
5
• U ) -^ j « ,·■ .-5 t · ^THE RELATIONSHIP
EiETSVIiEN m arket d e t e r m in e d risk m e a s u r e s AEJDFINANCIAL VARIABLES
A TH E S IS E:'..n'.:i'-irrT£D T O T H E D E P A R T M E N T O F M A N A G E M E N T ANC) TH E T-jECAD'.JATE S r:H O O L O F B U S IN E S ;;; A D M iN l'TI R A T IO NO E P:i! .K EN T ',.iNIVER:-::iT V
iN l-’A iVnAl. EV.)l.n!,.I..MENT !')P R E O N IR E H E N i E· r c R TH E iTETii^EE !TP
M/\E. TER O F EU.IEUNESS ADr^JIMl:.'·.: TP lA TlO N
f-;Y
■RKAN EIYSAI
;( [;· r jr A]j ;| j:;· lE^EiiQ
Ц 5 Я З , S
•
υ
I Cf":?rtify that I have read this thesis and in my opinion it is f eilly adequate. in scope and in quality^ as a thesis for the
I. certify that I iiave read this thesis and in my opinion it is tally adequate^ i ii scope and in quality^ as a thesis for the d e 9r e e ·j f Ma s t e r (j t B us i ne s s Ad im. i )j. s 11' a t i c>n,
jzid e 111i r A k iviu t
I certify that. .1 liav»2‘ r»-j a d t li i s t he sis a nd in my opini'jn it i ■ ul J. y a ^:le cj ua t e ♦ i n s c o }J e a 1 ul i 11 q ua 1 i t. y , a s a thesis for t lie ree of Master of Bvi?;:i I'less A(J)ui ni s t r a t i o n .
•V, /
■V/'
A ppr r.)vr*ii 1» y \ 1)0 Gy ad ua i e SV:. l^oc» 1 C' f Bi.is i l ies s Ad nii. n i s t r a t i. on
LJ i
ABSTRACT
E R K A N UYSAL
THE RELATIONSHIP·
B ETWEEN M A R K E T DETERMINED RISK M E A S U R E S ANIj F IN A N C IA I V A R IA B L E S M B A IN M A N A G E M E N T SU P'-ER VISO R ; A S S O C . P R O F . U M IT E R O L S E P T E M B E R 1 9 9 0 . Î58 P A G E S ■ r- -:r·. ^ ÇZ·. :
rr;easures ct risk to a numbsr
:=m -financial statements, MA-rksi
icic r;:. sk, ¡3^ and the total risk,
tacnninL«es. As i
cmE? of the financial var labiSE
?·;'-■ rr f - r -· r "h h mnf'ket measLires ct
ÖZET
P A Z A R T A R A F I N D A N B E L İ R L E N E N R İ S K Ö L Ç Ü T L E R İ İ L E M A L İ O R A N L A R A R A S I N D A K İ İ L İ Ş K İ E R K A N U Y S A L Y Ü K S E K L İ S A N S T E Z İ İ Ş L E T M E E N S T İ T Ü S Ü T E Z YC'NETİCİSİ DOÇ. DRK Ü M İ T E R O L E Y L Ü L 1 990, 5 S s a y f a B u t e z ';:al 1 ş m a s ı n ı n a m a c ı İ s t a n b u l M e n k u l K ı y m e t l e r B o r s a s ı n ı n b i r i n c i p a z a r ı n d a i ş l e m g ö r e n h i s s e s e n e t l e r i n e ai t p a z a r t a r a f ı n d a n b e l i r l e n e n r i s k ö l ç ü t l e r i n i . b u ş i r k e t l e r e a i t m a l i oranlarl-a i l g i s i n i o r t a y a koynıaktır. P a z a r t a r a f ı ndarıb e l i r l e n e n r i s k ö l ç ü t l e r i s i s t e m a t i k r i s k , /?, v e t o p l a m risk, a
o l a r a k s ı n ı f 1 a n d ı r 1 1 m ı ş t ı r . B u r i s k ö l ç ü t l e r i , f i n a n s a l k a l d ı r a ç , f i r m a n ı n b ü y ü k 1 ü ğ ü , l i k i d i t e or anı , k âi' i 1 11 k: or anı , y a t ı r ı mİ ar ı n
k â r l ı l ı ğ ı v e t e m e t t ü g e t i r i s i g i b i m ali o r a n l a r ü z e r i n e r e g r e s e d i 1 mi şt i r . S o n u ç ol ar a k , b u r i sk ö l ç ü t l e r i ni n b a z ı mal i or ani ar d a n e t k i 1 e n d i ği g ö z i e n m e k i e b i r l i k t e , b u d e ğ i ş k e n i er i n ani anıl 1 11 ğı gC'S t er mi ş ti r . d a n y ı l a v e ö r n e k t e n ö r n e ğ e d e ğ i ş i k l i k l e r
MNl T -iTAr·· f-'.EL I M E L E K x M a l i o r a n l a r , s i s t e m a t i k r i s k , t o p l a m risk.
ACKNOWLEDGEMENTS
I have rE^oB ivEid much help and contribution from many individuale in preparing this thesis. Î would like to thank to my thesis supervisor Assistant Prof- E^r. Umit Erol tor his guidance stnd patience through out this study. I am also grateful to Prof. Dr. Halil Sstriaslan for his valuable comments on the structure of the text.
I also would like to thank to my other thesis commitee members Prof. Dr. Özdemir Akmut and Assistant Prof. Dr. Kürşat Aydoğan for their comments and suggestions which contributed a lot to the final product.
I also would like to thank all people who helped me in acquiring the necessary data about the stockK ■ and financial
TABLE OF CONTENTS
A B S 1 R A C T i OZET i i A C K N O W L E D G E M E N T S i ii TABLE OF C O N T E N T S i V LIST OF TABLES vi1
INTRODUCTION
1
1.1 Significance of the study 1
1.2. Purpose of the study 2
2
LITERATURE REVIEW
4-2.1 Literature on market deternuned risk 4
2,2 Literature on accounting determined risk 10
3
BASIC CONCEPTS AND DEFINITIONS
16
3. 1 Ret urn 16
3. 2 Risk 17
3. 3 Risk reduction through diversification 1Ö
3,3.1 Systen\atic risk 20
3. 3-2 Unsystematic risk 20
4 THE THEORETICAL RELATIONSHIP BETWEEN SYSTEMATIC RISK
22
AND FINANCIAL VARIABLES
22
4.1 Financial ratio analysis 22
4. £.'2 Til6?ore t i c a 1 r e 1 a t i o ns !‘ii. ps 23 4. 2. 1 Leverage 23 4. 2. 2 Ac count i ng he t a 25 4. 2. 3 Size 26 4. 2. 4 Di vidends 27 4. 2. 5 Liquidity 28
5 METHODOLOGY
29
5.1 Selection of particular stocks 5.2 Adjustment of data
5.2.1 Capital increases
5.3 Calculation of risk measures 5.4 Model specification 5.5 Multivariate regression 2S 30 30 31 38 43
6
FINDINGS
46
7
CONCLUSION
53
REFERENCES
55
APPENDICES
59
VL IS T OF TABLES
Table Table Table Table Table Tabl e Tab le Table Table Table Table Table Table Table Table Table Table Table Table Table Table Table Table Table Tabl e Table Table 5. 1 5. 2. a 5. 2. b 5. 2. c 5. 2. d 5, 3 5. 4. a 5. 4. b 5. 4. c 6. 1 6.
2 6. 3 b. 4 A. 1 . a A. 1 . b A. · 1 > (_ A. 1 . d A- 2. a A. 2. b A. 2. c A. 3. a A. 3. a A · 3 · a A. 4. a A. 4. b A. 5, a A. 5. bList of stocks included in the study List of stocks included in the year 1986 List of stocks included in the year 1987 List of stocks included in the year 1988 List of stocks included in the year 1989 Su))\)i\ar y of t he si gni f i c a nc e of /?s
S'umjiiary of financial ratios for the year 1987 Sununary of financial ratios for the year 1988 Sun-unary of financial ratios for the year 1989 Sumn3iry of regression results C12 obs. ft dep. D Sunnnary of regression results (.12 obs. o* dep. 3 SunniLary of regression results (.'31 obs. ft dep. 3 SuiTunary of regression results C31 obs. cy dep. 3 Weekly return series for the year 1986
Weekly return series for the year 1987 Weekly return series for the year 1988 Weekly return series for the year 1989
Sunnnary of financial statement iten\s in 1987 Sunnnary of f inancia 1 st atement i terns in 1 988 Sunnnary of financial statement items in 1989 Input data for the year 1987 Cl 2 observations3 Input data for the year 1988 Cl 2 observations3 Input data for the year 1988 C12 observations3 Input data for the year 1988 C31 observations3 Input data for the year 1989 C31 observations! Correlation matrices for 12 observation
(correlation matrices for 31 observations
29 32 33 34 35 37 40 41 42 46 48 49 50 61 64 6 8 72 78 79 80 82 84 85 87 8 8
L IS T OF FIGURES
F i gui’ e
2. 1 - Comp orient s of risk in poi t f ol i o
19Everyday more· and more people are involved in -financial markets due to the increasing volume o-f trade and transac t ions. Many people invest irr stock markets in the hope o-f gaining a -fu cure income that is expected to have a present value higher than the amount invested today.
Investorsv' main interest is the return they will receive -for the level o-f risk taken. Stocks carry two types o-f risk : unsystematic risk and systematic risk- The former is related to the faictors that are unique to each firm while the latter is related to the factors that influence the market as a whole.
Professional investors can easily eliminate the unsystematic risk through diversification . Therefore, investors' main concern is the systefTiatic risk- Its measure is known as which shows the volatility of individual stock in relation to the overall market portfolio.
Systematic risk is the main concern, since it is the basis for investment decisions. In an efficient market, investors determine their expected return with respect to the level of systematic risk- Sources of the systematic risk warrants investigation - The identification of these sources will improve the information content. For this reason, many financial analysts have related many financial variables, derived from financial statements, to the systematic risk, The knowledge of the factor-s affecting the systematic risk provides investors and financial analysts vMith a better foresight about the firm's stock.
In theory^ the existence o-F the relationship between systematic risk and -financial variables has been proved with some mathematical manipulât ions as explained in detail in Section 3.
1.1 Significance of the study :
Most Dt the studies aimed at deter/nining the -factors arfecting the systematic risk has been done in the developed capital markets. Finding out these determinants o-f risk is use-full in investors' and managemen t ' perspective to the extent that some D-f these variables can be under the management's control.
There is not much work done in developing markets to determine these -factors. Sc, this sttidy has aimed at pointing out the -factors af-fecting the systematic risk in common stocks traded
CP. Istanbul Stock Exchange -first market. It is hoped that study helps other researchers develop new models -for this purpose.
1.2 Purpose of the study :
As mentioned above, investors and -financial analysts pay a great deal oi attention to the determinants o-f systematic risk. A considerable amount o-f empirical research aiming at determining these variables has been done- However, most o-f the studies were conducted -for the stock markets o-f developed countries.
The purpose o-f this study is, thus, to identi-fy financial variables which affect the systematic risk and total risk of the stocks traded on the Istanbul Stock Exchange. For the fullfilment of this purpose, both univariate and multivariate statistical techniques are applied through computer programs such as LOTUS 1-2-3 and
SHA2AM-The study proceeds with a brie-^ review o-f literature on both market determined risk and accounting determined risk- Then the conzeptuai definitions and concepts are given. In the ne>it section thee r-0 t i c a i re 1 a t i onsh 1 ps between financial variables and
s y s ema I i c r i sl·. ai-'s i n t roduc ed . The methodol ogy followed is e 1 :'ved l:e-^or-e the =: ^'es an t a t i cr of findings, and concluding r'-e·’·:· "■ ■■ к s are у · r&r; in the last section.
2.1 Literature on market d e t e r m n e d risk :
Sharpe and others ESharpe(1964>, L i n t n e r (1965), and Mossir ■'1966) j have ejitended the earlier work ot Markowitz ( 1952) to
a sioplitied p/ort-folio model ithe diagonal model) and to a capital asset pricing model, v^iihich determines· the equilibrium prices for all ss'curi t ias.. Markowitz defined the riskiness of a portfolio of •assets in terms of the variance of the portfolio's return,
2 _
io' (K )]- U n d0r certain conditions the variance is an appropriate p
.Tieasure of risk. These conditions are that the return distributions of individual securities are stable with a finite variance (i.e. a normal distribu.t ion) and that the first dérivâtive of the utility function is positive and the second derivative is negative, implying that it is a risk-averse utility function for wealth. The use of the variance is not as restrictive as it night at first appear. Empirical evidence CFama(1965)l has shown that re turr* distr ibu t ione are adequately character i zed as symmetr'ic: a:nd that at the portfolio level the vctriance is highly c o r re i a t ed w i t h o th e r p op u 1 a r d i sp e r s ion m e a su re s .
The variance of a portfolio's return is the sum of tv*^o ter-ms. For convenience and v-r'ithout loss of generality, assume ti-iat a-î equal amount is invented in each security. It can be s hi Cf w r i V·5 f ri. 1/ ^ ii. L I T E R A T U R E R E V I E W -o ■ ( R ) == P N-1 N N
= average variance + average covariance
For a d i versi-f ied port-folio, a secority'^ contribution to the risk of the portfolio is measured by its average covariance with all other securities in the portfolio, r?ot with its variance.
A security's return may have a high variance, but, if it has lov^^· covariance with ether secur i t ies, it is not really a risky security to hold, because its ajdoition to the portfolio will tend to reduce the variance of the portfolio's return.
Gne limitation of the Markowitz model is the enormous number of parameter astimation required in order to assess the variance of return for a portfolio. In order to reduce the number of parameters to esti.mate, Sharpe has offered a diagonal model, which specifies the following relationship :
R - a -i- ft R -Î- £ it i I m t i / S· Ck \ X- r / wher E (e > ( K T ¿7 . ) f’r11 ’ 1. O' { S. , ¿T ) !-■ ]
Th(e model asserts that a security's return can be decomposed into two elements, a systematic cornpenent </?R > which reflects
Vfit
common movement of a single security's return with the average return ot all other securities ir? the market, and an individu£-il ist ic component (a -c v^’hich reflects that residual
L i
portion or a s e c urity's return that moves independently of the ma r k e t- w i d e re t u r n .
Within the context of the diagonal model, the variance of portfolio return ie defined as ;
) = Г— 1-- ] ) P I N J 1. Vfit where a \ — mean i of the comp/onen fc s , =mean of /?. ' s
/jT- (R ) ” Var iaПce of the m a кe t return , R
Tilt rriL
variances of the individualistic
For N=1 (for an individual security),
CT* ( F·! / — O ' { £ : ) + ' ^ O ' { f i ) ( 2 ■ 4 )
i- i i Yn
As can easily be seen, analogous to the Markowitz model, the variance is composed of two elements- As N increases, the first term go^'- to zero and the portfolio variance becomes egual to the second term, (/?) ^o'^(R ), o'^ (R ) will differ атюпд portfolios
m p
solely according to the magnitude of ,в, the average of the /3^s of the sec uu'ities comprising the portfolio- Hence, an individual security's contribution to the riskiness of the portfolio is
2 ,
(Tie a s Li Y~ e g by it·:::· /-. ч г? c t ot £} ■ L ■
As the above equation shows, the variance of a security's return can differ from that of other securities because of one of
2
two facto«-'s, either ry ) or fi , The first factor is referred to i, \.
as the individuaiistic or avoidable risk of a security, because th-at risk can be driven to zero through d i vers i f i ca t ion. The risk-aversrs investor will select a portfolio where the individual riskiness is essentially zero- Such a portfolio is known as an efficient portfolio. The ft, is the systematic or unavoidable risk
o-f the security and measures the security's sensitivity to market wide events. It is called the systematic or unavoidable risk because it is that portion o-f the variance o-f the security's return that can not be diver-si-fied away by increasing the number D-f securities in the port-folio,
Moreover, ,6‘ bears a direct relationship to the concept of covariance. In particular, it car? be -shown that, if security r e t u n s a r'-e n о r m ally d i s t r i b Li ted, then ;
n.
R >
2a {R ;·
rn (2. 5) v*;here ; -O' (R.. К ) i ■ Yri(R )
}Yi c o v a r i a n c e of s e c L i r i t y i ' s r e t c i r n s with t h e market retLirns v a r i a n c e c f t h e market return.The statement that the secLirity's riskiness is measLired in terms of its covariance is entirely' compatible with Lising /? a-s a measure of secur i ty r 1 sl·: i nes-s.
The oripinal motivation for the diagonal model was to reduce ^pj0 number of paramfeters to estimate. The V'ariance of a portfolio, Lisinp the di agonal moos-i, repLiires an es-timation of 2N-^1 parameters, which -f-or N=1000 is 2001 (as compared with 500500 for the Ma r k ow i t z mod el) .
Another ajdvantc-:He of the diagonal model is that iz can be e-i tended to more gerioral cases where security' retLirn distr ibLit ions are characterized by the stable family of distributions, of which the normal distribLition is a special case. ihis is an important
property because there is considerable evidence CFama(1965), M a n d e l b r o t (1963)3 that the distributions of security returns most closely conform to-those members of the stable family, which have finite eiipected values but infinite variances and covar iances. Fama has shown that the ft can still be interpreted as a measure of
risk even ir? cases where the covariance and variance are »r~:H -Jet inec.f
S h a r p e (1964) and others LLintner(1965), M o s s i n (1966)3 have extended the earlier work on portfolio models to capital asset pricing models, which determine the eguilibrium prices for all securities in the market. Essentially the models start from the assumption that investors are generally risk-averse and show that, in e g u i 1ibrium, capital assets will be priced such that ;
E(R ) = R il-ft.) + ft.E<R ) i f L 1. rri where :
E(R ) = expected return of asset i.
R = rate of return on a riskless a s s e t -í·
E(R ) - expected return on market portfolio
(
2.
6)
(R , R ) i ■ rri CУ^^ (R ) ri’i (2.7)The capital asset model states that the only variable v*ihich determines, d i t-f erent i a 1 expected returns among securities is the systematic risk coe-f-F ic i en t, ,в.. The model further asserts that there is a linear relationship between ft, and e>; pec ted return such that the greater the risk the higher the expected return.
The v/ariabi 1 ity of the individualistic component of return does not enter into the pricing of capital assets, since that component can be eliminated through diversification.
Empirical assesments of c<. and ft, can be obtained from a
L Ъ
tifTie series, least squares regression of the foliowinp form :
R = a
it t rfit o.It 1, T.
The assesment cf f3^ from a time series regression assumes that was stationary during that period. Evidence by J e n s e n (1969) suggests that stationarity does exist, especially at the portfolio level. The empirical evidence CFama(1965)3 also indicates that the resulting equation conforms well to other assumptions of the linear regression model with one exception. The distribution of the estimated results are leptocurtic (i.e. has fatter tails than would be expected under normality). This dEparturE; from normality is consistent with Fama/s findings that security returns are members of the stable family of distributions with finite means but infinite variances- However, empirical studies have revealed that for stable distributions with finite expected values, least square estimates of (3 are unbiased and consistent, although not efficierit.
In sum, portfolio theory provides a measui-'e of security risl:;iness that has both a priori and empirical support. But, the knowledge of risk determination is incomplete in one important respect, as long as it is not known what exogeneous data (i.e. non-price data) are impounded in the assesment of prices and price changes such as to give rise to a given value of p.
2.2 Literature on accounting determined risk :
Considerable empirical research has been directed to the relationship between financial variables and market based measures of risk- These researches have shown that some financial variables are highly correlated with a market based measure of risk, namely,
, and are u.sef u 1 in ttfe pr‘·ed i c. 11on of f uture r isk
-Ei·*·oWTÎ nd Bail (1 967) st. wed that m a rket index mode 1 of various income and income return measures had explanatory power comparable to market index model of stock returns. They reported that the market index explains 30-45 X of the various income measures- T h e y (1969) also showed that earnings-price /3 has a significant positive correlation with the usual stock beta.
în their pioneering study of the association between ft and possible underlying risi:; factors, Beaver, Kettler, and Scholss ( 197’0) discovered signi f lean t posi t i ve correlat ions between ft^ and financial leverage^ earnings yield instability and negative correlation between ft and dividend payout measures in NYSE- They also pointed out that using accounting—derived risk measures as instrumental variables produces better predictions of second period ,97s than naive forecasts (i.e. first-period ft/s> .
Four subseguent studies have concentrated on the relationship betw een ft and a sir?gie risk f act or, H a m a d a (1972), and Boness, Chen 7 and J a tusip ;i t a k (1974) ShOV^S'□ finane i a i strue ture has cin i mpo rt ~j1~- T- influenc e on b V C C.' 1 s►ag^'^eed civer whether /7 varies d i re ct - J with tn e le^/e 1 of f inancial leverage. L.ev(l?74) i n t od uced an oper at ing 1 eve rage vari a b le wh i ch p roved to have modest e;:p lanatory power- '
reported" by Ball and Brown and by Beaver, Kettler, and Scholes could tie due to the stock price being common to the denominator o-f both market return and earnings-price ratio. He measured accounting ps -For net income and net income per dollar of assets. Neither D-r these /? measures had significant correl at ion between each of these fys and the market /3- He found /? was significantly related to the covar i ab 1 1 1 ty between annua. 1 first differences in a.
i_fs e 1 и ttie whole economy and an f i riT: ■ s net income ano
app rapri a t e i ndus t ry.
Other reseai-'chers have sought to forge multivariate links betvveen ft and several corporate risk factors- Logue and Nervi 1 le (1972) regressed the f?s of 2B7 industrial common stocks on nine f inanciai variado ies. Unly return on assets, asset size, and
2
financial leverage variables appeared significant, and R s egual to ..25.
announced,
a П d Le r П e r ■:i97-J>) d ivideo 14 C‘C> to t h e month 1 г1 wh ich f i sc^ They th en regr es sed the fta in e iC ial va r i -ab1 es - They found that
7 nd i f th ey W£rre, th ey : eve Г' t.i me.
Rosenberg and M c K i b b e n (1973) examined 32 variables derived from both accounting and stock martlet oata=,. They found that 1-3 variables we^··e significant but that the directions of their
•e ] a t i onsh i p s w i t h ·. 1 =· e - m ;he siqns of the: regression
coefficients) were generally unexpected. The variables had a 2 percent more explanatory power than the naive assumption that /i.-l for all stocks- They included an accounting eguity ft but, in contrast to Beavei— Nanegold results, found iit to have no
significant explanatory value- Lev and K u n i t z k y (1974) found /? to be significantly associated with dividend payout and indicators of smoothing in a firm's capital expenditures, dividends, sales, and earnings. The reqrBSsiorf coefficients had the expected signs, and R^=
-47-Mel icher (1974) found signi f leant mu.l t ivariate 1 inks between /"fe for electric utility stocks during 1967-71 and dividend payout,
:Lir П on c ommcw .· eg u. 11 у , mar к s act ivi ty , plant tc total capitalization, size, a financial ievet-'age r-atio, and the ratio
2
sgua.red. The pattern of signs wsis generally as expected, and R s range t-rom to -41. Replication of the tests on the 1963-67 period, however, produced very poor results.
In a fcl low-up study, Melicher and R u s h (1974) sought to relate changes in from 1962-66 to 1967-71 to li financial variables. The r-BErUlt^ were d i scourag ing - Only financial leverage, earnings growth, and plant to total capitalization proved
_ 2
significant, and h' s ranged from .22 to -26.
Beaver and M a n e g o l d (1975) criticized the study of Gonedes because of s\pparently large measurement errors. They used
i correlation tests to evaluate three alternative measures'^ : n a m e l y ,
- an income based on net income per dollar of assets, - an eguity based on return on common equity,
- an earn ings-pr ice /;< based on earn i ngs-pr i ce ratio.
Incorrita· b w t a i s Lhs· c o V 'a r \.o.nc* f Li rrVs t h i o u q n y * s a r s a n d t h a t o f o v -& r a L l rriark&t d i v i d e d b y th*=* v a r t -a n c -s of tli-s \.ncorn^ i n o v e r a l l m a r k e t .
СУ(Х.,Х ) Incorfiw b*ta =
( X ) Vri
They computed ft usins the usual covariance formulas and considered several refinements including the use of three alternative autocorre1ation corrections and Bayesian smoothing.
They found that the correlation with market ft was the highest for the earn ings-pr ice ratio, next highest for the eguity ft, and the lowest for the income ft. They also found that almost all of the correlations were statisticaily significant and none of the autocorreiat 1 on corrections signiticantiy improved measured
correlations and first diffsrsnces actually seemed
counterproductive. On the other hand, Bayesian smoothing (which amounts to a company specific correction for regression toward the me ar·; ' H { i ! i iTip r ove c o rre 1 a t i o n s ,
Tt-;OiT{psor; (1976) reported eigni-f leant CDr.^^e 1 at ions between n.arket ,6‘ and accounting ,6s based on earnings per share and operating income per share. Thompson's ,6s for earnings per share and operating ir?come per share ’were actually based on systematic variatior? in the grov'^th rates rather than the time series per se. Thus, Thompson's earnings ,6 wa.s not the same as the earnings ,6 cf Brown and Ball, of Rosenberg and ricKibben, and of Beaver and M anege!d.
In contrast to the correiation results, Thompson's m L? 11 i \·^a i a t e r e g r e s s i on s sh o’wed n o v a 1 u s for the ea rn i n g f:' , similar to the results obtained by Beaver, Kettler and Scihcles for the earn ings-price ,*6. (i,e. significant correlations but i ns i gn i f :i canoe in regressions with cither variables)
B o w m a n (1980) noted that a disparity exists between the theoretical and empirical results; that is, “ the theory is based on m^u^ket value measures of debt and leverage. With few
exceptions, the empirical tests use book value" (accounting) measures He examined whether the use of market measures
improved the empirical association between systematic risk and financial leverage (debt/eguity). He found that, contrary to expectations, debt/eguity ratio computed using book value measures of debt performed as well as the same ratio computed using market value measures of debtr
In a very recent studys Eroi, Cengiz and El-Bdour, Radi (1990) exaimined the relationship between corporate risk factors and systematic risk, and o', total risk in Amman Stock Exchange. The variables they used were total liabilities over total assets, total liabilities over total eguity, business risk (i.e. standard deviation of earnings before taxes over the mean value of earnings before taxes), size, total asset turnover , and dividend yield- Their analysis did not yield statistically strong significant results. However, when the analysis was repeated for the subsamples of financial and non-financial corporations, some of the variables were identified as determinants of corporate risk measures. For the financial corpcrations, size and business risk tended to increase the riskiness of the stock, while total asset turnover tended to lo'wer the riskiness of the stock. The size and total liabilities over total equity tended to lower the riskiness of non-finaneial corporations while the financial leverage tended to increase the riskiness of the stocks.
Although it is far from clear that which risk factors are important, or how they should be defined, the above studies indicate that the systematic risk of a stock is related to risk factors in the underlying corporation.
One reason -For this disappointing results is that the estimates of the explan^itory variables in these studies inevitably contain measurement errors. These errors stem from» many sources, including the use of different accounting methods by firms to measure the same phenomenon <e.g. the use of LIFO versus FIFO to evaluate inventories), the use of ex—post sample data, instead of er.-ante expec ta t i ons as specified in the capital vasset pricing model, and the estimation of variables from small Eiecauss of measurement errors, st raightf or’ward use of
•=rcr:.mp .
are biasec
3. BASIC CONCEPTS AND DEFINITIONS : 3. 1 Return ;
When people buy common stocks, they give up current consumption in the hope o-f attaining increased future consumption. They expect to collect dividends and eventually sell the stock at s. profit, naturn on stock is usually defined as the holding period I'eturn and :t is calculated as follows :
R
P
L- P
1 - 1D.
t - 1 L - X
(3. 1)
P = one period return
” ending period price of the stock P = beqinning period price at the stock
t - i
= dividends paid during the period
The -First part in the above formula shows the gain resulting ■From the changs in the market price of the stock and the second part shows the part of return resLil t i ng from the dividends paid during the period. I-F the company inc.»-'eases its capital within the periods the -Formula to compute the return -for the period is as
■follows ~
R
n . P t n . P “ P t [) “ n .1000
o a o a r» 3 I'l s o o f
(3.2)
H o r n a , J a m a s C . , Fi.n anc i.a L M a n a g e r r i w n t a n d P o l i c y , _^Pr € * n t i c d - H a l l I n t e r n a t i o n a l E d i t i o n s , S i s v d n t h E d i t i o n , p p . 2 5 . ^ T s k b a a , M . S i u k r u , HxOiTikrt. Ek'rinor/iiwV·. M o n ’.imJ.aK:
O c a k 1P87 , p p . 48
Where ;
R = return on the investment
n = number ot old stocks at the end o-f the period n — πumbe^" of new stocks at the end of the period
n number of stocks bought through rights offering
p
=
P r"· ice c f the o l d stocjr! a tо
=
price of the old stocl- atP
Гг5=
pr^ice of the new stocf-: atD
=
dividend paid during the 1For the ca l c L i l a t i o n of ho 1
portfolio, the following formula is used :
R
= CI .
-I , . ) / I .
i-3.3)rnt >nt i i i L - 1 i n t
Where 5
rate of return on the mar•"ket portfolio at time t ’/a 1 ue of the mar-k.et inde>i at time t
Va 1 Lie of the market index at time t-i
3.2 Risk :
Risk can be defined as the dispersion around the mean. The two measures of the degree of dispersion a.re the' variance and the standard deviation. But it is important to note that variability is not necessarily an indication of risk. The variability deals w i th the record
+: h j1n r t: .-t i n t v
ver"· past period; the aboi..it fu tu r e . Profes s i on
" rj.OWrfS i ds risk.11 __ 1i >L-i ‘ i‘upside potential'* on the grounds t h СЧ t risk
has to do W i t h bad ou tcones, potent ial wi tl'i я о оd ones.
A ba:sic d iff e r' en c0 i s genera i 1у recogr xizBd between the te^■^ms
risk and u гfc e r"t a i n t y . bn c e r-1 a i П t у i mp lies that the pro bab i 1it i es
of various outcomes are unknown. Risk implies that one can assign probability estimates to the possible outcomes. Risk can be
analyzed- probabilistically; uncertainty can not. Although di-f-ferent measures of risk are often virtually interchangab le, the standard deviation is generally preferred for investment analysis. The reason is that the standard deviation of a portfolio's return can be determined from (among other things) the standard deviations of the returns of its comiponent securities, no matter w-hat the d i str i o u 11ons a'.re. The standard dev'iation is an estimate of the likely divergence of am actual amount from an eKpected return. Standard deviation is calculated by the following
, 4 formula :
Cf =
j t = 1
E C R
- R, ) / C n -i)
(3.4)where ;
a =.standard deviation of rate ct return P = rate g-F return o-f securitv .j at time t
P
t
= the avera.Q^’ of rate of return cf stock i for the number of return periodsn ·= number of return periods J] — =igma, which means the sum
3.3 Risk reduction through diversification :
Diversification can reduce the portfolio's risk below the weighted average of the total risk, measLired by the standard deviation of the individual securities, whenever the individual securities in a portfolio are less than perfectly positively c D r r e 1 ¿41 e c;. It is u su a. 1 i у n о t. poss ibie to totally eliminate risk in a portfolio of securities because of the fact thcit most securities are positively correlated with returns in the
tCl, %J .
P u Ы Labi, n q C o .
ElwTn^rita of· Eoonoi-r'ivtrioa,
I N C . , S a c o n c l Edi.ti.on, p p . 14-5
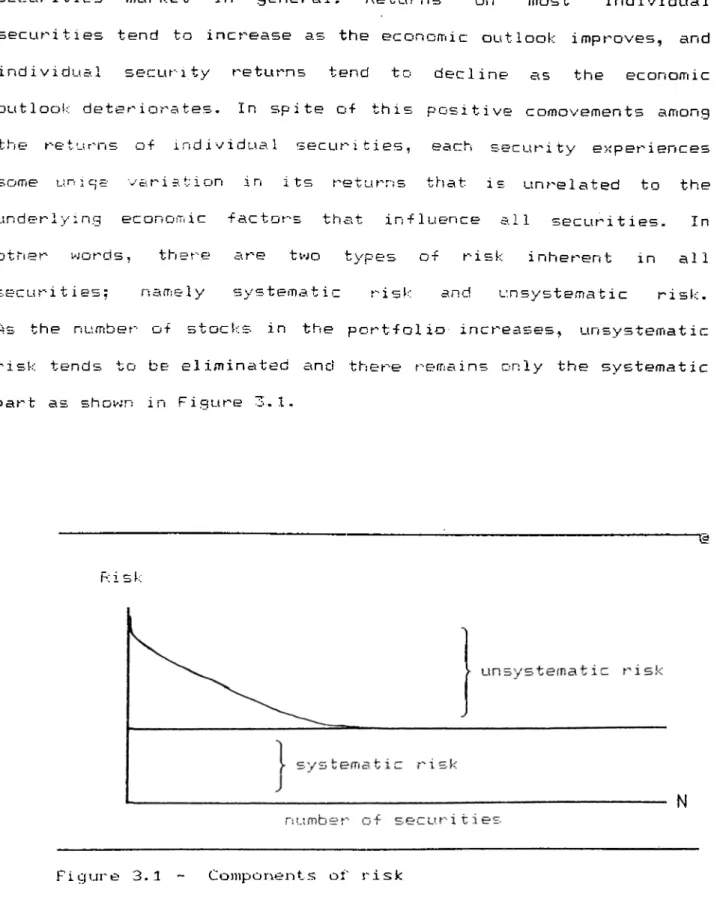
securities market in seneral. "Returns on most individual securities tend to increase as the economic outlook improves, and individual security returns tend to decline as the economic outlook deteriorates. In spite ot this positive comovements among the returns ot individual securities, each securitv' experiences some unipe variation in its returns that is unrelated to the underlying economic factors that influence all securities. In other words, there are tv^jo types of risk inherent in all sec Li r i t i e s ; n a<Tie 1 y sy s t ema tic r i s k an d u.n sy s t ema t i c r i s k -As the number of stocks in the portfolio increases, unsystematic risk tends to be elimina\ted and there remains only the systematic part as shown in Figure 3.1.
K i s k
N
Figure 3.1 - Components of risk
3.3.1. Systematic risk :
Systematic risk refers to the portion ot the variability of an ind i vidLiai security's returns caused by factors affecting the market as a >-'hoie; as such, it can be thought of as being nondiversifiab1e . Some of the sources of systematic risk, which cause the returns from ail securities to vary more or less- together, include the foliov^jiing :
jft interest rate changes,
^ cnar?ges in purchasing power,
changes in investor's expectations about the overall perfDr-mance of the
economy-Since diversification can not eliminate systematic risk, it is the predominant determinant of individual security risk p rem i urns.
3.3.3 Unsystematic risk :
Unsystematic risk is unige to the firm and it is the variability in a security's returns that is caused by factors such
trie following :
Щ t П e a V a. i 1 u иi1 i ty c
^ the effeots of for
strikes.
♦ the uniqe ef f e
1 Li t i on c on t ro 1 ,
3ft<Tia П a g s m 0n t <capab i the particular 1e
such goverrijnen t regulation as
d-ec 1 s 1 un ,
:he firm employs.
1 n
Becur ities can success-ful ly eliminate most o-F the unsystematic risk inherent in individual securities, since unsystematic risk is uniqe to each -firm. The extent that the unsystematic risk in a port-^clio is eliminated depends entirely on the correlation coet Vicient between the returns- ot securities in the portfolio. The -alue of correlation coefficient, always lies in the range from -1 to -f 1 . A correlations coef f i o i an t of -f-1 indicates that an innnaase in the return for one security is associated with a propo-*t ionai increase in the return for one other security. A coef-icierst of -1 indicates that an increase in the return for one secu- ity is associated with a proportional decrease in the return for one other security. This provides an opportunity for investors to eliminate the unsystematic risk inherent in the stocks included
ths portfolio.
The unsystesma t ic risk inherent in a portfolio's individual secL!‘'i t i es can be effectively eliminated without including a large
‘ities in the portfolio. In fact, randomly
LOS of as few sis ten to fifteen securities can
:esfu. lly diversify a. large portion of the unsystematic risk of
. nd i V i d Lia 1 secLi r i t i e s. The r i sk refiia ini ng after d i vers i f i -
market related, or systematic, risk and it is
;Lirn are two key features of investment media and egy. Thus, it is important to identify their sour'ies. The -analysais of risk and r'etur'-n should not be undertaken wit.dout carefuî considérât ion of tne impact of other in v e s t o r s ’ actions on security prices. In an efficient capital market there will be likely relationships between risk and return.
secLr-i t i es can be numba.^- of secur cons t ted p o i··'t f 5UCC-5fully d i ver the ind ividLiai s cation is íTía r*"ki e Lin a V c 1 d a b le
-Kisk and ret! i n vss. t men t sti-atE
4. THE THEORETICAL RELATIONSHIP BETWEEN SYSTEMATTC RISK and f i n a n c i a l VARIABLES :
4.1 Financial ratio analysis :
hinariial ratios enacle an ana.lys;t to make comparaeions oi a
T1 rm s fir-nciai cortaitian over- time or in relation to those of
uirTie"· -r 1 re = . 5hey rti i at ion sh ips r.hat indicate something about
a firm^s activ i t i e s and they essentially s t a n d a rd iz e various
elements c- financial data for differences in the size of a series
o~ ·!* Л nan c i a 1 da;ta when making cornpar'^isions over time or among
firmSu The-e are likely relationships between financial variables
and the s/stematic risk inherent in common stocks.
Accoc:"tir?g risk measures attempt to highlight several aspects
of the L‘ПС e t a 1П t у associated wl th tne earn;
o- the f 1 r- - In part icul ar, account in я risi
as surv-og s tes for trie total variability
г с;п-:гп:.:г: О у 11 у sscurities. Thus^ they ^··e^i.
and indi VI :;Liai istic components.
■} i n g s (о r Г" e t u rn) stream
m e a s l* r"*e s ca n be viewed
c f ^"·e t Li r n of a f i rm ' s
act both the 5ystemat ic
a (R.)
i i /'3 cr ■ Пл (4. 1)
If r:he systeiT?atic and i nd i v i dua 1 i st i c componen- a^--e
positively correlated, then it is reasonable to view accounting measLn-^ss as s u r r o g a t e s -for systematic risk as well. The evidence ir:d;icates T:hat p o s it i v e correlation does eiiist (securities with a
larger than a v e r a ge ,6’ tend to have a larger than average variance
л . 2 Theoretical relationships : 4·2.1 Leverage :
As debt is irrtrodLiced, the earnings strea.iTi o-f the common stockholders becomes more volatile. Hence the leverage ratios can be used as a {пеагВ1_«.!-'е o-f risk ireduced by the capital
structure-To deve 1 op a theor-e t i c a. 1 re 1 at :i onsh i p between systernat i c risk, and ]. f V e г riq tr* If i. t is nece-ssary to assume that -firms are ab 1 e to borrow a П d i en d a t the same risk tree rate o-f interest as the ind i V i d u a 1 i
nvestors-From eguatior? 3-1 an alternative e>i press ion -for the expected rate D-f return required by the shareholders o-f a -firm i can be developed.
EC
=
(4. 2)From equation 4-1 it is noted that the numerator represents the earnings to the sharehoider's o-f security i during time period t. N o t â t ionaily it can be shown as :
EC X . O = E C P ,..^r - P..- + ECD,^)
4 - r. ;where
X,^ =■ accounting E-3rnings( net at depnec i a t i on but before in.terst
2. "C
and ta;-:es )
Spec i -f i c a 1.1 v , ^ t is assumed that a.ccoun ting earn i ngs roll a
stable random wall· vs'hich imcves ;^iith end o-f period wealth- There is very little knowledge, either theoretical or empirical, concerning
research evidence C Albrecht, Looka.bil and McKeown (1977) 1 indicated that annual accounting earnings were well described by a ran don w a 1k p roc e s s
-consider a firiri , Li, which has no debt in its capital structure- The eiipected rate ot return reguired by the
3Г{a re!” D1 d rs t^ t tlie 11 rn’t ü i. в as "foil w ъ ï
('4.4) Р.И
^he leverage can be inctrcduced at this point. I-f the -firiT) U decides to alter its capital structure such that the -firiTi obtains
debt at the riskless rate R and sioL? 1 taneou.sly uses the proceeds
:.o acQuire a^. much as poscr -i h . 1e of equity security- It the
c h a n9 ^ i П cap i tal str‘Lie tLire i'
the '1 rm 's ass e t s or polic ies
E>enot i—1 Q the debt a:S DB and L
t i r m a 1- 'c e г the issuance ot debtH the rate ot return reguired by
the ^-amaining s h a r e h o l d e r s is as tollows :
ECRbt) -ECX^.) - R . D Bl, (4.5) Pbt (1 9 7 9: an d ,
incorporât ing (4^3) and (4,4) into L-AFTi model, Bov^^jari
las shown that ^
Cq v(X ,R ) = P.
U · 0 : u Й'! (4.6)
(R )
-L· · r ·' r c V ( R ,u ’ R ) m (4,7)
u P ,L ■■ then Cov(R ,R ) L m cov(F: ,R )и · m bv the tactor F'
и Finally, it can be -hown that ; P
= L
U
p и
(4.8)
The ecjuation (4.7) shows that the systematic risk of the ie>ered firm, is fciiLta 1 to tГ?e ·=:·уstr=rma'C ic r isк of thie Li П i e V e г e d
^ adjusted
for-u cne (d 1-r Terence quity value of twc
4. 2. 2 Accountinci Beta :
Market beta is explained by the covari ab i 1 i ty between nriarket rerurn and individual security return divided by the variance of ths return on market portfolio 5
в
'У \ iR Щ F’ ) i ' m (R )
(4.9)
Gn the other hand, accounting beta is expressed as the
C O -ariabi1ity of a firm's accounting earnings with the accounting
ea.n-inqs Dr the market portfolio v
...A r- ( X , Л )
y^ (X )
rn
(4.10)
ror the sake of simplicity it is assumed that there are on 1y pL:'S· eguity firms in the marl·;et portfolio- Then, it is known that;
X
R --- --- (4.11)
X is the total тагЬ;ек value of the market portfolio of rn
i ty sec ui··· i t i es By the inelp of some mathematical manupu J. a t i on s , r e 1 ationship between accounting beta and market beta can be
il =
rn . A
-- /V
The accounting beta is directly related to the market beta, because the terms constituting the total market value are nonstochast ic
-4. 2. 3 Size :
Larger* -firms are less risky than smaller firms, (in terms of default risk) The most single important financial statement variable in predicting the bond rating of a firm is total
assets-indiV idual asset v.rti less than perfectly
cor'-re i a ted, 1 сйгдег f i r^ms will have a lower" variance of rate of retur^n than smaller" firms.
IП t e r m s of p о г" t f о 1 i о t h eo r у , the la r g e r" f i r ms bee ome mo re efficient by incr"easing the number of assets in the portfolio. Lar"ger fir-ms ar-e less r-isky than smaller- firms only if the average ,e of assets in which they invest is lower- than that of smaller f i r-ms..
The theor-etical r-eiat ionsh ip between size and market beta can be easily demenstr-ated if it is assumed that firm A and firm Б are combined to form firm C. Also, it is assumed th,-i4t there is not any syrterg i s t i c effects- Then ;
Хд " Xe
P
A.
в
By the help of this D a s 1 c г ■e 1 a t r-etur-ns for f i rm C wit^I the r-etur
<4.13)
t » L·-·/ the mar-ket can be
rep resen ted
cov(R =, R )==ccv( C ■ ifI P + F' A В R ) = rn > -f F* A В C D V ’X -b X ,R ) (4- 14) A В · rn
Multiplying by constant'^ egual to one and simp 1 i tying, the ■Following equality is
obtained-P L-Ov (R Ч R ) — C' rri P P A В ‘-uv(R ) H-A ■ Yf\ P + p A В cov(R -R ) (4.15) в in
By dividing both sides ot equation by the variance o-f the return on market port-folio, the sys tema t i c risk components are obtairfed . r' P в P + P A В ^ r- P + P r- ^ A в (4.16)
The risk resulting -from entering into new investments is a simple weighted average o-f the risk o-F individual investments- There-fore, there is no necessary theoretical relationship between size and systematic risk.
4. 2. 4 Dividends :
Empiricsil results indicate that the payout ratio does have a signi-fi cants negative correlation with ,6. But it is also stated that dividends do not ckirectly a.-f-Fect p but do convey considerable i n -FDr*·ai t i on conc.^Y-ri i rig r u t u.re earn i ng s
-It is Eisserted that, ceteris paribus, firms with low payout r- a t i о s a •e more risky. This belief c-an be rationalized the foil c w i П g m a. n n e r·' i It f i r· гг is f о 1 1 u’w p d 1 i l_у of d i v i d e n d stabi 1 i zat ion and adverse to paying out more than IVU/u {or any X)
qP earriinga in ar?v single fiscal period, then firms with greater •-'olatility in earnings wi 1
0 r Ti 1 Г? g Sv p Thus, i L· c a
will H ciy OLÁ S c:^. 1 ljwe r P e r c e r~< t cf expected О e V .1 □ as a su r r•ogate for management :a i n tу ass DC i a t ed W i th the firmd s
Bowman (1979) states that the dividends do not directly a-f-fect (3 but do convey considerable information concerning -future earnings- He adds that if any form of a dividend variable were related, it should be in covar i ab i 1 i ty form (i.e. dividend f3) , He concluded that there was distinction between theoretical models and empirical results. His eiip lanat ion was that the results may only indicate that the variable b e i n g tested was a surrogate for another variab1e.
4.2.5. L i q u i d i t y :
Liquid assets or current assets harv'e a less volatile return thain non-curren t assets (for exsimple, at the extreme cash is a risk free asset if we ignore the purchasing power). But, differentia1 riskiness among firms is more explained by the differential riskiness in their non-current assets they held. It is expected that liquidity re 1 a t i or« sh i ps will not have high association with the rriarket determined risk measures.
5. METHODOLOGY
5.1 Selection of particular stocks :
For the -fulr: 1 Iment of the objective ot this study, a sample or stocks needs be selected among the stocks traded on the
Istanbul Sto }. p , . -•; _ i4ei ^ ^ ,n H first stock mar'ket.
ihe basic cr-iler-ion used to select these stocks was based L. _
:■ И ^r:· _ L-· / .1 1 J. ! ) .i. L· y - trading and the ava x1ab i1 i ty of price data
du r ing the peric: 10. 1. 1986 to 29.12.1989. T о check whether the C DO r I— _·. ·, z-:r ·~fJ '\/ K ri 'c= :::{ c:— -* a i g h t and com p i e t e w e e k i y past price data in
t e ms of weekly c losing prices (i . e . F r i d a y 's c 1 os ing prices) , i t is nece 5 s a ··■·y t o cDserve the price series of t:П e s toe к during the P e r iod covered by the study. As a result D f this selection P ro cedure, stocks t h a t a re d ec i tded t о Ь e inci ud ed i,n the study are 1 1 = t ed in Tab Ie s .1 ,
I.') Akci mentó 1 5d Ejıka Hol di î'ıg 39d Koruma Tarim 2 J Anadc^lu Cam 1 6d Er eğli Demi r Çel i k 30d Kc.yta-ş
3j .Arç^i i k I7d Good Year 31 d Makina Takım
41) Ayniar iSd Gübre Fabrikaları 32d Met aş
5D Bağf 3.Ş 19d Güney Biracılık 33d Nasaş
6j Bolu Çimento 20d Hektaş 34d Olmuksa
71) Br isa Bid İzmir Demir Çelik 35d Otosan
öd Çelik Halat BBd İzocam 36d Ra bak
9d Çi msa B3d Kar tonsan 37d Sarku^ysan
i Od Çuk ur ova El ek rik B4d Kav 38d Si faş
11 d Dök tas B5d Kepez Elektrik 39d Türk De m i г d ö к ü m lÖd Ec z a c 1 b ası V a irim B6d Koç Holding 40d Tü г к Si e me n s i 3d E^e B’i r ac 11 ı B7d Koç Y a 11 1 nı 41 d T. Şişe Cam
i 4d Ege Gübr e B8d Kordsa 4Bd / a s a ş
Table 5.1. List of stock included in the study
5.2. Adjustment of data :
First o-f all, raw data, past prices and declarations"^ made by the corporat ions, were obtained -from ISE Weekly Bulletins -for the peri oct u n d e r c on s i d e r a t ion.
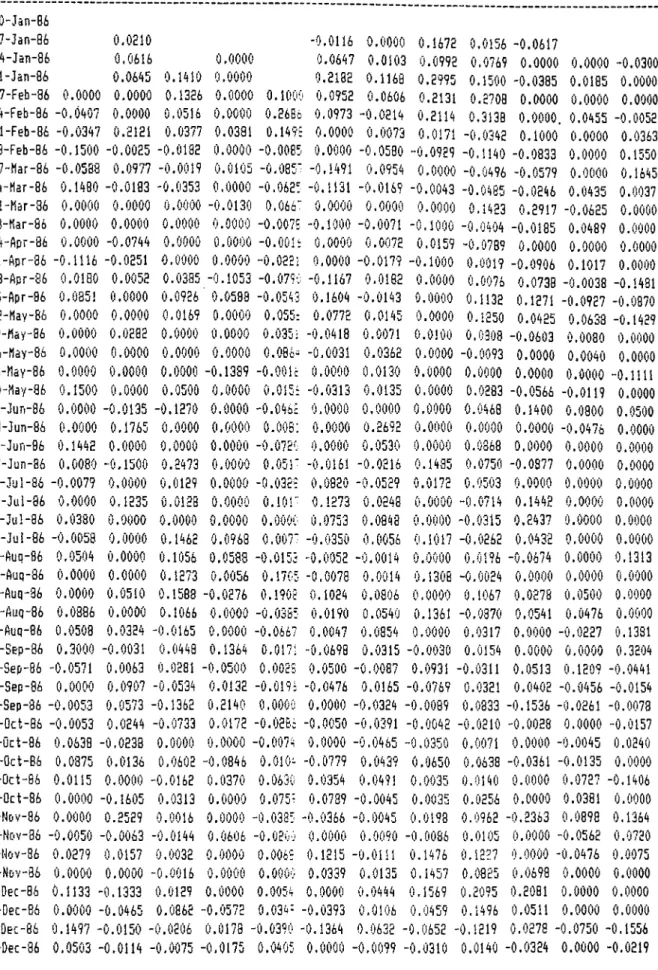
At ter obta.in;ir:3 raw data in the ‘form of v-weekl'/ closin.q prices, adjustment c-F data comîes into the picture. Capital increases and casn dividend payments have et-fects on return series. oo, return series are ca.lculated by using the formula (3.2' to remove tnese effects. Unless we adjust ra*w data, our results yield biased and/or incorrect coneiusions- The return series calculated by the formula (3.2) are given in Appendix I.
At this point it is worth to mention about capital increases made by corpora11o n s , because , in general, capital increases are mace with respect to the funds collected in "Revaluation F und” and r^et earnings items in balance sheet. In Turkey, investors' gains from this process constitutes a large part of their return on trie investment.
5.2.1 Capital increases :
Capital increases, which is a term original to the Turkish Stock Market, are made in two ways in Turkey :
- firms issue and distribute common stocks to the existing shareholders at no cost,
— firms issue and sell com.mon stocks to the existing shareholders through rights offering at nonunal value.
D^;*clar aLioY")S L n c l u d t · c a s h d i v l d f e n d payr/i*snts a n d c a p i t a l i n c r * a s ^ s . T h & ts-rrn c ap 'iL aL i n c r ^ a s o rcfi'&rs t o t h * LncrGias€»a mad& t n L h « c a p i t a l o f a c o r p o r a t i o n d l t h & r I n tefrrns o f s h a r c f s d i s t r i b u t e d f r e e o r s o l d t h r o u g h r i g h t s o f f e r i n g a t p a r vViComnal/
In Turkey, the notion of financing through the issuance of common stocks is slightly different from that of other countries. A new concept, namely “Revaluation Fund", came into the picture by the legistlation of nev‘4 ta>i in 1983. By this law corporations had the right of granting new issues of their stocks to the e>:;i sting shareholders at nc cost- Reva luat ion Fund account was added to the owner's equity and retained earnings side of balance sheet to compensate for the increase in the assets side. This increase was prirriarily due to the pr"-evaiiing inflation- This adjustment can be done every year, whenever the book value of the assets of the company is recalculated with respect to several criteria such as
infiation-The amount of shares equal to the value of the Fievaluat ion Fund is distributed to the shareholders to balance their losses resulting from high inflation. However, if the company needs new funds тпг- its new investments, it can issue new stocks at a price b e t w S' e Г*; ] t s s t о c к ' s m a Г‘к e t p i··· i c e -a n d n dm i n a i p i c e
-Every year, most companies declare the date and amount of capital iTicreases that is prcjected for the year- They also B.nr,OLAnr:E! the percentage of both type of capital increases-
5.3. Calculation of risk measures :
Following the calculation of return series, Bivsiriate I··.0о ress 1 c : a . na 1 уsi s was carr ied оlit b у us ing the a r кet model of return generating process as presented in eguc;tion (2 -S>-R e ;h r e s s· i n g i r'jd i v i d a 1 r e t Lt.r- ri s e n i e s o r j it?a ^■·t·:e t r s t i.ir ri s e i··' i e s y "ie 1 □ s
cub the systematic risk and total risk of the individual stocks,
since t^'iS s lope of the regression represents f3 and standard
deviation of these return series calcu. iated by the formula (3.4/
gives the total risk of the stock. Total risk and systematic risk
/
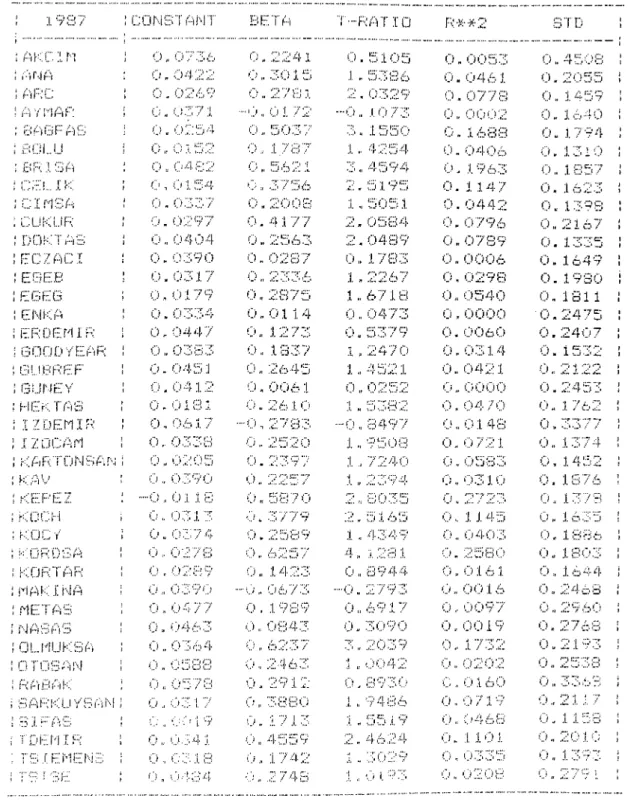
o-f st"ock5 art? obtcained -from this regre?usion for the yecars 19S6, J.VS/, .19bS and 1989. I he? summary of re?su.lts of these bivariate regression analysis is given in Table 5 . 2 . a through Table 5.2,d.
1 93/ \ í··U■···i ! B E T A T--F<AT :i: 0 R-^-^2 STD 0 0 2 0 0 0.. 3 2 6 T· 0:. 7 4 1 0 0.. 012;!. 0 . 0 7 2 4 C i 0 1 4 6 ..0,. 1 1 13 - 0 . 3 3 2 5 0 n 0 0 2 3 0 „ 0 7 I S 0 .. 01 99 0« 5 2 9 :;. 1 „ 2 6 9 7 0n 0 3 3 9 0 . 0 6 9 3 0.. ( ) ij 33 0:. l92Y:^ 0 - 6 3 5 5 0 . 0 0 8 5 0 . 0 5 1 7 0 и i 42 0« 2 9 9 5 0.. 6 8 9 5 0 . 0 1 0 5 0 , 0 7 1 3 0 . 0 0 3 1 0 , 4 5 6 3 1 „ 0 7 4 5 On 0 2 4 0 0 . 0 7 2 4 0- 02 01 ..0,, 0 4 4 7 •••“Y ) l o 4 6 0 n 0 0 0 7 0 0 5 1 9 0 - ()30iZ 0 „ 2 5 0 5 0 . 6 4 2 5 0- ÎJ035İ 0 . 0 S 3 9 0.. 0 4 0 3 •-0„ 15 65 - 0 „ 3 8 3 5 0 n 0 0 3 1 0., 0Q76 0 . 0 1 7 7 -•0 - 31 66 -■•0„ 6 0 4 2 0 n 0 0 7 7 0 . 0 8 9 1
'0 . T^Oci ö ..YE 16VY·' ..Y) , о / 0 n 0 0 9 7 0 . 0 4 2 6
•00102 ■••“0 „ 3 3 0y:: - 0 . . 69 1 4 0.010;!. (-■’. O S 16 0 0 Z· 0 2 - o „ i4:i.o -•0„ 1 6 8 4 Y) n 0 0 0 6 0 . 1 4 2 0 0. 0 0 4 2 0 г 5 3 2 4 2 - 1 1 0 3 0- 0 8 8 3 0 „ 0 5 0 8 0 0 0 & 0 ••-0.. 2 3 3 5 - - 0 5 8 4 6 0 0 0 7 4 0 . 0 6 5 4 0 n 01 01 ..0.. 4 4 9 9 ..1 1 760 On 0 2 9 2 0 . 0 6 3 4 0 n 0 A· ·'·!■ Z· --() „ 61 1 3 .0 „ 3 5 3 9 0.. 0 0 2 7 0 „ 2 7 9 7 4.^.. Y) 1 94 Yi /. / 0 . 5 1 /5 0 0y)2 I 0 . 1 5 3 8 0 . 0 1 7 9 ■■■'Y) „ Y;!5VY· --0 „ 6 0 4 6 0 n 0 0 7 9 0 . 0 6 9 7 0 .. 0 2 0 '0 0.. 7051 1 .. YEüOD 0 n 02 41 0. l o s s 0 „ 03 71 ..0« 7 6 5 J ···' и .. 6 Ч ci iT - 0 0 8 2 0 . 2 0 6 9 0 0 :l. /' 9 0 .. 3 4 1 8 Ou 5 4 7 0 On 00Z>Z· 0 . 1 0 5 5
0 0:i A- 4 0 „ 22(.)9 On 7 9 9 8 0 , 0 1 Y;.4 U . i.)468
0« 0 2 4 9 0.. 2 3 2 3 On 3 0 1 5 i.) n 001 9 0 . 1 3 0 1 .(.), i')04-T •••■0 „ 2 0 9 Y- --0 8 5 4 3 0 n 0 1 6 0 0.. 0 4 0 3 0.. ijo ;i. 6 0 2 4 4 3 On 740c> Y) „ 01 1 5 0 . 0 5 6 4 0 0 2 2 4 •■•“0 .2 1 06 ..0 n 3 7 7 9 0 n 0 0 3 0 0 „ '0949 C) M 0 0 3 3 YE 0 2 3 3 0 0 7 9 Zj 0 n Y)iJY) 1 0.. 0 5 0 5 ( . ) 0 2 3 8 - 0 2 7 Oy^ 0 n 4 c) 6 6 0 n 0 0 4 7 0 . 0 9 8 1 0.. 0 1 2 4 0 9·.;!’ .1. J. n 9 9 6 6 0n 0 7 8 2 0 . 0 8 2 6 и LYZV-!; · 1„ 2 4 6 4 0. 7 3 8 8 Y^ n 0 1 2 0 0 , 2 7 7 1 0 0 2 2 7 0 3 7 5 - 0 . 9Y201 0 n Y) 1 7 ‘7 0 . 0 7 0 1 0 . il 2 0 -T — 0 , 2 5 6 4 ..On 7 5 6 0 0.. C) 121.^ 0 . 0 5 7 9 0.. 0 1 5 7 0. 2 6 1 2 V n 4 / 9 3 On 0 0 4 9 0 . 0 9 2 8 i-W =·.·..■ .İ. г1 г - ! Г J г) г' и AytîhF^ Ь й и г ¡-^ Ь BR j; s А C E L I к: с MSА CLİKUR D Ü K T A S E C Z А С 1 IZGE.İ-; Е С ЕС ERD G U B E E E GÜNEY Н Е К Т А С 1 ZÜCAfl KAlYTLiNCArj KAT' Ь.ОСн
}·:■ се:.: V
KGRDCA K Ü E T A R МЕ'ГАС I'··-! Г··! Ь А Ü L ri U K CA Ü T G G A N RABAK 9AR^HjVCYW\! Н .Î. Î- i'-jY> i d e m i r T s I EM E (TC : i Z'.[ -ez T a b l e 5.2. a List of s t o c k s i n c l u d e d i n 1 9 8 6 S T D s t a n d s for t h e s t a n d a r d d e v i a t i o n s of w e e k l y r e t u r n s1 937 С ÜN S7T ANT- BET H T .F-^ATIü R-y:‘-^2 BID Акс; ;lr\ ANA ARİJ A Y NAR BAGF" AB 3ÜI...U BR ЗА j: k; C I NBA CIJKUIT D Ü K T A3 F:CZAC I E 0 E E E G E G ЕМКА EFNjEN i R GÜÎ.JD y F:.mFY G U B R E F GÜNEY f-i e k т а з i z d e n i r I Z Ü C A N К AFTT LJNyA'îN KA9 K E P E Z KÜCH î-:;ü c Y KTJRDBA K Ü R T A R т к I i^lA N E T A S ГЧ H hi F4 Ü L N U K 3 A 0 "i·· ÜS AN KiBB Al<. 8 A R K U Y 3 A N •A j. i- A3 ■İ DEN I fi T 3 i E MENS •■■Ÿ·: I Si·:· С).. 0 7 3 6 о п 0 4 2 2 о - 0 2 S 9 ij „ ÎJ37 :!. О « ОТ:54 ;г Л s:-:;! О . (;^432 , >;:· 154· о п 0:7:77 „ '.:)297 о (.) 4 7) 4 О .. 0 3 9 0 0- 03: 1. 7 7). о :!. "79 о - 0:7:74 о . 0 4 4 7 О .. 03Sİ7 О - 045:1 о , 04 :1.2 Ci. о 1Î71 о .. i":i6:1.7 о .■ 0BZ8 о .. Ci 2 Ci 5 Ci.. Ci:79Ci -Ci (.) :i. :i. 3 Ci.. 03:i.3 Ci Ci : 774 Ci = Ci2S9 Ci :: 0 Z 9 0 0 n Ci 4 7 -7 0 - Ci463 Ci.. 0 3 6 4 Ci „ i::i53C> Ci Ci 5 7 Ü CiCiiT :l. 7 cy:.'1 9 Ci.. “^:i·:^4 J. 0 c-i:;·. :i. s . Ci4-;:;C4· 0„ 2 2 4 1 Ci.. ::;!:ci 1 5 Ci.. 2 7 3 Л -.:i „ 0 172 Ci.. 5 0 3 7 0. 1 7 3 7 0 5 6 2 :i. 3 7 5 6 Ci „ 2 Ci Ci 8 0„ 4 :[ 7 7 0 „ 2 5 6 3 0 „ 0 2 8 7 Ci „ 2 3 3 6 0 „ 2 8 7 5 01 1 4 12 73 13 3 7 2 6 4 5 '■.) n Ci Ci 6 1 .1 76) 1 Ci -0.. 2 7 3 3 0.. 2 5 2 0 Ci. 2 3 9 7 0.. 2 2 5 7 Ci „ 5 8 7 Ci Ci„ ;:;|;779 O , 5 c;!S 0.. 6 2 5 7 0.. 1 4 2 3 ■■4.İ'-.iô 0 . 1 9 8 9 0 Ci 8 4:7 Ci.. 6 2:7-7 0.. 2 4 6 3 0 Ci 0 0 29 :i. 2 3880 1 7 1 3 4 5 5 9 0.. 1 7 4 2 " i 2 7 4 8 Ci. 5105 1 .. 5 3 8 6 2 - 0329 - 0 . .1.0 73 3„ 155Ci 1 .. 4 2 5 4 3.. 4 5 9 4 2 „ 5 1 9 5 1 .. 50 51 2 - 0 5 8 4 2 - 0 4 8 9 :!. 7 8 3 2 2 6 7 67 :l. 8 Ci 4 7:7 5 3 7 9 2 4 7 0 4 5 2 1 0 2 5 2 5 7:8:2 8497 9 5 Ci O 7 2 4 0 Ci .1 1 (:.■) Ci 1 1 :!. 0 :1. :i. 1 2 :: 8 0 3 5 2 „ 5 :i. 6 5 1 . 7-349 4„ ;i.281 .0 Ci :l Ci .!. :i. .····, :L :l. , 8 9 4 4 2 7 9 :7 , 691 7 3090 2 Ci 39 Ci Ci -Ч· 2 6 97* Ci 94 86 . 5 5 :î. 9 4 6 2 4 , 3029 Ci i. 7C7 Ci „ Ci Ci 53 0 „ 0 4 6 1 0 , 0 7 7 8 Ci.. Ci Ci Ci :2 Ci.. 168 3 Ci,. Ci4Ci6 0 . 1 9 6 3 0 . 1 1 4 7 0 , 0 4 4 2 0.. 0 7 9 6 0 „ 0 7 8 9 Ci „ Ci0 0 6 Ci, Ci293 0.. Ci5 4 0 0 , Ci Ci Ci Ci Ci « Ci Ci 6 Ci Ci „ Ci314 0.. 0 4 2 1 Ci,. Ci Ci Ci Ci 0 , Ci 4 7 Ci 0 0 1 43 0.. 0 7 2 1 Ci.. 0 5 3 3 Ci.. 0 3 1 0 0 „ 2 7 2 3 0.. 1 145 0 „ 0 4 0 3 0.. 2 5 8 0 Ci „ Ci 16 :i. C^,. CiO 1 6 Ci .■ Ci Ci 9 "7 Ci. CiO 1 9 0.. 1 7 3 2 0., 0 2 Ci 2 Ci 1 6 Ci 071 9 0 4 6 8 :l. 1 Ci 1 Ci:7:77> 0 2 0 8 i..; 0 0 0 0 0 : Ci, 0. 0 „ 4 5 0 8 0 - 2 0 5 5 0.. 1459 '•„Jj. c> "I Ci 0 „ 1794 0 - 1 3 1 0 0.. 1357 0 - 1 6 2 3 0 - 1 3 9 3 0.. 2 1 6 7 0 . 1 3 3 5 0 . 1 6 4 9 0 - 1 9 3 0 Ci „ 1 3 1 1 7475 7407 0 . 1 5 3 2 0 „ 2 1 2 2 0 . 2 4 5 3 0.. 1762 0 , 3 3 7 7 0.. 1374 0 . 1 4 5 2 Ci, :i. ci / 6 0. 1 3 7 3 0 .. ;l. 6 -.I D 0 . 1 8 3 6 Ci. 1803 0:. 1644 Ci. 24-66 0 2 9 6 0 0 . 2 7 6 8 0 . 2 1 ^73 0.. 2 5 3 3 Ci Л 2 :l. 1 7 (:i. 1 :i. 53 Ci.. 201 0 0., 1393 0., 2 7 9 i.
Table 5. 2. b List of stocks included in 1987