Route Optimization for the Distribution
Network of a Confectionary Chain
Article in Promet-Traffic & Transportation · December 2015 DOI: 10.7307/ptt.v27i6.1645 CITATION1
READS79
3 authors: Some of the authors of this publication are also working on these related projects: Solution Approaches for Container Shipping Line Network Design and Integrated Container Terminal OperationsView project Anil Inanli Politecnico di Milano 1 PUBLICATION 1 CITATION SEE PROFILE Başak Ünsal Bilkent University 1 PUBLICATION 1 CITATION SEE PROFILE Deniz T Eliiyi Yasar University 69 PUBLICATIONS 214 CITATIONS SEE PROFILE All content following this page was uploaded by Deniz T Eliiyi on 06 January 2016.
ABSTRACT
This study considers the distribution network of a well-known perishable food manufacturer and its franchises in Turkey. As the countrywide number of stores is increasing fast, the company is facing problems due to its central dis-tribution of products from a single factory. The objective is to decrease the cost of transportation while maintaining a high level of customer satisfaction. Hence, the focus is on the vehicle routing problem (VRP) of this large franchise chain within each city. The problem is defined as a rich VRP with heterogeneous fleet, site-dependent and compartmen-talized vehicles, and soft/hard time windows. This NP-hard problem is modelled and tried with real data on a commer-cial solver. A basic heuristic procedure which can be used easily by the decision makers is also employed for obtaining quick and high-quality solutions for large instances.
KEY WORDS
rich vehicle routing problem; heterogeneous fleet; compart-mentalized vehicles; soft and hard time windows;
1. INTRODUCTION
Production, handling and distribution of food and confectionary products demands a precise, cli-mate-controlled environment, as well as facilities that will guarantee safe and reliable storage to protect the integrity of the goods. While the cost of transportation is considered as a major factor in the distribution of such perishable goods, the quality and timely delivery are also fundamental.
The case study considered in this paper involves one of the largest confectionary franchise chains in Turkey, founded in 1938. The factory currently
produc-es 60 thousand servings of cakproduc-es, 150 thousand serv-ings of milk puddserv-ings, 20 thousand servserv-ings of syrupy desserts, 7 tons of ice cream, 300 kilograms of hand-made chocolate and 5 tons of pastry products daily. In addition to this product range, the brand offers yo-gurt varieties and buttermilk. At the time of the study, the company has been distributing its products to 179 franchise stores (dealers) in 46 cities, as well as some big supermarket chains. With its 3,000 employees, the company has a factory site of 10,000 m² and a cold storage warehouse of 1,500 m² in Izmir, Turkey. Besides the main facilities in Izmir, there are two ware-houses Ankara and Adana, and three cross-docking centres in Istanbul, Antalya and Bursa.
Based on company management information, the transportation costs arising from distribution is a ma-jor cost component due to the centralized infrastruc-ture. As the number of dealers grows, the total length of the distribution routes increases, which is currently around 350,000 km/month. Timely delivery, which is most crucial in perishable goods, is also affected as a result of this growth. Therefore, the main goal of this study is to minimize the total transportation cost of timely delivery for the defined distribution network.
Currently, the company employs a third party logis-tics provider (3PL) for distribution, and pays on the ba-sis of travelled distance. The distribution is completed in two hierarchical phases, on macro and micro levels. The macro-level distribution involves the direct ship-ment of the consolidated demand of a cluster of cities to the related warehouse/cross-docking centre from the main facilities of the company, using 12 high-ca-pacity vehicles of 2 different types. As there are only five such transhipment points and the corresponding
ROUTE OPTIMIZATION FOR THE DISTRIBUTION NETWORK
OF A CONFECTIONARY CHAIN
ANIL İNANLI, B.Eng.
E-mail: [email protected] Politecnico di Milano,
School of Industrial and Information Engineering Piazza Leonardo da Vinci 32, 20133, Milano, Italy BAŞAK ÜNSAL, B.Eng.
E-mail: [email protected]
Bilkent University, Computer Engineering Department 06800, Bilkent, Ankara, Turkey
DENIZ TÜRSEL ELIIYI, Ph.D. Corresponding author
E-mail: [email protected]
Yasar University, Department of Industrial Engineering Selcuk Yasar Kampusu, 35100, Bornova, Izmir, Turkey
Transport Logistics Preliminary Communication Submitted: Oct. 3, 2014 Approved: Nov. 24, 2015
city clusters are predetermined, this phase is trivial and beyond the scope of this study. The focus is on the micro-level distribution, which mainly takes place between the transhipment centres and the dealers/ stores within cities. Stores in Izmir take their ship-ments directly from the factory without the use of the transhipment points.
A countrywide heterogeneous fleet of 28 vehicles of 2 different types is dedicated to the micro-level dis-tribution of the transhipment centres. Each vehicle has two flexible-capacity compartments having differ-ent climates of storage, one for frozen (-24°C) and the other for cold products (+4°C). Flexible capacities are adjusted via a moving wall according to the varying demand. No split deliveries are allowed, that is, each store must be visited only once by a single vehicle. A time window is defined for each delivery point in the network. While some time windows may be violated with a penalty (soft time windows), some have to be met strictly (hard time windows). In addition, as some stores are located on narrow streets in urban areas while some are located in rural areas, only eligible ve-hicles can be sent to a specific store due to accessi-bility or traffic regulations. Based on these properties, the problem on hand can be defined as a rich VRP with heterogeneous fleet, site-dependent vehicles, soft and hard time windows, and will be abbreviated hereafter as HSDTVRP.
There are numerous studies in literature on rich VRP with various specifications. Some of these share common features with ours in terms of the specifica-tion of the fleet. As an example, Tarantilis and Kira-noudis [1] focused on the distribution of fresh milk, modelled the problem as a heterogeneous fixed fleet VRP, and developed a threshold-accepting-based algo-rithm. Gendreau et al. [2] constructed a heuristic for a heterogeneous fleet VRP where demand was met with vehicles of different capacity having fixed and variable costs. Ambrosino and Sciomachen [3] proposed a solution for a distribution chain of a food market hav-ing two different types of products, similar to the com-partmentalized vehicles in our problem. Their problem was defined as an asymmetric capacitated VRP with heterogeneous fleet and split delivery.
Time window specifications constitute an import-ant feature of the problem, and VRP problems with time windows have attracted much attention from researchers. For instance, Doerner et al. [4] studied VRP with multiple inter-dependent time windows, and developed several variants of a constructive heuristic procedure and a branch-and-bound-based algorithm. Ombuki et al. [5] presented VRP with time windows as a multi-objective problem having two objectives as the number of vehicles and the total cost. They developed a genetic algorithm solution for the problem using the Pareto ranking technique. Taner et al. [6] considered time limitations as hard time windows, and illustrated
through several benchmark problems and a case study that simulated annealing and iterated local search for solving various instances of VRPs can significantly reduce transportation costs. In a later study, Galić et al. [7] presented and discussed the cost savings of a fast-moving consumer goods distributer through for-mulating and solving the problem as a rich VRP with hard time windows. Özdemirel et al. [8] considered optimizing the distribution network of donations in a real-life application, and their problem also included hard time windows. Among other studies in the area, Dohn et al. [9] proposed an extended formulation of VRP with time windows and other temporary depen-dencies, where Pisinger and Ropke [10] developed an algorithm for a capacitated site-dependent VRP with time windows and multiple depots. In their algorithm, all variants are first converted to the rich pickup and delivery model, and an adaptive large neighbourhood search is applied. Their study is also close to our prob-lem in terms of site-dependency.
Some other studies have common characteristics with ours in terms of perishability. As an example, a real-world distribution problem of fresh meat was studied in [11], where the problem was formulated as an open multi-depot VRP, and a stochastic search algorithm called the list-based threshold-accepting algorithm was proposed. Another study considered a heterogeneous fleet site-dependent VRP with multiple time windows, based on a real-life problem of a large food distribution company having products of different temperature requirements, categories, and quantities [12]. However, unlike this study with multiple hard win-dows defined for the customers, our problem involves a single soft or hard time window for each customer. Besides this difference, flexible-capacity compart-ments of vehicles bring an additional complexity to our problem, as opposed to single-compartment vehicles in [12].
Osvald and Stirn [13] considered the distribution of perishables under a different setting, and defined their problem as a VRP with soft and hard time win-dows and time-dependent travel times over a homog-enous fleet of vehicles. They included loss of quality and perishability of goods as part of the overall dis-tribution cost. Hsu et al. [14] focused on perishable goods having a decreasing value function throughout their lifetime, and considered stochastic travel times for vehicles. The problems in these studies are close to ours in terms of soft time-window constraints and perishability; however our study also involves hetero-geneous fleet, multi-compartments with adjustable capacities defined as decision variables, and soft time windows as well as hard ones.
To the best of our knowledge, there is no single study combining the specifications of our rich real-life VRP problem, probably due to the special structure arising from several practical necessities. We describe
our problem in detail and present its mathematical model in the next section. Our solution procedure is ex-plained in Section 3. Numerical results for the real-life problem instances are presented and discussed in Section 4, and conclusions are presented in Section 5.
2. PROBLEM DEFINITION
Before presenting the specifics of our model, data collection and analysis are explained.
2.1 Data collection and analysis
As a result of a preliminary study, the analysis of sales in terms of each product family (such as cake, dessert and bakery) at each point of sale was conduct-ed using data from the previous year. The frequencies of deliveries were identified, and the vehicle capacity requirements of each product were calculated.
The average service times at each store, ware-house or supermarket were identified through an anal-ysis of the speed and position records kept by the GPS software, which is currently used on every vehicle by the 3PL. As a result, the average service time of a store was estimated to be 30 minutes, whereas the service time for a large mall or supermarket was estimated to be 90 minutes. The reason for the increased service duration at malls is mainly due to waiting times at the delivery queues at these large centres.
For forming distance and time matrices, the aver-age pairwise distances and times of the whole distri-bution network were calculated using the GPS soft-ware. The results were verified using the coordinates of each store on a mapping software. Unit costs of transportation and the time violation penalties were directly obtained from the company.
The assumptions of our problem are as follows: – Distribution starts at 07:00 a.m. from all
tranship-ment centres.
– Products must be delivered before 10:00 a.m. for stores in malls, which is strict by regulations, there-fore defined as a hard time window upper bound of 180 minutes.
– All other stores prefer to be served before 12:00 p.m. This is defined by a soft time window upper bound of 300 minutes.
– Each product can be placed on top of any other product in the vehicle, as pallets are utilized for holding products.
2.2 Model formulation
A set K = {1, ..., m}, k ∈ K of distinct capacitated vehicles coming from two types are initially located at the main depot, and are ready to deliver to N delivery points i = 1, 2, …, N through a set of arcs A. The main depot is represented by vertices 0 and n+1. Hence,
the problem is defined on a directed graph G = (V, A) where V = N ∪ {0, n+1}. The set Ki defines vehicles that
are eligible to serve delivery point i (due to narrow streets, etc.). Each vehicle has two compartments, one for frozen products (-24°C) and the other for cold products (+4°C), denoted by p = 1, 2. The following pa-rameters are used in modelling the problem.
Ki – set of vehicles eligible to serve vertex
(delivery point) i;
vk – total capacity of vehicle k;
si – service time at vertex i;
cij – unit cost of transportation from vertex i
to vertex j;
tij – travel duration from vertex i to vertex j;
dip – demand of vertex i for compartment p;
bi – upper bound of soft time window for vertex i;
li – lower bound of hard time window for vertex i;
ui – upper bound of hard time window for vertex i;
pi – penalty cost per unit time at vertex i.
Our decision variables are as follows: 1, if vehicle travels
from vertex to vertex on its route 0, otherwise. ijk k i j x =
yi – time penalty of vertex i;
zik – time at which vehicle k starts serving vertex i;
vpk – capacity of compartment p of vehicle k.
Based on the above definitions, the following is the mixed integer programming formulation for HSDTVRP:
( , ) i j ij ijk i i i j A k K K i N Min c x p y ∈ ∈ ∈ +
∑ ∑
∑
(1) subject to 1 i j ijk j i k K K x i N ≠ ∈ = ∀ ∈∑ ∑
(2) 0 0 1 jk j x k K ≠ = ∀ ∈∑
(3) 0 , ijk jik j j i j i x x j N k K ≠ ≠ - = ∀ ∈ ∀ ∈∑
∑
(4) , 1, 1 1 i n k i n x + k K ≠ + = ∀ ∈∑
(5)(
1)
( , ) , ik i ij jk ijk i j z + + -s t z ≤M -x ∀i j ∈ ∀ ∈ A k K K (6) , 1,2 ip ijk kp i N j i d x v k K p ∈ ≠ ≤ ∀ ∈ =∑∑
(7) 1 2 k k k v +v ≤v ∀ ∈k K (8) , i ik i l ≤z ≤u ∀ ∈ ∀ ∈i N k K (9) , i ik i y ≥z -b ∀ ∈ ∀ ∈i N k K (10){ }
0,1 , , 0 , , ijk i ik x ∈ y z ≥ ∀ ∈ ∀ ∈i j V k K (11)The objective function in (1) minimizes the total cost of transportation and time window violations. Constraint set (2) ensures that each delivery point is visited exactly once. Constraint set (3) dictates that
each vehicle must leave from the main depot, and the conservation of flow is ensured by constraint set (4). Constraint set (5) assures each vehicle to return to the main depot at the end of its tour. A vehicle can start servicing delivery point j after it finishes the delivery of the previous vertex (i), and traverses arc (i, j). This fact is reflected by constraint set (6), where M represents a large enough number. Constraint sets (7) and (8) to-gether impose compartment and total capacities for the vehicles. Note that the optimal compartment ca-pacities of each vehicle are determined by the model. While constraint set (9) imposes bounds for hard time windows, constraint set (10) computes the violation of the soft time windows. Note that the model allows for different soft and hard time window bounds for each vertex. Finally, constraint set (11) imposes sign restric-tions on variables.
3. THE SOLUTION PROCEDURE
An attempt is made to optimize this NP-hard prob-lem by modelling on IBM ILOG CPLEX Optimization Stu-dio 12.4 platform using OPL programming language and CPLEX solver. However, as the problem size grows exponentially, computer memory problems prevent ob-taining even a feasible solution for problem instances of some cities. For this reason, we developed an extension for a well-known heuristic algorithm for obtaining quick and high-quality solutions for the decision makers.
As the decision maker required a simple-to-use and simple-to-understand heuristic, the Savings Heuristic by Clarke and Wright [15], which performs the rout-ing of vehicles from a central depot to a number of delivery points either in a parallel or sequential fash-ion, was employed. However, as the basic form of the Savings Heuristic is not sufficient where time windows are concerned, we adapted the heuristics to employ hard time constraints, as shown below. Through the Savings Heuristic, more than one route can be built simultaneously in the parallel version, where in the sequential version exactly one route is built at a time. As a pilot study, both versions were executed for small instances, and the results were compared with the op-timal values obtained from the model. After obtaining satisfactory results, larger instances were tested. The model was run with a 30-minute time limit for larger instances. In this paper only the sequential version is reported, as it consistently provided better results
than the parallel version. The developed heuristic pre-sented below was coded in C++ on a Microsoft Visual Studio 2010 platform. All runs are made on a 1.8 GHz Triple-Core processor PC with 4GB RAM.
Sequential Savings Heuristic (SSH):
S0. Input demands, hard time windows, distance and time matrices, service times.
S1. Form a subtour 0-j-0 for each vertex, assuming that it is assigned to the main depot. Compute the sav-ings Sij = ti0 + tj0 - tij for all vertices (i and j). Create
a savings list L and sort all savings in descending order.
S2. Select the first element of list L (the largest Sij).
Form a new subtour by connecting (i,j) and delet-ing arcs (i,0) and (0,j) if the followdelet-ing conditions are satisfied:
– vertex i and vertex j are not already in the same subtour,
– forming the new subtour does not violate any of the constraints. That is, the new vertices to be added must not violate vehicle capacities, compartment capacities, or hard time window constraints. S3. Return to S2 and process with the next entry in the
list, until list L is empty. Compute tour time, dis-tance and penalty.
As it can be seen in the above pseudo-code, the heuristic does not perform the forming of a subtour if any hard time window is violated in Step 2, even if it results in a saving. This is how SSH considers the orig-inal hard time window limitations in the problem. For the treatment of the soft time windows for stores, they are regarded as hard time windows in SSH, and sev-eral different upper time limits are tried in an iterative manner for obtaining minimum violations at minimum cost, as will be illustrated in the next section.
4. NUMERICAL RESULTS AND DISCUSSION
The instances for all cities were solved with real data from the company and several representative results are presented and discussed in this section. For handling the soft time windows in the problem, the SSH heuristic was executed at three levels of hard time window upper bounds (UB) for stores as 300, 360 and 420 minutes. Note that 300 minutes correspond to the original upper bound of the soft time windows in the problem, which means that all stores are to beTable 1 – Results for Ankara
Solver Mileage (30-min. time limit)
(km)
Current Mileage
(km) UB for Stores (min.) Heuristic Mileage (km) Vehicles UsedNumber of
Ankara 144.6 196.0
300 152.2 3
360 152.2 3
served before 12:00 p.m. We set this bound as a hard limit in SSH, and also tried a one-hour relaxation (360 minutes) and a two-hour relaxation (420 minutes) to observe if a better objective function value can be ob-tained. Although other combinations of hard time win-dow upper bounds and number of vehicles were also tried, only the pareto-efficient solutions are presented for the sake of conciseness. The upper bound for malls (180 minutes) was not varied, as it is already defined as a hard time window. All SSH solutions are obtained under 30 seconds. A 30-minute execution time limit for the solver was set, as initial experimentation sug-gested that longer run times did not produce better results, i.e., either the model could find the optimal solution within this time limit, or exited due to insuffi-cient memory.
We start presenting the results with the distribu-tion of the capital city, Ankara. The SSH and the solv-er wsolv-ere executed for this instance having 17 delivsolv-ery points and 3 vehicles. Table 1 presents the solutions.
The total mileage for Ankara is 196 km in the cur-rent practice of the 3PL. The incumbent solution ob-tained by the solver for 17 delivery points within the 30-minute time limit was 144.6 km using 3 vehicles, which brings a 26% improvement over the current mileage. The best solution by SSH was found as 152.2 km at an upper bound of 300 minutes for stores. The heuristic also brings a 22% reduction in total mileage. All stores are served before 12:00 p.m. in the SSH solution, as satisfied also by the solver’s output.
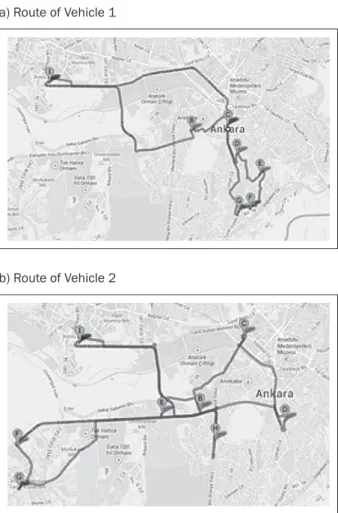
For illustrative purposes, the routes of the three vehicles for Ankara are depicted on a map in Figure 1, where the single depot of the company is represented by point I in (a) and (b), and by point E in (c). The vehicles serve the 17 delivery points, as shown in the figure.
Next, the results for Istanbul are presented in
Table 2. This major city of Turkey has 48 total delivery points distributed to two continents. As no malls are served in Asia region, there are only time window con-straints for stores. On the other hand, to serve some special stores in Europe region with limited morning traffic access, an additional hard time upper bound of 120 minutes is imposed as a constraint both in the model and in SSH only for this region.
a) Route of Vehicle 1
b) Route of Vehicle 2
c) Route of Vehicle 3
Figure 1 – Solution for Ankara Table 2 – Results for Istanbul.
Solver Mileage (30-min. time limit)
(km)
Current Mileage
(km) UB for Stores (min.) Heuristic Mileage (km) Vehicles UsedNumber of İstanbul-Asia No feasible solution 310.0
300 234.1 3
360 234.1 3
420 234.1 3
İstanbul-Europe No feasible solution 512.0
300 400.5 5
360 384.5 5
No feasible solution could be obtained in 30 min-utes by the solver for Asia and Europe regions having 18 and 30 delivery points, respectively. Currently, four vehicles are used for Asia region and five for Europe, with a total daily mileage of 822 km. For Asia region, the best SSH solution uses three vehicles instead of four at UB=300. This solution has a mileage of 234.1 km, which brings a significant 24.5% reduction over the current value. For the European region, all SSH solutions use five vehicles. For UB=300, a total mile-age of 400.5 km is obtained, which brings nearly 22% improvement over the current one. Further improve-ment in mileage was possible at the expense of a one-hour violation in original soft time windows; i.e. the best SSH solution in terms of mileage was obtained as 384.5 km at an upper bound of 360 minutes.
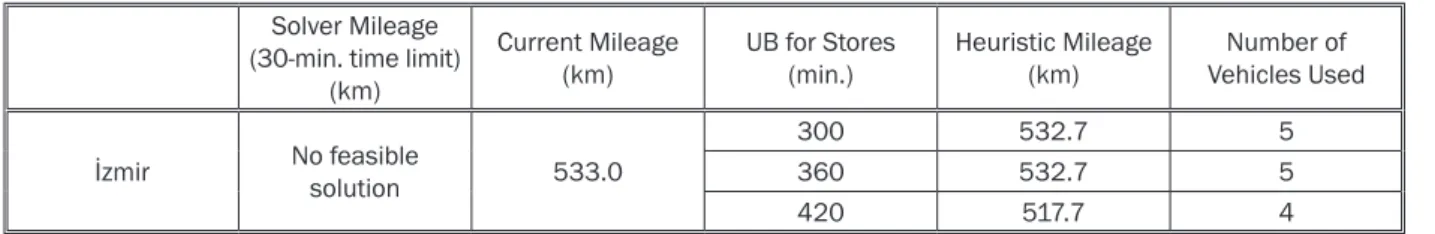
As the company originated from Izmir, a large num-ber of stores are located in this city. Five vehicles cur-rently serve 34 delivery points with a rather efficient total delivery mileage of 533 km, as the 3PL is also very experienced in this city. However, the company management reported that they continuously receive complaints from the stores in Izmir due to late deliver-ies. The hard time windows established for malls were violated as well as the soft ones for stores. Table 3
presents the results for this city.
No feasible solution could be obtained from the solver within the time limit. The best mileage obtained by SSH is 517.7 km, which brings a slight improvement over the current one with one less vehicle. The main advantage of this solution is that the deliveries for the malls can be accomplished within their strict time windows as opposed to the current practice. The soft time windows are violated by at most 2 hours for some stores. However, note that the SSH solution in the first row of Table 3 means it is possible to stay within both hard and soft time limits using the current number of vehicles and covering merely the current total mileage. This result was found to be very remarkable by the
de-cision makers. The vehicle routes in this solution are significantly different from the current ones by the 3PL. Finally, we present the results for Bursa in Table 4, with only 8 delivery points served by two vehicles. The solver yielded an optimal solution for this small in-stance, bringing around a 17% reduction on total mileage with two vehicles, satisfying all time windows without any violation. The heuristic solutions with dif-ferent values of upper bounds all yielded an identical mileage with no violation as well, as the time window constraints are already redundant for this city.
Results for all cities in Turkey were computed in a similar fashion, and optimal solutions were obtained by the solver whenever possible. The reductions in to-tal mileage presented in this section constitute repre-sentative figures for other cities’ results as well. The obtained savings directly translate to reductions in transportation costs, as well as carbon emissions from the vehicles.
5. CONCLUSION
The vehicle routing problem is a combinatorial opti-mization problem that is stimulating to both the scientif-ic community and the practitioners, as it promises sig-nificant reductions in transportation cost of distribution. In our era where one of the main determinants of the cost of products is the transportation cost, the optimi-zation of delivery routes becomes especially important. This study considers a real-life distribution problem of a well-known large perishable food manufacturer in Turkey. The problem is defined as a rich VRP with het-erogeneous fleet, site-dependent and compartmen-talized vehicles, and soft/hard time windows, and a mixed integer programming model for obtaining exact solutions is proposed. Due to the combinatorial struc-ture of the problem, a simplistic heuristic approach for obtaining practical near-optimal solutions is also
Table 3 – Results for Izmir.
Solver Mileage (30-min. time limit)
(km)
Current Mileage
(km) UB for Stores (min.) Heuristic Mileage (km) Vehicles UsedNumber of İzmir No feasible solution 533.0
300 532.7 5
360 532.7 5
420 517.7 4
Table 4 – Results for Bursa.
Solver Mileage (30-min. time limit)
(km)
Current Mileage
(km) UB for Stores (min.) Heuristic Mileage (km) Vehicles UsedNumber of
Bursa 152.2 (optimal) 183.0
300 160.7 2
360 160.7 2
Promet – Traffic&Transportation, Vol. 27, 2015, No. 6, 497-503 503 utilized. The objective is to minimize the cost of
trans-portation while maintaining a high level of customer satisfaction.
The problem is modelled and solved with real data obtained from the company, and very satisfactory re-sults are attained. Cost reduction exceeding 20% can be achieved using the solutions developed for distri-bution. Contacts with the decision makers of the com-pany reveal that the developed heuristic approach is easily applicable. One additional advantage of the heuristic is that it can handle small variations in the current set of constraints. All results were presented to the company, and the current efforts are on imple-mentation.
As a further research topic, some simple improve-ment heuristics may be developed for distribution for obtaining better solutions. These may assist in pro-posing better distribution alternatives to the decision makers. Employing more sophisticated state-of-the-art metaheuristic approaches that provide fast near-opti-mal solutions for the problem may constitute another future research opportunity.
ACKNOWLEDGEMENT
We thank both the company and the logistics pro-vider for their support in this study. We also thank the referees for their constructive comments that im-proved the clarity of the paper.
ANIL İNANLI, B.Eng.
E-mail: [email protected] Politecnico di Milano,
School of Industrial and Information Engineering Piazza Leonardo da Vinci 32, 20133, Milano, İtalya BAŞAK ÜNSAL, B.Eng.
E-mail: [email protected]
Bilkent Üniversitesi, Bilgisayar Mühendisliği Bölümü 06800, Bilkent, Ankara, Türkiye
Dr. DENIZ TÜRSEL ELIIYI Yazışmadan sorumlu yazar E-mail: [email protected]
Yaşar Üniversitesi, Endüstri Mühendisliği Bölümü Selçuk Yaşar Kampüsü, 35100, Bornova, İzmir, Türkiye ÖZET
BIR PASTA VE ŞEKERLEME ZINCIRININ DAĞITIM AĞI IÇIN ROTA OPTIMIZASYONU
Bu çalışmada Türkiye’nin önemli pastacılık zincirlerin-den birinin dağıtım ağı ele alınmıştır. Ülke çapındaki mağaza sayısının hızlı bir şekilde artması ve fabrikanın tek bir nok-tadan dağıtım yapması dolayısıyla şirket dağıtımla ilgili bazı sıkıntılar yaşamaktadır. Bu çalışmanın amacı müşteri mem-nuniyetini yüksek seviyede tutarken nakliye maliyetlerini min-imize etmektir. Bu amaçla Araç Rotalama Problemi (ARP) bu büyük dağıtım ağında tüm şehiriçi dağıtım için çalışılmıştır. Problem, farklı tipte ve kompartmanlı araçlarının yanında mağazaların teslim zamanları için kesin ve kesin olmayan
zaman aralıkları içeren bir zengin ARP olarak tanımlanmak-tadır. Bu NP-zor problem bütün dağıtım ağı için gerçek veri kullanılarak ticari bir çözücü ile denenmiştir. Büyük boyutta-ki örnekler için ise hızlı ve iyi çözümler üreten, karar vericil-er tarafından kolaylıkla kullanılabilecek bir sezgisel yöntem kullanılmıştır.
ANAHTAR SÖZCÜKLER
Araç rotalama problemi; heterojen araç filosu; kompartmanlı araçlar; kesin ve kesin olmayan zaman aralıkları;
REFERENCES
[1] Tarantilis C, Kiranoudis C. A meta-heuristic algorithm for the efficient distribution of perishable foods. J Food Eng. 2001;50(1):1-9.
[2] Gendreau M, Laporte G, Musaraganyi C, Taillard ÉD. A tabu search heuristic for the heterogeneous fleet vehicle routing problem. Comput Oper Res. 1999;26(12):1153-1173.
[3] Ambrosino D, Sciomachen A. A food distribution net-work problem: a case study. IMA J Manage Math. 2007;18(1):33-53.
[4] Doerner KF, Gronalt M, Hartl RF, Kiechle G, Reimann M. Exact and heuristic algorithms for the vehicle rout-ing problem with multiple interdependent time win-dows. Comput Oper Res. 2008;35(9):3034-3048. [5] Ombuki B, Ross BJ, Hanshar F. Multi-objective genetic
algorithms for vehicle routing problem with time win-dows. Appl Intell. 2006;24(1):17-30.
[6] Taner F, Galić A, Carić T. Solving practical vehicle routing problem with time windows using meta-heuristic algorithms. Promet-Traffic & Transportation. 2012;24(4):343-351.
[7] Galić A, Carić T, Fosin J. The case study of implement-ing the delivery optimization system at a fast-movimplement-ing consumer goods distributer. Promet-Traffic & Transpor-tation. 2013;25(6):595-603.
[8] Özdemirel A, Gökgür B, Eliiyi DT. An assignment and routing problem with time windows and capacity restric-tion. Procedia Soc Behav Sci. 2012;54(1):149-158. [9] Dohn A, Rasmussen MS, Larsen J. The vehicle routing
problem with time windows and temporal dependen-cies. Networks. 2011;58(4):273-289.
[10] Pisinger D, Ropke S. A general heuristic for vehicle rout-ing problems. Comput Oper Res. 2007;34(8):2403-2435.
[11] Tarantilis C, Kiranoudis C. Distribution of fresh meat. J Food Eng. 2002;51(1):85–91.
[12] Amorim P, Parragh SN, Sperandio F, Almada-Lobo B. A rich vehicle routing problem dealing with perishable food. TOP. 2014;22(2):489-508.
[13] Osvald A, Stirn LZ. A vehicle routing algorithm for the distribution of fresh vegetables and similar perishable food. J Food Eng. 2008;85(2):285-295.
[14] Hsu CI, Hung SF, Li HC. Vehicle routing problem with time-windows for perishable food delivery. J Food Eng. 2007;80(2):465-475.
[15] Clarke G, Wright JW. Scheduling of Vehicles from a Central Depot to a Number of Delivery Points. Oper Res. 1964;12(4):568-581.