ILP formulation and heuristic method for energy‑aware
application mapping on 3D‑NoCs
Yigitcan Nalci1 · Pinar Kullu2 · Suleyman Tosun1 · Ozcan Ozturk3
Published online: 1 July 2020
© Springer Science+Business Media, LLC, part of Springer Nature 2020
Abstract
The rapid increase in the number of cores on chips forced the designers to invent new communication methods such as Network-on-Chip (NoC) paradigm. Advances in integrated circuit fabrications even allowed three-dimensional NoC (3D-NoC) implementations. 3D-NoCs have more advantages than their 2D counterparts such as lower area, higher throughput, better performance, and less energy consumption. However, they lack the design automation algorithms. An important design prob-lem for a given application is mapping it on a 3D-NoC topology. In this paper, we present an integer linear programming (ILP) formulation and a novel heuristic algo-rithm, called CastNet3D, for application mapping onto mesh-based 3D-NoCs with energy minimization being the objective. The algorithm tries to utilize vertical links for communicating nodes as much as possible. Vertical links are shorter than hori-zontal ones; therefore, they are faster and consume less energy. We compared Cas-tNet3D against ILP in terms of energy consumption and execution time on several benchmarks. Our results show that CastNet3D obtains close to optimum results in much shorter time frames.
Keywords 3D-mesh · ILP · Mapping
1 Introduction
International Technology Roadmap for Semiconductors (ITRS) [1] reported that the number of cores in a single chip will continue to increase in each technology gen-eration resulting in new connection and communication problems among them. The reason for these problems is the physical limitations of the connections, where the * Pinar Kullu
1 Department of Computer Engineering, Hacettepe University, Ankara, Turkey 2 Department of Computer Engineering, Ankara University, Ankara, Turkey 3 Department of Computer Engineering, Bilkent University, Ankara, Turkey
Network-on-Chip (NoC) communication paradigm has been proposed to overcome [2]. More specifically, NoC mimics the traditional network communication mecha-nisms within the same chip.
The advances in integrated circuit (IC) manufacturing in recent years allowed even the production of three-dimensional NoCs (3D-NoCs) [3]. 3D fabrication brings heterogeneous integration, on-chip interconnect length reduction, and modu-lar and scalable design capabilities. 3D-ICs use Through Silicon Vias (TSVs) [4] to extend 2D-NoC layers to the third dimension. When we compare TSVs with horizontal links, they are much shorter; thus, less energy-consuming and faster at transferring data. Therefore, 3D-NoC is a good communication solution for designs including several cores with high communication load among them.
Although 3D-NoCs ease the communication problem for large designs, current design tools do not meet the designers’ needs. Therefore, new automation algo-rithms for 3D-NoC design tools are necessary to have optimized designs in a very short time-to-market period. One of the most important design problems is mapping the applications on 3D mesh topology under constraints with an objective function. A good mapping algorithm determines good solutions with reduced energy con-sumption, delay, communication cost, etc.
The problem of application mapping to cores has been proven to be an NP-plete problem. Therefore, it is not practical to evaluate all possible mapping com-binations for a large number of application tasks. One solution to this mapping problem can be formulating the problem using an integer linear programming (ILP)-based method [5]. However, ILP-(ILP)-based methods take very long CPU times. Thus, it is not applicable to applications with large number of nodes.
Alternative methods against ILP are heuristic and metaheuristic methods [7–14]. Metaheuristics are generally nature-inspired algorithms such as genetic algorithm (GA), particle swarm optimization (PSO), and simulated annealing (SA). However, they do not guarantee the optimum solutions due to their random search natures. A multi-stage PSO is applied in [7] for mapping applications to 3D-NoCs, aiming to improve communication cost under bandwidth constraints. In [8], the authors apply a quantum-behaved PSO algorithm to the mapping problem, which converges faster than other PSO-based methods. The work presented in [9] uses an improved version of ant colony optimization after clustering tasks according to their sizes. In [10], the authors propose a 3D application mapping method based on genetic algo-rithms (GAs). In this study, they tackle the heat and energy consumption of the NoC system at the same time. The heuristic method proposed in [11] views the given 3D mesh architecture as a series of vertically connected 2D meshes. It clusters the nodes based on the number of 3D layers. Then, it maps each cluster to the neighbor layer using 2D mapping. Although all the aforementioned methods obtain very good results in terms of selected parameters, they do not guarantee optimal results.
In this study, we propose an ILP formulation and a novel heuristic algorithm, CastNet3D, for mapping application tasks onto the 3D-NoC-based cores. ILP-based methods obtain optimal solutions, whereas CastNet3D applies similar steps used in CastNet algorithm [6]. Specifically, CastNet maps applications to 2D mesh, while CastNet3D focuses on 3D mesh architecture considering the vertical tunnels. It also tries to map highly communicating tasks close to each other as its 2D predecessor
aiming to minimize the hop count between the communicating tasks. Since the traveling distance of the data is minimized, communication energy consumption will be minimized proportionally. However, CastNet3D differentiates from CastNet algorithm in several decision steps since vertical connections (i.e., Through Silicon Vias - TSVs) possess different energy and performance parameters from horizontal counterparts. Therefore, 3D version of our algorithm tries to utilize TSVs as much as possible to further reduce the total energy consumption.
The main contributions of this paper are:
1. A complete ILP formulation for application mapping to 3D-NoCs, which can be a good reference for further studies on this problem;
2. A new fast heuristic mapping algorithm for 3D-NoCs, which determines optimum or close to optimum results in a very short time;
3. Experimental evaluation for comparing heuristic and ILP methods in terms of energy consumption and CPU execution times.
We compared CastNet3D and ILP-based methods along with their 2D versions in terms of energy consumption and execution times on several benchmarks. Our results show that CastNet3D obtains close to optimum results in a considerably less time frame, proving its applicability and scalability.
We organized the rest of the paper as follow: In the next section, we give the energy model and the problem definition. In Sects. 3 and 4, we present the ILP for-mulations and proposed heuristic method, respectively. We illustrate the experimen-tal results in Sect. 5. Finally, we conclude this paper in Sect. 6.
2 Energy model and problem definition
In this study, our main goal is to minimize the dynamic energy consumption of data communication among the application nodes. In this section, we first give the energy model. We then define the problem this study tackles with.
2.1 Energy model
The dynamic energy consumption for the data communication has two main compo-nents: routers and links. We ignore other energy consuming components due to their negligibly small size [15]. Since the communication volume is directly proportional to dynamic energy consumption, we first define the dynamic energy consumption of a single bit using the following equation as in [6]:
In (1), ERbit and ELbit represent the energy consumed by the switches (i.e., routers)
and links, respectively. We then use the following formula to determine the energy consumption of sending one-bit data from core i to core j:
(1)
In this equation, si,j is the number of routers the bit passes through, di,j,h and di,j,v
represent the horizontal and vertical hop counts (i.e., the number of horizontal and vertical links) between cores i and j, respectively. Since vertical links (TSVs) are shorter than horizontal links, we multiply their energy consumption with a scaling parameter 𝜃 . We selected 𝜃 as 0.2 as previous studies [16].
For 3D mesh networks, the hop distance between two cores i and j is determined by the Manhattan distance using their coordinate values i(xi, yi, zi) and j(xj, yj, zj) as
follows:
2.2 Problem definition
In order to represent the given application as an abstract model, we use Communica-tion Task Graph (CTG) denoted by G(V, E), where each vertex vi∈ V represents a
task (i.e., a node) in the application and each edge ei,j∈ E represents a dependency
between two tasks vi and vj . The amount of data transfers in bits per second between
vi and vj is captured by the weight wi,j for all ei,j . We give an example CTG with eight
nodes and nine edges in Fig. 1.
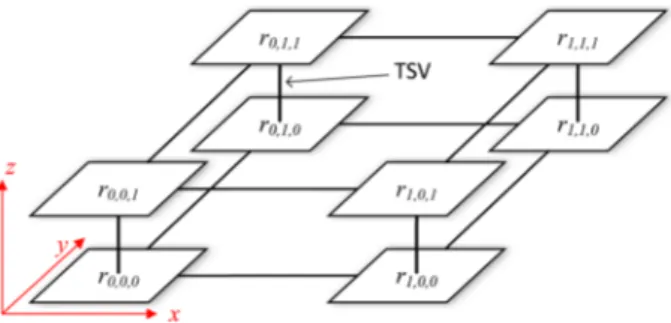
We represent 3D mesh topology with a Topology Graph (TG) denoted by
M(T, P), where each node ti∈ T represents a core in the topology and each edge
pi,j ∈ P represents a communication path from core ti to core tj . Figure 2 shows
an example TG with eight cores connected in a 2 × 2 × 2 3D-NoC fashion. The subscripts of rx,y,z on each router represent the x, y, and z coordinates of a router.
Using the definitions above, the application mapping problem can be formulated as follows:
Given a CTG and a TG that satisfy |V| ≤ |T| , find a one-to-one mapping function
F∶ V → T from CTG to TG such that total dynamic energy consumption of data
communication on designed NoC (i.e., ENoC ) is minimized.
We use following equation to calculate ENoC.
(2)
Ei,jT
bit= (si,j) × ERbit+ di,j,h× ELbit+ di,j,v× 𝜃 × ELbit
(3)
di,j,h= |xi− xj| + |yi− yj|
(4)
di,j,v= |zi− zj|
Fig. 1 An example communica-tion task graph (CTG) taken from [6]
In the next two sections, we present our ILP-based method and heuristic method, respectively.
3 ILP formulations
In an ILP problem, problems are formulated and optimized using linear functions to represent objectives and constraints, whereas the solution variables are restricted to be integers. The 0-1 ILP is a smaller subset of the general ILP problem in which each (solution) variable is restricted to be either 0 or 1. In this paper, we used FICO Xpress Optimization tool [17], a commercial tool, to formulate and solve our ILP problem.
In our ILP formulation, we view the chip area as a 3D grid and assign tasks to tiles within this grid. We represent the dimensions of the grid as Xdim , Ydim , and
Zdim for x, y, and z dimensions, respectively. Since we map each application node to
exactly one router, the number of routers must be greater than or equal to the num-ber of application nodes, n, as given by the following formula:
In our formulation, we define a binary variable 𝛼i,x,y,z . It becomes one if node i is
mapped to router rx,y,z , where (x, y, z) is the coordinates of the router. Otherwise,
𝛼i,x,y,z is zero.
The following formulations guarantee that each node must be mapped to a router and if the number of routers is higher than the application nodes, some of the routers will not have any nodes mapped on it.
(5) ENoC= ∑ eij∈E wij× Evi,vj Tbit (6) |V| = n ≤ Xdim× Ydim× Zdim
(7) Xdim∑−1 x=0 Ydim∑−1 y=0 Z∑dim−1 z=0 𝛼i,x,y,z= 1, ∀i
When the coordinates of the nodes are decided, the next step is to determine the number of hop counts between each communicating nodes, i and j, for all ei,j∈ E .
We define three binary distance variables Xi,j,a , Yi,j,b , and Zi,j,c , where a, b, and c
represent the Manhattan distance in x, y, and z dimensions, respectively. We use the following formulation to determine these distance values:
The next step of our formulation is to calculate the energy consumption of each communicating task. We define Xcost , Ycost , and Zcost variables, each of which
repre-senting the total communication cost for the corresponding dimensions. In our for-mulation, we multiply the communication weights (i.e., wi,j ) of each communicating
task (i.e., ei,j∈ E ) with its hop counts (i.e., a, b, and c) for all dimensions. We give
the communication cost formulations as follows:
Since the total number of routers a data passes through is one greater than the num-ber of hops, we also need to add the total weights of the application to our cost. Therefore, we calculate the total weight Tw using the following expression.
(8) n ∑ i=1 𝛼 i,x,y,z≤1,∀x, y, z (9) Xi,j,a≥ 𝛼i,x
1,y1,z1+ 𝛼j,x2,y2,z2+ 1, ∀i, j.ei,j ∈ E
0 ≤ x1, x2 ≤Xdim, 0 ≤ y1, y2≤Ydim, 0 ≤ z1, z2≤Zdim a= |x1− x2|.
(10)
Yi,j,b≥ 𝛼i,x
1,y1,z1+ 𝛼j,x2,y2,z2+ 1, ∀i, j.ei,j∈ E
0 ≤ x1, x2≤Xdim, 0 ≤ y1, y2≤Ydim, 0 ≤ z1, z2≤Zdim b= |y1− y2|.
(11)
Zi,j,v≥ 𝛼i,x1,y1,z1+ 𝛼j,x2,y2,z2+ 1, ∀i, j.ei,j∈ E
0 ≤ x1, x2≤Xdim, 0 ≤ y1, y2≤Ydim, 0 ≤ z1, z2 ≤Zdim
c= |z1− z2|. (12) Xcost= ∑ ei,j∈E Xdim ∑ a=0 wi,j× a × Xi,j,a (13) Ycost= ∑ ei,j∈E Ydim ∑ b=0 wi,j× b × Yi,j,b (14) Zcost= ∑ ei,j∈E Zdim ∑ c=0 wi,j× c × Zi,j,c
The last step of our formulation is to calculate the total energy consumption. We multiply the energy consumption of a single bit on routers and links with the com-munication cost to determine the total energy consumption as shown in Expression (16). On the right hand side of this equation, the first part gives us the energy con-sumption of the routers while the second part is for calculating the energy consumed on links. In this equation, er represents the energy consumption of a single bit on a
router. Since the number of routers is one greater than links visited by a bit, we add
Tw in the parenthesis when multiplying the dimensional costs with er . In Expression
(16), el represents the energy consumption of a bit on links. Since the energy
con-sumption of TSVs is less, we multiply it with the scaling factor 𝜃 . We will discuss how er , el , and 𝜃 values are selected in our experiments in Sect. 5.
Our objective function for our ILP problem is to minimize ENoC.
4 Heuristic algorithm: CastNet3D
CastNet3D algorithm is an iterative constructive mapping algorithm, inspired from and extension to CastNet algorithm [6], which maps applications to 2D-NoCs. It has two main decisions at each mapping step: task and core selections. Core selection has two stages: initial core selection and the remaining core selection. Task selection also has two stages: initial task selection and the remaining task selection. Based on the communication cost of task in question hand and the mapped tasks, the algo-rithm decides the best suitable core to map the task. Since vertical and horizontal connections have different performance and energy parameters, 2D version of Cast-Net cannot be applied to task selection steps. Furthermore, 3D-NoC has much more symmetrical cores when compared to 2D version, which adds extra computational cost to the algorithm. Thus, we did not apply the same core selection mechanism used in CastNet to CastNet3D, in order to minimize the execution times.
(15)
Tw= ∑
ei,j∈E
wi,j
(16)
ENoC= er× (Xcost+ Ycost+ Zcost+ Tw) + el× (Xcost+ Ycost+ 𝜃Zcost).
The pseudo-code of the CastNet3D algorithm is given in Algorithm 1. The algo-rithm first selects the initial cores for different mappings (line 2). This is similar to selecting cores from different symmetry groups as presented in [18]. Then, it deter-mines the links between all cores (line 3). It then selects the initial task by compar-ing the average communication costs (line 7) of all tasks and maps it to the initial core (lines 8–10). It then selects each of the remaining nodes based on the commu-nication costs and maps it to the best suitable core (lines 11–17). For selecting the suitable core, the core on a different layer will have a higher chance since the energy consumption will be reduced as a result of TSV utilization. The algorithm returns |C| mapping results, which is equal to the number of total initial cores selected. At the end, it evaluates the total communication cost Comm and ENoC of each mapping
and returns the best one (lines 23–26). In the following paragraphs, we explain the algorithm’s main decision steps in detail.
4.1 Initial core selection
The first step of the CastNet3D algorithm is selecting the initial core. At the begin-ning, all of the cores may be seen as candidates for the initial core. However, there are only a number of cores that can affect the rest of the mapping procedure since
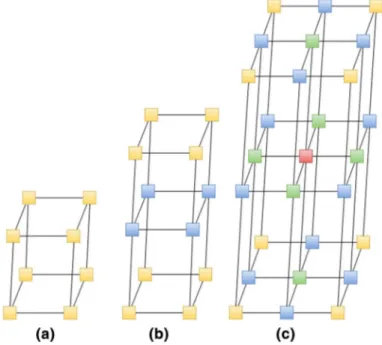
some cores are symmetric and have the same number of links. In Fig. 3, we show the cores that have the same number of links with the same color. In a 3D mesh, a router can have ports ranging from three (corner routers) to six (routers in the middle of three axes). In Fig. 3a, all the routers have three ports to their neighbors whereas the topology in Fig. 3b has three and four ported routers. The topology in Fig. 3c has all possible routers with three, four, five, and six ports. In CastNet3D, we select one initial core from each group of routers as the initial core. Therefore, we can have at most |C| mapping results when we have |C| group of routers in the topology. For example, for the topologies in Fig. 3, we will have one, two, and four different mapping results, respectively. The reason for having a different starting point for our mapping is to increase the probability of having optimum result since each initial core selection may affect the rest of the mappings and obtain different results. 4.2 Initial task selection
The second step of the CastNet3D algorithm is selecting the initial task to map on the initial core. We use task priorities for this selection procedure. We assign the priority Pi of task i based on its total communication cost ( TCCi ) with its
neigh-bors. Higher the TCC of a task has, higher its priority is. If there is a tie among tasks based on TCCi values, the task with the greatest average communication cost is
selected, which is represented by Ai . If both of these criteria do not break the tie, the
initial task is selected randomly. We use Expressions (17) and (18) to calculate TCCi
Fig. 3 a 2 × 2 × 2 , b 2 × 2 × 3 , and c 3 × 3 × 3 topologies. Cores that have the same number of links have the same color
and Ai values of tasks, respectively. In Expression (18), dG(vi) represents the number
of neighbors of vi (i.e. the number of edges connected to vi).
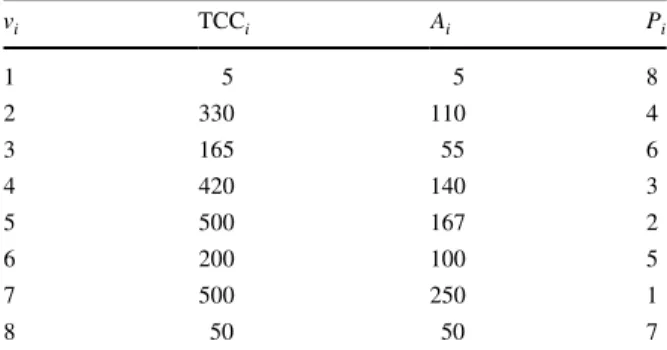
Table 1 lists TCCi , Ai , and the priority values ( Pi ) of CTG given in Fig. 1. As shown
in this table, v5 and v7 have the highest total communications with their neighbors,
which are TCC5 = TCC7 = 500. The average communication costs of v5 and v7 are
A5 = 167 and A7 = 257, respectively. As a result, v7 is selected as our first task to
map onto the initial core of 3D-NoC. 4.3 Selecting remaining tasks and cores
After mapping the first task to the initial core, the algorithm maps the remaining tasks one by one onto 3D-NoC. The algorithm selects the next task by calculat-ing each unmapped task’s total communication cost with the mapped ones. In this step, we have two choices. If there is an empty core on a different layer (i.e., on the z-axis), we select the task with the highest communication cost to map on this core. Otherwise, we select the task with lowest communication cost and map to a core on the same layer. This decision step is very important to utilize the TSVs as much as possible. The difference between 2D mapping and 3D mapping comes from this important design decision. By applying this criterion, we map highly com-municating nodes close to each other on different layers to minimize the energy consumption.
After mapping all the tasks to cores, we calculate the total energy consumption. We apply the same algorithm step for the remaining initial core selections and com-pare them. Finally, we pick the mapping with the minimum energy consumption value as our solution.
(17) TCCi= ∑ ei,j∈E wi,j (18) Ai= ∑ ei,j∈E wi,j∕dG(vi)
Table 1 Priority assignment for
the CTG given in Fig. 1 vi TCCi Ai Pi
1 5 5 8 2 330 110 4 3 165 55 6 4 420 140 3 5 500 167 2 6 200 100 5 7 500 250 1 8 50 50 7
4.4 Complexity of CastNet3D
Let n and e be the number of nodes and edges of an application graph, respectively. Suppose we have c cores in the 3D mesh. In Algorithm 1, for loop will iterate fixed number of times, which is at most four times. Therefore, the time complexity is dominated by the while loop, which iterates n times. While node_select() step takes only e times, core_selects takes e × c times. Therefore, the total time complexity of CastNet3D is O(n × e × c) in Big O notation.
5 Experimental results
5.1 Setup
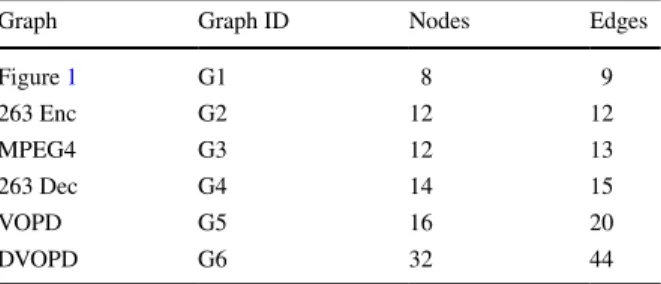
In order to test the effectiveness of the proposed algorithm, we conducted several experiments on real benchmarks and a randomly generated graph. Specifically, we selected five video applications; namely, Video Object Plane Decoder (VOPD) and MPEG4 decoder from [19], 263 Decoder (263 Dec) and 263 Encoder (263 Enc) from [20] and Dual Video Object Plan Decoder (DVOPD) from [21]. In Table 2, we list these benchmarks and randomly generated CTG in Fig. 1 by giving their num-ber of application nodes and edges. We selected the benchmarks with an increasing number of nodes to see how our algorithms scale with the varying number of appli-cation nodes in terms of determining optimum value and CPU execution times.
We implemented ILP using a commercially available tool [17] and CastNet3D with C++. In our experiments, we compared CastNet3D against ILP in terms of energy consumption and CPU execution times.
We used the power/energy model presented in [18] to estimate the energy con-sumption of each mapping. In this model, energy concon-sumption metric is defined based on the consumed energy of one bit traveling from source to destination core. In this metric, the energy consumption on the switches, buffers, and inter-connection wires are included. The energy consumed by the cores is not included in this calculation since the main goal is minimizing the energy consumed on the network. In this model, the energy consumption of the input port of the router is estimated as 328 nJ/Mb/s and the energy consumption of the output port is given as 65.5 nJ/Mb/s. Therefore, the total energy consumption of a single bit
Table 2 Graph characteristics Graph Graph ID Nodes Edges
Figure 1 G1 8 9 263 Enc G2 12 12 MPEG4 G3 12 13 263 Dec G4 14 15 VOPD G5 16 20 DVOPD G6 32 44
on a router is addition of input and output port energy values, which is 393.5 nJ/Mb/s (i.e., the router energy parameter in Equation (16) is er= 393.5 ). The
energy consumption of the physical link is estimated as 79.6 nJ/Mb/s/mm. In the calculations, we assumed the link length between horizontal neighbor cores as 3 mm as suggested in the literature [18]. Therefore, the total energy consumed on a horizontal link is 238.8 nJ/Mb/s (i.e., the link energy parameter in Equation (16) is el= 238.8)). Additionally, we set the TSV scaling factor 𝜃 to 0.2, which
is proportional to the horizontal link lengths over the vertical link lengths in the contemporary 3D designs.
5.2 Energy comparison
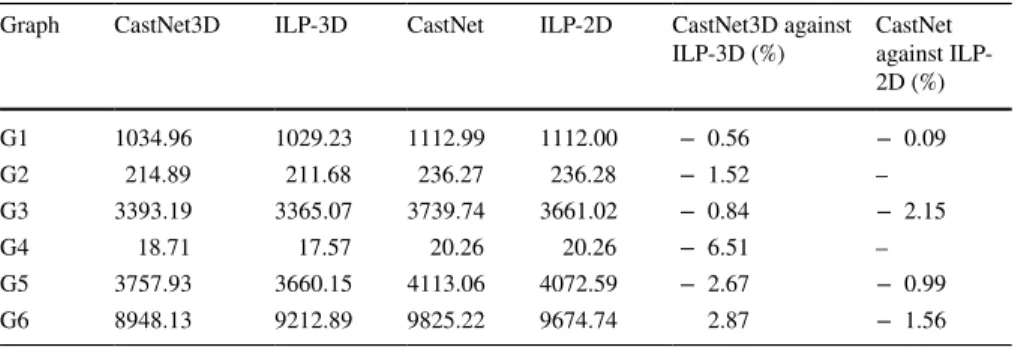
We give the energy values of the mappings obtained by three methods in Table 3, for one layer (2D) and two layer (3D) topologies. In this table, columns two to five show the total energy consumption ( ENoC ) of the mappings generated by
CastNet3D, ILP-3D, CastNet2D, and ILP-2D, respectively. We limit the execu-tion time of ILP method to 8 hours (28800 s) since it may take days even weeks to return the optimum result for the applications with large number of nodes. Therefore, we obtain the best result determined by the ILP solver in this time limit. Thus, a time out (t.o.) for a graph entry indicates that the result may not be the optimum one. The last two columns of Table 3 shows how close the results obtained by CastNet3D and CastNet2D against ILP-3D and ILP-2D, respectively. The negative numbers mean ILP obtains better results while positive number and zero means CastNet3D and 2D obtain better or the same results against ILP, respectively. While CastNet3D obtains very close to optimum results for the first five benchmarks except for G4, it even determines better results than ILP for G6 since ILP has a time out for this graph. 2D version of CastNet3D even deter-mines optimum results most of time. The results in this table also suggest that CastNet3D and its 2D version can be used for the applications with large number of nodes as well. On the other hand, ILP is suitable for only small sized applica-tions since it takes considerably higher execution times to determine the optimum results when the number of application nodes is very high.
Table 3 Energy consumption ( 𝜇 J) values
Graph CastNet3D ILP-3D CastNet ILP-2D CastNet3D against
ILP-3D (%) CastNet against ILP-2D (%) G1 1034.96 1029.23 1112.99 1112.00 − 0.56 − 0.09 G2 214.89 211.68 236.27 236.28 − 1.52 – G3 3393.19 3365.07 3739.74 3661.02 − 0.84 − 2.15 G4 18.71 17.57 20.26 20.26 − 6.51 – G5 3757.93 3660.15 4113.06 4072.59 − 2.67 − 0.99 G6 8948.13 9212.89 9825.22 9674.74 2.87 − 1.56
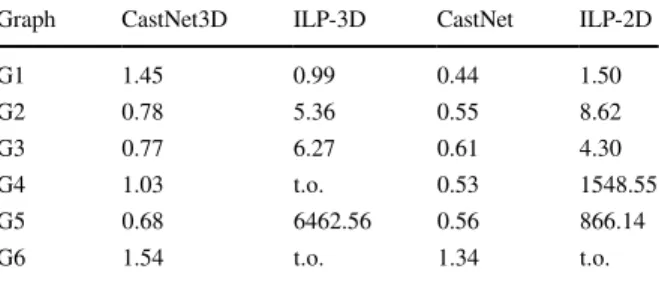
5.3 CPU time comparison
Another important comparison criterion for these algorithms is their CPU times, which are the execution times of algorithms to determine the results. In our experiments, we used a laptop computer with Intel i7-7000 4-core CPU running at 3.60 GHz speed and 16 GB main memory. In Table 4, we list the CPU execu-tion times (in seconds) obtained by running the aforemenexecu-tioned four algorithms once. The table shows that CastNet3D and its 2D version determine the results in seconds while ILP takes much longer for most of the benchmarks. It even uses the whole 8 hour limit and cannot converge to an optimum solution in certain cases. The CPU execution times show that CastNet3D is more effective to determine the optimum or close to optimum results in a short time.
6 Conclusion
In this paper, we presented a new heuristic algorithm (CastNet3D) for applica-tion mapping problem for mesh-based 3D-NoC architectures. We also presented an ILP formulation for the stated problem. The objective of the algorithms is to minimize the energy consumption of the application. We compared our heuris-tic algorithm with the ILP-based method using several benchmarks on 2D and 3D-NoCs in terms of energy consumption and CPU times. The results show that CastNet3D and its 2D version obtain the optimum or close to optimum results within seconds. However, there are also some improvement opportunities ema-nating from the limitations and assumptions of this work. For example, the band-width limitations and routing algorithm can be included in the mapping phase to have better traffic control. We omitted them in this study since it increases the complexity of the problem tremendously. They can be tackled in a study where the focus is more on optimizing the network traffic.
Acknowledgements This work was supported by The Scientific and Technological Research Council of Turkey (TUBITAK) under Grant No. 117E130.
Table 4 CPU execution times (s). t.o. means that ILP is stopped after 8 hours
Graph CastNet3D ILP-3D CastNet ILP-2D
G1 1.45 0.99 0.44 1.50 G2 0.78 5.36 0.55 8.62 G3 0.77 6.27 0.61 4.30 G4 1.03 t.o. 0.53 1548.55 G5 0.68 6462.56 0.56 866.14 G6 1.54 t.o. 1.34 t.o.
References
1. International Technology Roadmap for Semiconductors (ITRS) Report 2015, http://www.itrs2 .net/ 2. Dally WJ, Towles B (2001) Route packets, not wires: on-chip inteconnection networks. In:
Proceed-ings of the 38th Annual Design Automation Conference, pp 684–689
3. Sheibanyrad A, Pétrot F, Jantsch A (2011) 3D integration for NoC-based SoC architectures. Springer, Berlin
4. Van der Plas G et al (2011) Design issues and considerations for low-cost 3-D TSV IC technology. IEEE J Solid-State Circ 46(1):293–307
5. Tosun S, Ozturk O, Ozen M (2009, October) An ILP formulation for application mapping onto net-work-on-chips. In: 2009 International Conference on Application of Information and Communica-tion Technologies, pp 1–5. IEEE
6. Tosun S (2011) New heuristic algorithms for energy aware application mapping and routing on mesh-based NoCs. J Syst Architect 57(1):69–78
7. Sahu PK, Shah T, Manna K, Chattopadhyay S (2014) Application mapping onto mesh-based net-work-on-chip using discrete particle swarm optimization. IEEE Trans Very Large Scale Integr Syst 22(2):300–312
8. Huang C, Zhang D, Song G (2017) A novel mapping algorithm for three-dimensional network on chip based on quantum-behaved particle swarm optimization. Front Comput Sci 11(4):622–631 9. Fang J, Yu T, Wei Z (2020) Improved ant colony algorithm based on task scale in network on chip
(NoC) mapping. Electronics 9(1):6
10. Fen G, Gui F, Shuang Y, Ning W (2013) Power-and thermal-aware mapping for 3D network-on-chip. Inf Technol J 12(23):7297–7304
11. Dageleh MZ, Jamali MAJ (2018) V-CastNet3D: a novel clustering-based mapping in 3-D network on chip. Nano Commun Netw 18:51–61
12. Wang J, Li L, Pan H, He S, Zhang R (2011) Latency-aware mapping for 3D NoC using rank-based multi-objective genetic algorithm. In: 2011 9th IEEE International Conference on ASIC, pp 413–416
13. Elmiligi H, Gebali F, El-Kharashi MW (2014) Power-aware mapping for 3D-NoC designs using genetic algorithms. Procedia Comput Sci 34:538–543
14. Manna K, Swami S, Chattopadhyay S, Sengupta I (2016) Integrated through-silicon via place-ment and application mapping for 3D mesh-based NoC design. ACM Trans Embedd Comput Syst 16(1):24
15. Hu J, Marculescu R (2003) Exploiting the routing flexibility for energy/performance aware map-ping of regular NoC architectures. In: 2003 Design, Automation and Test in Europe Conference and Exhibition, pp 688–693
16. Tosun S, Ajabshir VB (2018) Energy-aware partitioning of fault-tolerant irregular topologies for 3D network-on-chips. J Supercomput 74(9):4842–4863
17. https ://www.fico.com/en/produ cts/fico-xpres s-optim izati on
18. Tosun S, Ozturk O, Ozkan E, Ozen M (2015) Application mapping algorithms for mesh-based net-work-on-chip architectures. J Supercomput 71(3):995–1017
19. Janidarmian M, Khademzadeh A, Tavanpour M (2009) Onyx: a new heuristic bandwidth-con-strained mapping of cores onto tile-based Network on Chip. IEICE Electron Express 6(1):1–7 20. Srinivasan K, Chatha KS, Konjevod G (2006) Linear-programming-based techniques for synthesis
of network-on-chip architectures. IEEE Trans Very Large Scale Integr Syst 14(4):407–420 21. Qian Z, Bogdan P, Tsui CY, Marculescu R (2016) Performance evaluation of noc-based
multi-core systems: From traffic analysis to noc latency modeling. ACM Trans Des Autom Electron Syst 21(3):52
Publisher’s Note Springer Nature remains neutral with regard to jurisdictional claims in published maps and institutional affiliations.
![Fig. 1 An example communica- communica-tion task graph (CTG) taken from [6]](https://thumb-eu.123doks.com/thumbv2/9libnet/5790134.117774/4.659.411.582.744.912/fig-example-communica-communica-tion-task-graph-taken.webp)