DOI 10.1007/s11135-014-0116-6
Environmental sustainability and pressure groups
Taner Güney
Published online: 12 October 2014
© Springer Science+Business Media Dordrecht 2014
Abstract This study puts forth the importance of effects of pressure groups on
environ-mental sustainability. A comprehensive literature review has revealed that there are just case studies in theoretical modelling that attempt to analyze the relation between special interest groups and environmental sustainability. When special interest groups act in an organized manner, they turn into pressure groups. For this reason, pressure groups should have a neg-ative impact on environmental sustainability. According to the results of the first empirical analysis in this field, which was based on the data from 127 countries, there is a negative cor-relation between the level of environmental sustainability and pressure groups. The negative correlation between the pressure groups and environmental sustainability reaches the most significant level in developed countries. Therefore, we can conclude that as the number of pressure groups increases, the level of environmental sustainability decreases. Consequently, the implementation of policies which are created and applied to raise the level of welfare of today’s and future generations depend on developed countries which work without bowing to pressure groups.
Keywords Environmental sustainability · Pressure groups · Economic growth · Heteroscedasticity
JEL Classification Q56· D72 · O40 · C40
1 Introduction
According to political scientists, in democratic societies, an interest group is an unorganised group of individuals united in the pursuit of a particular common cause, working to derive direct material benefits or purposive benefits. Pressure groups are, in contrast, organised
T. Güney (
B
)Department of Economics, The Faculty of Economics and Administrative Sciences, Karamanoglu Mehmetbey University, P.O.Box 70100, Karaman, Turkey
interest groups seeking to influence the decisions made by all three (legislative, executive, and judicial) branches of government regarding their particular concerns and priorities without offering candidates in elections or seeking to gain political power. Thus, if an interest group decides to act in an organised fashion for the protection of its interests, it turns into a pressure group. Organised interest groups, or pressure groups, attempt to influence political decision-making or the decision itself to promote and protect their interests, which are determined as the sum of the utility functions of each individual in those groups. There are two important tools used by pressure groups in this direction: lobbying activities and political parties. Pressure groups attempt to manipulate political parties for their own interests using a variety of secret and official methods. In addition, pressure groups may also organise lobbying activities that will work for the protection of their own interests.
Companies and trade unions that are the most effective type of interest groups and that operate in the real sector are experts on the activities of production that would generate income. Some of these companies may want to have monopoly power. These companies compete against each other to achieve these rights through lobbying to protect themselves from competition. In this case, the highest-bidding company will most likely obtain monopoly power. As a result, interest groups will always gladly pay the price that they believe is equal to the rent they would acquire in the event of enactment of the laws that would provide them with privileges. In general, these payments may be in the forms of bribery, votes, cash payments to the governing party fund, submissions of persuasive information, campaign financing and so on.
Horgos and Zimmermann(2009), in a study in which they tested the relation between interest groups and economic growth and inflation for Germany’s economy, determined that lobbying activities conducted by interest groups caused an increase in the rate of inflation while slowing down economic growth. There is a relation between the increasing number of interest groups and economic variables such as economic growth, investment, capital accu-mulation, stock performance, and price volatility, as well as lobbying activities.Coates et al. (2011), in a study in which they examined the relation between interest groups and economic growth using data from 87 countries, discovered that economic growth slowed down, capital accumulation decreased and productivity levels declined as a result of increasing numbers of interest groups. In contrast, the relation between economic growth and the number of interest groups has not been revealed clearly in the literature. The same situation also applies to investments.1
Based on all of these explanations, the objective of this study is to examine the relation between interest groups and environmental sustainability, which, in the literature, has only been examined with the help of theoretical modelling, using data of 127 countries and pressure groups that also cover interest groups. According to the findings of the analysis, the level of environmental sustainability decreases as the number of pressure groups increases. According to the results of the analysis for various country groups, developed countries with high energy-consuming production and OECD member countries have the most negative effect on environmental sustainability, whereas pressure groups in the group of developing countries have the least negative effect on environmental sustainability.
This study is organized as follows. Following the introduction, the second chapter includes relation between interest groups and environmental sustainability. The third chapter describes the variables, data set, and estimation method chosen from the relevant literature in accordance with the objective of the study. The results are interpreted in the fourth chapter, which provides
1 The following studies can be examined for these issues:Shapiro(1971),Choi(1983),Landau(1985),Knack
the estimation results of the effect of pressure groups on environmental sustainability. The fifth chapter concludes.
2 The relation between interest groups and environmental sustainability
Companies affect economic variables such as economic growth and investment, interest groups and organisations such as trade unions, professional chambers, and associations that are established by individuals coming together for a variety of purposes. Thus, organised interest groups have a direct effect on production and consumption decisions as well as envi-ronmental sustainability. The impact of economic activities on envienvi-ronmental sustainability has been revealed by studies on this issue.2 Grossman and Krueger(1993) examined the relation between these variables based on whether economic growth was harmful for the environment. According to the study findings, there is an inverted U relation between eco-nomic growth and environmental health. In short, pollution and radioactive pollution reaches the worst level at the highest level of economic growth in countries with a low per capita income. This relation usually is called an Environmental Kuznets Curve (EKC) in the liter-ature. However, studies suggest that an EKC is not applicable to every country (Stern and Common 2001).
Sustainable development is closely associated with environmental sustainability. Sustain-able development can be defined in various ways. The World Commission on Environment and Development, also known as the Brundtland Commission, defines sustainable develop-ment as the ability to meet today’s needs without compromising the level of production that future generations will need to meet their needs (World Commission1987, p. 89). Accord-ing to this definition, sustainable development is closely associated with economic growth, social equity, and environmental equality. According to the commission, economic growth is a process that leads to large problems in terms of environmental degradation and poverty that need to be solved (Grossman and Krueger 1993). However, the world population, which at the beginning of 2010 was above six billion, is expected to reach 11 billion by 2030. It is normal that this demographic pressure also causes an increase in economic activities. The demand for resources that will increase due to increased economic activities will also lead to increased environmental stress. Therefore, the issue of environmental sustainability is also an important stimulus in globalisation and is shaping international trade. For example, according to some experts, multinational companies in industrialised societies use free trade as a tool to meet the growing demand due to the increasing world population and to export the cost of production to developing countries. Because the nature of the world’s fossil fuels, which will run out, and renewable energy sources is known, environmental sustainability becomes a very sensitive issue if the main activities of companies are used as a base.
According to the “pollution haven hypothesis”, which supports this view and which is quite popular in terms of the environmental point of view, open markets, trade liberalisation, increased foreign direct investments and multinational corporations cause an increase in the number of contaminated industries by encouraging the export of low technologies to devel-oping countries.3Thus, a type of decline race regarding environmental standards has begun. According to the “pollution halo hypothesis”, which antagonises this view, multinational corporations that encourage trade liberalisation or foreign direct investment help to increase environmental standards around the world because these companies export efficient
technolo-2 For a review, seeEkins(1999) andXepapadeas(2005).
gies and re-establish management approaches.4The common point of these two hypotheses is that economic activities and environmental sustainability are closely associated.
Pressure groups, which are one of the major players directing economic activities with their production decisions, also have an effect on environmental sustainability. There are studies in the literature that examine this effect of interest groups with the help of theoretical modelling.Leidy and Hoekman(1994), which is one of those studies, analysed the behaviour of competing companies that import goods that are harmful to the environment and companies that import goods that are not harmful to the environment in an economy in which the implementation of laws for protecting the environment are planned. Accordingly, interest groups, formed by companies that import goods that are harmful to the environment, put pressure on policy-makers to prevent restrictions of goods polluting the environment because the restriction of these goods becomes a means that prevents free trade. The strengthening of interest groups is a process that will naturally facilitate the entry of goods that are harmful to the environment into the country.
In addition,Schleich(1999), in a study in which he examined the relation between envi-ronmental quality and trade policy, determined that envienvi-ronmental quality would decline because of lobbying activities of industries producing goods harmful to the environment in a situation where marginal environmental costs did not decrease excessively. Similarly, Schle-ich and Orden(2000), in a study in which they examined the relation between protectionism and environmental quality, indicated that environmental quality would decline in an economy supporting industry protectionism due to lobbying activities of manufacturers.
The above studies suggest a negative relation between environmental quality and interest groups. Accordingly, as the number of interest groups and pressure groups increases, the political influence of these groups on policy-makers will also increase; as a result, environ-mental sustainability will be affected negatively. This effect will be perceived more strongly in countries with relatively high energy-consuming production.
3 Data and method
The following multivariate model is developed to test the relation between pressure groups and environmental sustainability:
E S Ii = β0+ β1pgi+ β2gr owthi+ β3populi+ β4ur bani
+ β5pv + β6vai+ β7f or esti+ εi (1)
where i represents the i-th country in the model,εirepresents the error term of the i-th country. A decision regarding the launch of projects necessary to protect and improve environmen-tal sustainability through objective policies was taken at the Environment and Development Summit held in Rio de Janeiro, the capital of Brazil, in 1992. One of the challenging studies in this regard is the preparation of the Environmental Sustainability Index (ESI). This index is prepared jointly by the World Economic Forum, Yale University, and Columbia University. The index consists of 22 indicators calculated using the data of 67 sub-variables. These 22 indicators represent values of a basic structure consisting of the following five variables: quality of the environmental system, stress level of this system, sensitivity of the human population to environmental degradation, level of social and institutional capacity against environmental stress, and global sweeping (Global Leaders2001:9). The ESI takes values
4 The following studies can be utilised in this regard:Gentry(1998),Dowell et al.(2000), andEskeland and
between 0 and 100. As the value gets closer to 100, the level of environmental sustainability rises, and as the value gets closer to 0, the level of environmental sustainability declines. The ESI was prepared for 2000, 2001, 2002 and 2005. Data for the year 2005 were used in this study because they were the most comprehensive data. Data were compiled from the Global Leaders for Tomorrow Environmental Task Force published by the WEF. Data for the year 2005 were also used for the independent variables in the model because the ESI also used 2005 data.
Six more independent variables as well as the pressure groups (pg) variable were used in the model. Data on democracy (va) and political stability (pv) were collected from the Political Risk Services International Country Risk Guide (PRS), and data on economic growth (growth), population growth (popul), urbanisation (urban), and forested area (forest) were collected from the World Bank (WB). The variables used in our analysis were selected according to the usefulness of the data, the main hypothesis, and the relevant studies in the literature. The variables are introduced and their expected signs are discussed below.
Data on the pressure groups variables were collected from the “World Factbook” prepared by the Central Intelligence Agency (CIA). Pressure groups in the World Factbook consist of business, political, social or religious groups with political pressure power but whose leaders do not participate in political elections. Data from the World Factbook, which excludes international organisations from pressure groups, were counted and used for each country. According to the figures in the database, business and professional organisations predominate in almost every country and the other groups are in the minority. pgs’ are expected to reduce the level of environmental sustainability. Therefore, the coefficient sign of the variable pg is expected to be negative.
The variable pv consists of a combination of variables of government stability, internal conflict, external conflict and ethnic tension. The level of environmental sustainability is expected to increase in countries with less conflicts, low ethnic tensions, and governmental stability. The coefficient sign of the variable pv is expected to be positive because an increase in the value of this variable reflects an improvement in this direction.
The variable va indicates the level of influence of the country’s military structure on political decision-makers and the level of the country’s democratic accountability and trans-parency. The level of environmental sustainability is expected to increase in countries with a high level of democracy, accountability, and transparency, as well as in countries where the military structure is unable to influence the political decision-making process. The coef-ficient sign of the variable va is expected to be positive because an increase in the value of this variable reflects an improvement in this direction. Urbanisation (urban) representing the number of people living in cities is considered an indicator of social welfare in the country as well as an indicator of the country’s balanced and planned urbanisation. Therefore, the variable urban is expected to increase the level of environmental sustainability. The expected coefficient sign is positive.
Because increased economic growth means increased pollution from production, the vari-able growth is expected to reduce the level of environmental sustainability. Therefore, the coefficient sign of the variable growth is expected to be negative. Environmental sustain-ability is expected to decline due to population growth. Therefore, the coefficient sign of the variable popul is expected to be negative. Growth of forested areas means an increase in environmental sustainability. Therefore, the coefficient sign of the variable forest is expected to be positive.
This study uses OLS (Ordinary Least Squares) and WLS (Weighted Least Squares) estima-tion techniques for data of 127 countries for the year 2005. The problem of heteroscedasticity may occur if the data estimation is performed with cross-sectional data. In this case, an
appro-priate weighting factor was used and the variables were re-scaled using that weight factor and re-estimated with the WLS technique. The estimated results were obtained in the analysis using all of the variables.
4 Analysis and results
In this section of the study, the first (1) model and five sub-models (all countries, developed countries, developing countries, EU countries, G20 countries, and OECD countries) were estimated with data of 127 countries for the year 2005, and the estimation results are reported in the tables in the following sections. The tables also include the estimation technique used and the results of the Breusch–Pagan test for the changing-variance problem. The following countries for which 2005 data were available are considered in this study: OECD member countries, EU member countries and G20 member countries. A distinction between developed and developing countries was made based on the World Bank classification. The estimation results are shown below starting with the group of all countries.
4.1 Pressure groups and ESI: all countries
Table1shows the estimation results obtained for all countries. According to the table, the indicator of the variable pg for the main model (column 1) and in the 5 columns is negative and
Table 1 Multiple regression analysis results: all countries
Dependent variable: ESI
1 2 3 4 5 6 pg −0.5609 −0.5653 −0.5280 −0.5037 −0.6090 −0.5101 (0.0365) (0.0689) (0.0961) (0.0648) (0.0184) (0.0613) growth −0.1517 −0.3376 −0.0687 (0.0991) (0.0065) (0.4341) popul −0.3599 −1.7520 (0.4739) (0.0029) urban 0.0951 0.1346 (0.0209) (0.0021) forest 0.1112 0.1126 0.1059 (0.0008) (0.0051) (0.0020) pv 12.091 17.076 17.870 (0.0711) (0.0311) (0.0216) va 9.5561 14.748 13.322 (0.0008) (0.0000) (0.0000) constant 29.733 52.630 51.309 46.751 30.246 27.696 (0.0000) (0.0000) (0.0000) (0.0000) (0.0000) (0.0000) Adj. R2 0.40 0.02 0.13 0.21 0.30 0.36 Number of observations 106 107 106 106 107 106 Breusch–Pagan statistics 0.29 0.92 0.45 0.12 0.20 0.23
White heteroskedasticity consistent estimator of the coefficient covariances p values are in parentheses
statistically significant as expected. Accordingly, as the number of pressure groups increases, environmental sustainability decreases for all countries. According to the estimation results, there is a negative relation between population growth and environmental sustainability and a negative and statistically significant relation between economic growth and environmental sustainability.
As expected, there is a positive and statistically significant relation between the variables of increased forest areas, urbanisation, environmental sustainability, political stability and democracy. The variable pressure groups alone explains 2 % of environmental sustainability for all countries. The economic variables, growth, forest and pg in column 3, the social variables, popul, urban and pg in column 4 and the political variables, bv, va and pg in column 5 have received their expected signs and are statistically significant. In column 6, which has been designed to observe the combined effect of the political and economic variables on environmental sustainability, all variables have received their expected signs and, except for the variable growth, are statistically significant.
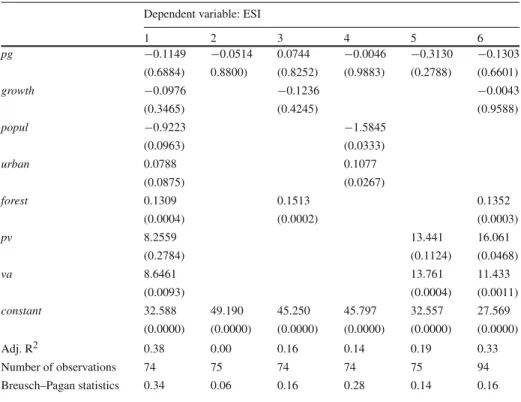
4.2 Pressure groups and ESI: developing countries
Table2shows the estimation results obtained for developing countries. According to the table, although pressure groups have a negative effect on environmental sustainability in developing countries, this effect is not statistically significant. In addition, regarding economic growth, pressure groups did not yield a statistically significant result although they have received the
Table 2 Multiple regression analysis results: developing countries
Dependent variable: ESI
1 2 3 4 5 6 pg −0.1149 −0.0514 0.0744 −0.0046 −0.3130 −0.1303 (0.6884) 0.8800) (0.8252) (0.9883) (0.2788) (0.6601) growth −0.0976 −0.1236 −0.0043 (0.3465) (0.4245) (0.9588) popul −0.9223 −1.5845 (0.0963) (0.0333) urban 0.0788 0.1077 (0.0875) (0.0267) forest 0.1309 0.1513 0.1352 (0.0004) (0.0002) (0.0003) pv 8.2559 13.441 16.061 (0.2784) (0.1124) (0.0468) va 8.6461 13.761 11.433 (0.0093) (0.0004) (0.0011) constant 32.588 49.190 45.250 45.797 32.557 27.569 (0.0000) (0.0000) (0.0000) (0.0000) (0.0000) (0.0000) Adj. R2 0.38 0.00 0.16 0.14 0.19 0.33 Number of observations 74 75 74 74 75 94 Breusch–Pagan statistics 0.34 0.06 0.16 0.28 0.14 0.16
White heteroskedasticity consistent estimator of the coefficient covariances p values are in parentheses
Table 3 Multiple regression analysis results: G20 countries
Dependent variable: ESI
1 2 3 4 5 6 pg −1.0250 −0.9190 −0.7137 −1.3166 −0.7532 −0.6079 (0.0438) (0.0650) (0.2065) (0.0028) (0.0894) (0.2671) growth −0.6481 (0.4128) popul 2.5472 −0.3679 (0.1816) (0.8775) urban 0.1822 0.2526 (0.0987) (0.0382) forest 0.1547 0.1375 0.1496 (0.0320) (0.1216) (0.0449) pv 34.820 40.328 35.433 (0.0157) (0.0483) (0.0209) va 19,047 22.208 24.347 (0.0752) (0.0773) (0.0145) constant −17.514 57.964 55.425 41.821 72115 −12.766 (0.2171) (0.0000) (0.0000) (0.0000) (0.6469) (0.3238) Adj. R2 0.47 0.08 0.17 0.23 0.31 0.43 Number of observations 28 28 28 28 28 28 Breusch–Pagan statistics 0.12 0.22 0.056 0.58 0.062 0.14
White heteroskedasticity consistent estimator of the coefficient covariances p values are in parentheses
expected sign. It is not surprising that the effect of pressure groups and economic growth on environmental sustainability is not significant in this group of countries with a production capacity lower than that of developed countries.
Only the variable forest is statistically significant for developing countries in column 3. However, pg has not received the expected sign. While social variables are statistically signif-icant in column 4, only the variable va from the political variables is statistically signifsignif-icant in column 5. Although all of the variables have received their expected signs in the sixth column, only the variables forest, pv and va are statistically significant.
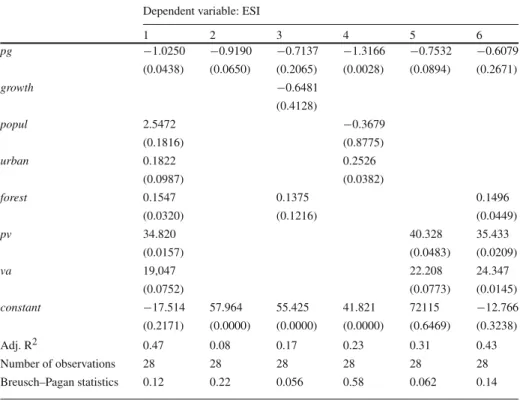
4.3 Pressure groups and ESI: G20 countries
Table3shows the estimation results obtained for G20 countries. According to the estimation results, pressure groups have a negative and statistically significant effect on environmental sustainability for the G20 countries.
As shown in column 2, pg explains 8 % of environmental sustainability. Although it received a negative sign in the binary correlation, the variable growth failed to have the expected sign due to the high correlation coefficient with the variable va. Therefore, the variable growth was removed, whereas the variable va with a higher correlation coefficient with environmental sustainability was kept within the model. While the variables urban, forest, pv and va are statistically significant, the variable popul does not have the expected sign and is not statistically significant.
Table 4 Multiple regression analysis results: EU countries
Dependent variable: ESI
1 2 3 4 5 6 pg −1.3120 −1.4817 −1.1427 −1.7762 −1.0764 −1.0982 (0.0169) (0.0182) (0.0829) (0.0407) (0.0235) (0.0669) growth −0.9458 −0.8776 −0.9132 (0.2478) (0.2001) (0.3229) popul 3.0109 (0.3053) urban 0.1671 (0.9900) (0.2551) −0.0001 forest 0.1855 0.2562 0.1795 (0.0304) (0.0112) (0.0366) pv 56.307 66.055 47.448 (0.0155) (0.0128) (0.0393) va −18,245 −19.488 −98336 (0.5331) (0.3549) (0.7590) constant 19.303 59.990 53.791 60.359 26.562 29.321 (0.5399) (0.0000) (0.0000) (0.0000) (0.2728) (0.3443) Adj. R2 0.52 0.14 0.41 0.08 0.38 0.49 Number of observations 22 22 22 22 22 22 Breusch–Pagan statistics 0.88 0.35 0.054 0.50 0.29 0.95
White heteroskedasticity consistent estimator of the coefficient covariances p values are in parentheses
The economic variables and pg are not statistically significant in the G20 countries as shown in column 3. However, when pg is included in the model with the social and political variables, it is statistically significant at the ratio of 1 % in column 4 and below the level of 10 % in column 5. While the variable urban from the social variables and pv and va from the political variables are statistically significant in columns 4 and 5, forest, pv and va are statistically significant in column 6.
4.4 Pressure droups and ESI: EU countries
Table4shows the estimation results obtained for EU countries. According to the estimation results obtained, pressure groups also have a negative and statistically significant effect on environmental sustainability in the sixth columns. As shown in the second column, pg explains 14 % of environmental sustainability.
Although it received a negative sign in the binary correlation, the variable popul failed to have the expected sign due to the high correlation coefficient with the variable growth. Therefore, the variable popul was removed while the variable growth with a higher corre-lation coefficient with environmental sustainability was kept within the model. Forest, and pv are statistically significant in the base model in which the variable va and environmental sustainability have a negative correlation coefficient.
For EU countries, the variable forest as well as the variable pg in column 3 and the variable pv as well as the variable pg in column 6 are statistically significant. In the sixth column, the
variablespg, forest and pv appear to be statistically significant. As can be seen in column 4, the variable urban has a negative sign, although it is not statistically significant. This result may be due to the former Soviet bloc countries with no healthy urban structure that joined the EU. In addition, the same reason can also be claimed for the variable va with a negative sign. 4.5 Pressure groups and ESI: OECD countries
Table5shows the estimation results obtained for OECD Countries. According to the estima-tion results obtained, pressure groups have a negative and statistically significant effect on environmental sustainability for all of the columns. This effect is at a 5 % significance level in columns 5 and 6 and below a 1 % significance level in the other columns. Based on the estimation results of the WLS method, pg explains 71 % of environmental sustainability as seen in the second column.
Although the variable growth has the expected sign but is not statistically significant in the 1st column, the variable popul is statistically significant at a level of 1 %; additionally, this variable has the expected sign without any binary correlation problem. It is statistically significant at a significance level of 10 % in the 4th column. Accordingly, population growth
Table 5 Multiple regression analysis results: OECD countries
Dependent variable: ESI
1 2a 3 4 5 6 pg −1.1943 −9.8182 −1.8406 −2.0552 −0.9675 −0.9401 (0.0086) (0.0000) (0.0001) (0.0000) (0.0154) (0.0270) growth −0.1365 0.4665 −0.0313 (0.8475) (0.5649) (0.9692) popul 6.6960 5.0342 (0.0072) (0.0627) urban 0.1076 0.0616 (0.3834) (0.6279) forest 0.1495 0.1029 0.0658 (0.0205) (0.2197) (0.3459) pv 47.262 66.205 60.762 (0.0073) (0.0006) (0.0045) va 47.054 21.850 28.630 (0.0271) (0.2121) (0.2201) constant −37.340 99.016 57.522 55.723 −12.715 −16.990 (0.1618) (0.0037) (0.0000) (0.0000) (0.5673) (0.4932) Adj. R2 0.58 0.71 0.34 0.37 0.51 0.48 Number of observations 29 29 29 29 29 29 Breusch–Pagan statistics 0.95 0.97 0.10 0.33 0.72 0.71
White heteroskedasticity consistent estimator of the coefficient covariances p values are in parentheses
aWhen the heteroscedasticity problem is detected, the model is re-estimated with the WLS method after
correcting the model with the help of the appropriate weighting factor. For this purpose, the error variance of the model has been determined as the square of the ratio of the added value of the agricultural sector to the GDP (2005 U.S. $), and all the variables have been re-scaled with 1/(Agriculture)2. Data were obtained from the WDI
increases the level of environmental sustainability for OECD countries. A similar result was obtained for the EU countries, although it was not statistically significant. It is known that the populations in the well-established EU countries age (some of these countries even face a population decrease) although there are new countries that joined the EU. Population growth in these countries may serve as a driving force for economic activities as well as sustainable development. Therefore, population growth may have a positive effect on environmental sustainability for the OECD group to which we have added the EU countries.
The variables forest, pv and va are statistically significant in the first column. In column third, while the variable growth, in contrast to the variablepg, from the economic variables does not have the expected sign, the variable forest is not statistically significant although it has the expected sign. The variable urban, another social variable, is not statistically significant in the fourth column. While the variablepv has a high and statistically significant coefficient in the 5th column, the variable va, another political variable, is not significant. The variable growth has the expected sign as the other variables in the sixth column; however, the effect is not significant compared to the variables forest and va. In this column, only the variables pv and pg are statistically significant.
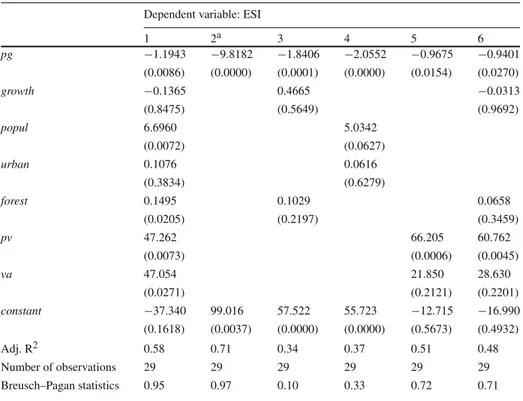
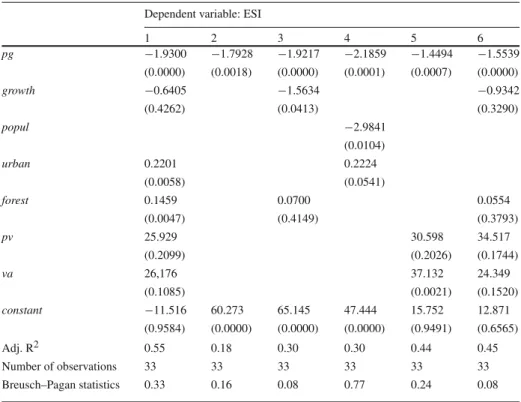
4.6 Pressure groups and ESI: developed countries
Table 6 shows the estimation results obtained for developed countries. Accordingly, for all of the columns, the effects of pressure groups in developed countries on environmental
Table 6 Multiple regression analysis results: developed countries
Dependent variable: ESI
1 2 3 4 5 6 pg −1.9300 −1.7928 −1.9217 −2.1859 −1.4494 −1.5539 (0.0000) (0.0018) (0.0000) (0.0001) (0.0007) (0.0000) growth −0.6405 −1.5634 −0.9342 (0.4262) (0.0413) (0.3290) popul −2.9841 (0.0104) urban 0.2201 0.2224 (0.0058) (0.0541) forest 0.1459 0.0700 0.0554 (0.0047) (0.4149) (0.3793) pv 25.929 30.598 34.517 (0.2099) (0.2026) (0.1744) va 26,176 37.132 24.349 (0.1085) (0.0021) (0.1520) constant −11.516 60.273 65.145 47.444 15.752 12.871 (0.9584) (0.0000) (0.0000) (0.0000) (0.9491) (0.6565) Adj. R2 0.55 0.18 0.30 0.30 0.44 0.45 Number of observations 33 33 33 33 33 33 Breusch–Pagan statistics 0.33 0.16 0.08 0.77 0.24 0.08
White heteroskedasticity consistent estimator of the coefficient covariances p values are in parentheses
sustainability are statistically below the 1 % level of significance. Accordingly, as the number of pressure groups increases, the level of environmental sustainability decreases.
The result of the effect of pressure groups in the developed countries with the highest relative production capacity on environmental sustainability, as mentioned earlier, can be explained by the fact that the first priority of pressure groups is not environmental sustain-ability but their interests. As mentioned earlier, pressure groups can cause significant harm to the environmental quality due to the profit seeking of companies with large-scale production capacities in this group as well as the pressure groups’ activities such as obtaining monopoly power and putting pressure on political decision-makers regarding the production of envi-ronmentally harmful goods. Therefore, this obtained result is not surprising. As shown in the second column, pg explains 18 % of environmental sustainability.
The variables urban and forest as well as the variable ps are other variables that are statistically significant in the first column. The variables growth and va are not statistically significant although they have the expected signs. Although it received a negative sign in the binary correlation, the variable popul failed to have the expected sign due to the high correlation coefficient with the variable growth. Therefore, the variable popul was removed while the variable va with a higher correlation coefficient with environmental sustainability was kept within the column. In the 3rd column, the variable growth from the economic variables is statistically significant and has the expected sign. The same result applies to the social variables popul and urban in the 4th column and the variable va from the political variables in the 5th column. Although the variable growth has the expected sign in the sixth column, it is not statistically significant compared to the other political and economic variables.
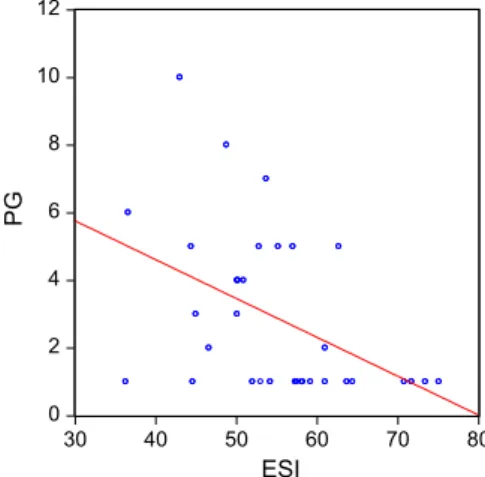
As a result, the Fig.1 shows the relation between pressure groups and environmental sustainability for the OECD and developed countries. The figure on the left shows the OECD countries, and according to this figure, the relation between the number of pressure groups and the level of environmental sustainability is negative. The countries scattered around the negatively sloped regression line prove the existence of such a relation.
The figure on the right shows the relation between the number of pressure groups and environmental sustainability in developed countries. Although according to the figure, envi-ronmental sustainability exists in the countries clustered in the section with values between
0 2 4 6 8 10 12 40 44 48 52 56 60 64 68 72 76 ESI PG 0 2 4 6 8 10 12 30 40 50 60 70 80 ESI PG
45 and 75, the existence of countries that appear to be dependent on the negatively sloped regression line can easily be recognised.This result indicates that as the number of pressure groups in developed countries and OECD countries increases, the level of environmental sustainability tends to decrease.
5 Conclusion
The objective of this study is to analyse the relation between pressure groups and environ-mental sustainability including interest groups. According to the findings of the analysis, the level of environmental sustainability decreases as the number of pressure groups increases. There is a negative and significant relation between pressure groups and environmental sus-tainability in the EU and G20 member countries; however, no significant relation is found between pressure groups and environmental sustainability in the developing countries. As expected, the negative relation between environmental sustainability and pressure groups reaches the highest level of significance in the OECD and developing countries. The negative relation between pressure groups and environmental sustainability in the developed countries reaches statistical significance even below the 1 % significance level.
This study puts forth the importance of effects of pressure groups on environmental sus-tainability. According to the results of the analysis obtained, as the level of development of countries, in other words their welfare level, increase, the pressure groups of these countries will negatively affect environmental sustainability. Therefore, relatively developed countries should effort more than relatively less developed countries in order to raise the level of envi-ronmental sustainability and they should focus on policies in this direction without bowing to pressure groups. Thus while the level of welfare of today’s society is raised, the level of welfare of future generations will also be taken into account. Consequently, the implemen-tation of policies which are created and applied to raise the level of welfare of today’s and future generations depend on developed countries which work without bowing to pressure groups.
6 Appendix
6.1 Variable definition and data sources
Pg: Represents the number of pressure groups. Data was collected from the World Factbook prepared by Central Intelligence Agency (CIA).
Growth: Represents the annual increase in per capita in GDP. Data was collected from the World Bank World Development Indicators.
Popul: Represents the annual increase of population. Data was collected from the World Bank World Development Indicators.
Urban: Represents the proportion of total urban population to total population. Data was collected from the World Bank World Development Indicators.
Forest: Represents the percentage of forested areas. Data was collected from the World Bank World Development Indicators.
pv: Consists of a combination of variables of, internal conflict, external conflict and ethnic tension. Data takes values between 0 and 1. While governmental stability increases as the values get closer to 1, the level of internal and external conflict
and ethnic tensions decreases. Data was collected from the Political Risk Services International Country Risk Guide (PRS).
va: Indicates the level of influence of the country’s military structure on political decision-makers and the level of the country’s democratic accountability and trans-parency. Data takes values between 0 and 1. The level of democratic accountability and transparency increases and political pressure from military structure reduces as the values get closer to 1. Data was collected from the Political Risk Services International Country Risk Guide (PRS).
References
Choi, K.: A statistical test of Olson’s model. In: Mueller, D.C. (ed.) The Political Economy of Growth, pp. 57–78. Yale University Press, New Haven (1983)
Coates, D., Heckelman, Jac C., Wilson, B.: Interest groups and investment: a further test of the Olson hypothesis. Public Choice 117, 333–340 (2003)
Coates, D., Heckelman, Jac C., Wilson, B.: Special-interest groups and growth. Public Choice. 147, 439–457 (2011)
Dowell, G., Hart, S., Yeung, B.: Do corporate global environmental standarts create or destroy market value? Manag. Sci. 46, 1059–1074 (2000)
Ekins, P.: Economic Growth and Environmental Sustainability—The Prospects for Green Growth. Routledge, London (1999)
Eskeland, G., Harrison, A.: Moving to greener pastures? Multinational and the pollution haven hypothesis. Cambridge, MA: National Bureau for Economic Research, NBER working paper 8888 (2002) Gentry, B.: Private Capital Flows and the Environment: Lessons from Latin America. Edward Elgar Press,
Cheltenhem (1998)
Global Leaders: Pilot Environmental Sustainability Index. World Economic Forum 2001. Davos, Switzerland (2001)
Grossman, G.M., Krueger, A.B.: Environmental impacts of a North American free trade agreement. The Mexico-U.S. Free Trade Agreement, pp. 13–56. MIT Press, Cambridge (1993)
Heckelman, J.C.: Consistent estimates of the impact of special interest groups on economic growth. Public Choice. 104, 319–327 (2000)
Horgos, D., Zimmermann, K.W.: Interest groups and economic performans: some new evidence. Public Choice.
138, 301–315 (2009)
Knack, S., Keefer, P.: Does social capital have an economic payoff? A cross-country investigation. Q. J. Econ.
112, 1251–1288 (1997)
Landau, D.: Government expenditure and economic growth in the developed countries: 1952–1976. Public Choice. 47, 459–477 (1985)
Leidy, M.P., Hoekman, B.M.: ’Cleaning up’ while cleaning up? Pollution abatement, interest groups and contingent trade policies. Public Choice. 78(3–4), 241–258 (1994)
Schleich, J.: Environmental quality with endogenous domestic and trade policies. Eur. J. Polit. Econ. l(15), 53–71 (1999)
Schleich, J., Orden, D.: Environmental quality and industry protection with noncooperative versus cooperative domestic and trade policies. Rev. Int. Econ. 8(4), 681–697 (2000)
Shapiro, D.L.: Pressure groups and public investment decisions. Public Choice 10, 103–108 (1971) Stern, D.I., Common, M.S.: Is there an environmental Kuznets curve for sulfur? J. Environ. Econ. Manag. 41,
162–178 (2001)
World Commission on Environment and Development: Our Common Future. Oxford Universty Press, Oxford (1987)
Xepapadeas, A.: Economic growth and the environment. In: Vincent, J., Maler, K.G. (eds.) Handbook of Environmental Economics, pp. 1219–1271. Elsevier, Amsterdam (2005)
Xing, Y., Kolstad, C.: Do lax environmental regulations attract foreign investment? Environ. Resour. Econ.