0 20 40 60 17,8 48,7 22,3 5,7 3,8 0,8 0,1 0,1 0,1 P ro d u ctio n ,%
Cost Modeling for Thermal Energy Storage in Hybrid Power Generation from CSP and
Biomass Resources in Turkey - Southeastern Anatolia and Eastern Anatolia Region
1* Yıldırım İsmail Tosun 1
Sirnak University, Faculty of Engineering, Department of Mining Engineering, Sirnak, Turkey * E-mail:[email protected]
Abstract
Usually hot springs spa and evaluation of district heating Southeastern Anatolia and Eastern Anatolia between 45 ° C and 125 ° C, less dense the population is not economically in the region. there is a great need for storage of excess energy which is cleaner than the energy produced from the fossil fuel power plants. This storage has facilitated the increasing penetration of storage technologies and primarily from renewable energy sources (RES). The efficienrt use of excess energy sources in today’s electricity networks may minimize the threat of global warming and climate change. However, the cost of power output and storage of these energy sources should be considerable and easy to adjust to changing demand cycles as the current and future energy storage technologies used for energy.
Model data trends observed in the average of approaches were examined and evaluated as a very well-parametric analysis of costs. It has been expanded by recent model costs. This risk analysis and plant construction, investors can provide insurance companies for risk assessment and decision-makers geothermal wells. Thus, the risk analysis will help in calculating the correct budgeting and insurance premiums.
The overall objective of hybrid the parabolic dish CSP solar panels and geothermal energy is the presence of a hybrid geothermal system can be produced economically. Geothermal energy was started in the vast area to be searched, amended as a result of the research data, the field is narrowed down to investigate to direct heating of regional area. At the same time studies in the cost-benefit criterion it has been considered, and thus became the economic research work.
Keywords: energy storage, risk assessment, stochastic cost estimation, simulation, direct heating simulation
I. Introduction
Lignite consumption in energy production is increasing in parallel with growing energy needs today. In terms of reserve and production quantities of high quality lignite, natural resources are limited. The significant amount of electricity is produced primarily from coal in the world (TKİ 2009,TTK 2009).
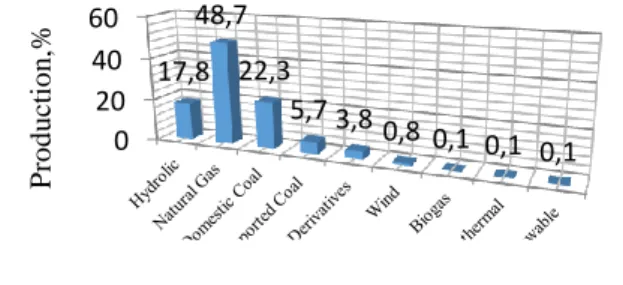
The almost 211TWh total electricity in 2011, Turkey were produced primarily from imported natural gas and domestic coal (Fig 1) (EIA, 2013). The total amount of asphaltite resource in reserves and production in Şırnak City are over 82 million tons of available asphaltite reserve and 400 thousand tons per year, respectively (MTA, 1987). Turkish coal industry needs noble gasification technologies and high gasification performances at lower cost with various types of local coals regarding researches. The most effective and cost-effective combustion or gasification technologies are needed for clean coal products in today's modern technologies (Bell et al, 2011, Shadle et al, 2001, Sharma et al, 2008, Jess et al, 2009, Kajitani et al, 2006). Turkish coal industry needs specific tests (Çakal et al, 2007) in order to measure gasification performances of various types of local coals regarding standard qualification tests. There are lots of signs for the waste yield of biomass in industrial many fields even using regular high capacity biomass of cellulosic wastes (Anonymous, 2009, Karakaya, 2008, TAM 2009,TSI 2009). Processing technologies using biomass should be under contribution to the fuel side producing high
value cleaned products, pyrolysis and gasification of lignite.
Fig 1. Primary Electricity production vs resources in Turkey regarding 2013.
II. Biomass Waste Potential of Turkey
In Turkey, the Ministry of Agriculture and Rural Affairs declared the statistics that the amount of waste generated from annual and perennial crops received from local authorities; the amount of production and acreage of each product is calculated using the data for 2012-2013. In our country, agricultural production waste is commonly left in the field. Cereal straw is used for various purposes, for example, used as animal feed, and fertilizer. The main waste in the field following the agricultural sawed products, plantations is allowed to rest. These kinds of waste cotton stalks, corn stalks, sunflower stalks, hay and tobacco stalks are waste, etc. Total amount of waste products are divided into theoretical and actual values given in the Table 1[3]. The total annual production of field crops in Turkey and waste quantities are given in Table 2.
Tab 1. Total amount of Municipal waste divided into actual values in Turkey and Eastern Anatolian Region in 2012.
Waste Type Waste Statistics Heat Value,kJ/ kg Country, Actual million ton/year Eastern Anatolian Region Actual, 1000tons/ year Textile,Rubber,Plastic s 18200 0,6 2,1 Wood, Cardboard, Paper 17600 2,4 1,6 Organic Municipal Waste 13500 2,2 29 Animal Waste 13500 1,9 21 Forestry and Agricultural Biomass 18500 2,8 63 Total 18000 9,9 116,7
Total heat value of approximately 16,8 kJ/kg for corn stalk and 20,2 kJ/kg for peanut shell waste. According to the total thermal value, basic products are corn 33.4%, wheat 27.6% and cotton 16.1 %, respectively. In Table 1, the total annual production of horticultural crops waste in Turkey is given. Its total thermal value is approximately 21.5 kJ/kg, respectively. Within the total calorific value of the product with the biggest 56.3% nut shell and olive seed 25.2%. According to the number of animals in Şırnak, the calorific value of the amount of waste and animal waste are as given in Table 2, about 13, 30 and 26,5 million in Turkey for cows, sheep and poultry, and approximately the amount of annual waste capacity are 0.2, 0.1, 0.008 million tons, respectively. The total annual amount of forest, bush and wood waste, are 6, 0.6 and 0.49 million tones, respectively. The total available 65 % solids content of 3% and 99% values were determined by the availability of forest, bush and wood waste, respectively TSI, 2013, TAM, 2013. Thus, Şırnak's cows, sheep and poultry waste calorific value of the annual total was found to be of about 48, were 3 and 0.7 MJ, respectively.
Today in Şırnak, including biomass in terms of research and development in renewable energy incentive researchs are carried out and the agricultural and forest wastes in cellulosic form are investigated in power generation. In recent times the output of the power of free licence laws before energy prices, energy-producing companies buy the energy of the states were determined through interviews. Now renewable energy prices will be forced to comply with market conditions.
Tab 2. The total annual production of biomass waste in Şırnak and Eastern Anatolian Region.
Waste Type Waste Statistics Heat Value,kJ/kg Eastern Anatolian Region Actual 1000ton/year Şırnak Actual, 1000ton/year Plastic 17200 2,1 1,3 Agricultural waste 17600 2,8 1,6 Cow, Sheep Poultry Wastes 13400 21 11 Forest Waste 18600 60 33 Total 17000 85,9 46,9
This situation of renewable energy sources in order to better compete and market additional policy tools need to emphasize that EU energy policy and law by examining the conclusions drawn from Turkey according to the potential policy instruments include: the country, the purpose specified deviation from the guarantees to domestic targets , including renewable energy sources , given up to one year , domestic gross energy consumption a certain share have to target (about 10%) should be determining policy and legislation. These are obtained from renewable resources and electric power for heating may comprise separate but integrated objectives. These policies and laws only for biomass separate, but can also include an integrated target. All use of renewable sources in the EU target of achieving 12% market share for the biomass should be increased up to 300%. The country, the purpose specified deviation from the guarantees to domestic objectives including, biologically-based fuels, specific to a year, used in transport petrol and diesel fuel market, a certain share to have a target for determining the policies or laws should be removed. Regard to the energy in Turkey appropriate potential market instruments include: biomass -generated electricity, heating and / or used in transport fuels, tax reductions or exemptions, flexible loans, low interest loans, loan guarantees , property first operating subsidies and / or grants and related service for consumers willing to use discounts as well as other financial support mechanisms. A potential market instrument of state support is not required to continue forever. They just won and sustaining investor confidence during development and may be important
.
III. Combustion of Biowaste, Oil and Char in Fluidized Bed
Considerable research on coal pyrolysis and gasification has been conducted over the years, but the pyrolysis results are widely dispersed because of the complex chemistry of coal (Wei-Biao et al,2001, Liu et al 2002). Time related coal-pyrolysis modeling assumes basically first-order kinetic equations, or less
sensitive for heating rate (Shale et al 2001, Sharma et al 2008). The other distributed activation model is dependent on the heating rate. The last two more advanced models need three and four constants, respectively, which basically depend on the coal properties but also cover to some extent, the effect of heat-and-mass transfer phenomena (Donskoi et al, 1999, Wictorsson et al, 2000).
Fig 2. Fluidized Bed Combustion of Coal and Biomass for combustion
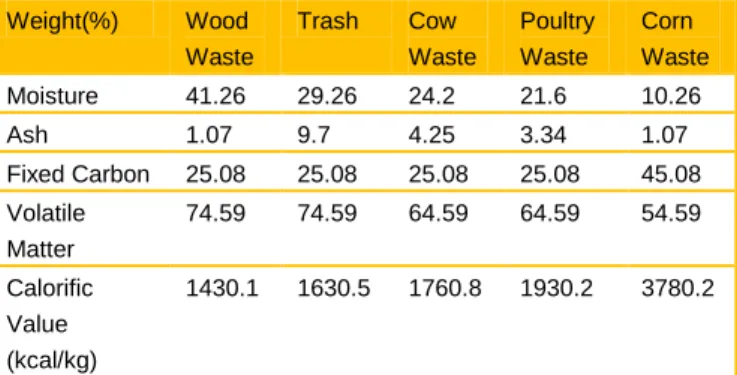
Tab 3. The Proximate Analysis of Şırnak Biomass Types. Weight(%) Wood Waste Trash Cow Waste Poultry Waste Corn Waste Moisture 41.26 29.26 24.2 21.6 10.26 Ash 1.07 9.7 4.25 3.34 1.07 Fixed Carbon 25.08 25.08 25.08 25.08 45.08 Volatile Matter 74.59 74.59 64.59 64.59 54.59 Calorific Value (kcal/kg) 1430.1 1630.5 1760.8 1930.2 3780.2
Tab 4. The total annual production of animal waste in Şırnak and waste quantities.
Waste Type Waste Statistics Heat Value,kJ/kg Theoreti
cal, 1000ton/ year Actual, ton/year Cow 15200 25,4 12,3 Sheep 14600 2,3 1,6 Poultry 13700 0,7 0,4 Total 14200 28,4 13,3
That is the reason for the different values of the activation energy and pre-exponential factor cited in the literature and the lack of generally valid data. The same situation exists in the case of coal-char gasification. The reaction rate of char is influenced mainly by chemical and physical factors, which include coal type, catalytic effect of the ash and the
specific surface area of biochar, which changes during the reaction course with the development of internal pores.
IV. The Energy Storage
The energy storage provide the main support to the renewable energy production. The commercial successes in electric power storage Technologies mentioned and its ability were described some of the emerging applications in power storage like wind farm power stabilization, steam, hydro, wind, etc. (Anonymous f,h, 2013, Ibrahim et al 2007) The figures of statistical potential of storage in the world is defined as seen in Fig 3. The use of different techniques in energy storage are classified as seen in Fig 4 regarding discharge time.
Some cost evaluations covering security of supply and environmental impacts, climate change evaluations, and technical and economic analysis, may be disussed in energy planning and activities.
Fig 3. The Compressed air and Thermal Storage Use Distribution in Energy Storage.
Fig 4. The Discharge rates of Different Types of Energy Storage Units vs Power.
Natural power output cannot be controlled. The power from these generators varies according to the availability of the resources (for example in case of Solar heat or wind turbine, it depends on the availability of wind or sun) (Anonymous a,b,c, 2013, Ibrahim et al 2007). During the non-availability of the power the storage technologies manage a vital role in
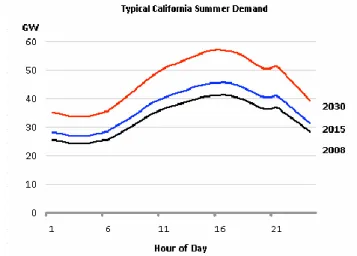
improving the overall stability and reliability of power system (islolated/grid connected/systems with large share of renewable sources) and improve the controlled electricity distribution capacity to meet ever growing power demand. The internal grid circulation with the energy storage in renewable sources may stabilize power level in heap and 50-60% yield recoveries were provided at the end of year. As seen in Fig 5 the power consumption can be supplied by stored earlier day time. (Anonymous d,e, 2013, Poullikkas et al 2007)
Fig 5. The power demand of California on daily period in summer
A. Compressed Air Storage
The special thing about compressed air storage is that the air heats up strongly when being compressed from atmospheric pressure to a storage pressure of approx. 1,015 psia (70 bar). Standard multistage air compressors use inter and after coolers to reduce discharge temperatures to 300/350°F (149/177°C) and cavern injection air temperature reduced to 110/120°F (43/49°C) (Anonymous g,h, 2013, Ibrahim et al 2007). The heat of compression therefore is extracted during the compression process or removed by an intermediate cooler. The loss of this heat energy then has be compensated for during the expansion turbine power production phase by heating the high pressure air in combustors using biogas, fuel. Alternatively using the waste heat of a combustion gas turbine exhaust in a recuperator is able to heat the incoming air before the expansion. Even the heat of compression can be thermally stored before entering the cavern and used for adiabatic expansion
extracting heat from the thermal storage system.
Fig 6. CAES Method
The only two existing CAES plants in Huntorf, Germany, and in McIntosh, Alabama, USA, as well as all the new plants being planned regarding the diabatic method. The compression stage normally uses up about 2/3 of the turbine capacity, the CAES turbine – unhindered by the compression work – can generate 3 times the output for the same natural gas input. This reduces the specific gas consumption and cuts the associated CO2 emissions by around 40 to 60%, depending on whether the waste heat is used to warm up the air in a recuperator. The power-to-power efficiency is approx. 42% without, and 55% with waste heat utilization.
B. Hydrogen Storage
Electricity can be converted into hydrogen by electrolysis. The hydrogen can be then stored and eventually re-electrified. The performans today is as low as 30 to 40% but could increase up to 50% if more efficient technologies are developed. Despite this low efficiency the interest in hydrogen storage is growing due to the much higher storage ability compared to batteries (small scale) or pumped hydro and CAES (large scale). (Anonymous f,h, 2013, Ibrahim et al 2007)
Small amounts of hydrogen (up to a few MWh) can be stored in pressurized vessels at 100~300 bar or liquefied at 20.3K (-423 deg F). Alternatively, solid metal hydrides or nanotubes can store hydrogen with a very high density. Very large amounts of hydrogen can be stored in man made underground salt caverns of up to 500,000 m3 at 200 bar (2,900 psi), corresponding to a storage capacity of 167 GWh hydrogen (100 GWh electricity). In this way, longer periods of flaws or of excess wind / PV energy production can be leveled. Even balancing seasonal variations might be possible.
C. Liquid Air Energy Storage
Liquid Air Energy Storage (LAES) is sometimes referred to as Cryogenic Energy Storage (CES). The word “cryogenic” refers to a gas in a liquid state at very low temperatures. The working fluid is Liquefied Air or Liquid Nitrogen (78% of air). The systems share
similar performance characteristics to pumped hydro and can harness industrial low-grade waste heat/waste cold from co-located processes, converting it to power. Size range extends from around 5MW/15MWh to >50MW/250MWh and with capacity and energy being de-coupled, the systems are very well suited to long duration applications.
Fig 7. Linde Liquid Air Storage Tanks .
V. Projected Tests for Hybrid Power and Capital Model for Energy Storage
A fluidized bed reactor was used in coal combustion heated till 600 oC with a rate 7-10oC/min by fuel. The process was tested at a scale of 2–3 kg/h; collecting operational and design data to build an industrial installation. A technological diagram of the coal gasification-pyrolysis process developed unit is made. Thermal destruction almost observed at temperature Heat exchanger oil temperature increase from 350 °C to 400°C with storage and performance of 60-70% and also simultaneous dilution of waste oil products by condenser distillate may be used. it is necessary to optimize the storage conditions of oil circulation without the heat loss transported to heat exchanger, where the average heat conductivity per oil amounts changes 20 - 30 kW/m3, so enhancing ORC heat transfers.
VI. Cost Model for Energy Storage
Compresse air storage for large scale installation of coal combustion was planned simply. Porous shale beds in Southeastern Anatolian region, in Batman was planned with fine coal burned with oil and biowaste at 0,2 m/s. In order to achieve this, it is necessary to create gaseous conditions of internal circulation without the transported coal and char in the fluidized bed, where the average concentration of solids amounts to 0.1- 0.2 m3/m3, i.e. the conditions for residence time are long enough for the thermal oil storage of combustion units( Dinçer and Rosen 2011, Cabeza, 2015) and intensive gas firing so enhancing mass and heat transfers.
The cost of underground compressed air storage will greatly depend on drill cost. The parameters are defined in Table 5 below.
Fig 8. The rates of Combustion of biowastes used in coal combustion at 600oC in fluidized bed. Thermal oil storage may greatly concerned by combustion using power plant systems, due to heat loss in echanger and recupator use in the heat recovery.
Tab 5. Correlation and variable values in Drilling depth with the cost of investment.
RİSK Point Weak Rock s Mid Rock Hard Rock 500m 1500 m 2500 m Depth,m 1 3 6 1 4 8 Advance Rate 0.071 0.21 0.71 0.71 0.11 0.071 Drilling Period 12 59 112 42 122 333 Investment s 121 145 223 222 678 2311 Risk 1 3 6 1 4 8 Risk Error −0.26 6 -0.24 5 -0.29 8 -0.21 3 -0.344 -0.41 Correlation Coefficient −0.26 6 -0.14 -0.57 -0.25 6 -0.679 -0.053
Compressed air use was investigated in the projected study due to the regional potential of Southeastern Anatolian region of Turkey. Espeially oil resoirvoirs was thought as storage field, in the mean time the natural gas using power plants may advantageously evaluate the compressed air or liquidified air. However liquidified air was not considered in ths projected study due to costly compression units was needed. y = -13,38ln(x) + 130,05 y = -18,01ln(x) + 119,28 y = -18,22ln(x) + 119,53 0 10 20 30 40 50 60 70 80 90 100 1 10 100 1000 Co m b u sti o n Wei gh t, TGA ,% Time, s 10 mm Şırnak ÇöpBiyoKütle 5 mm Sığır Küspe 5 mm Tavuk Küspe Mısır Sapı 10mm Şırnak Municipal Waste, Biomass 5 mm Cow Waste 5 mm Poultry Waste 5 mm Maize Slush
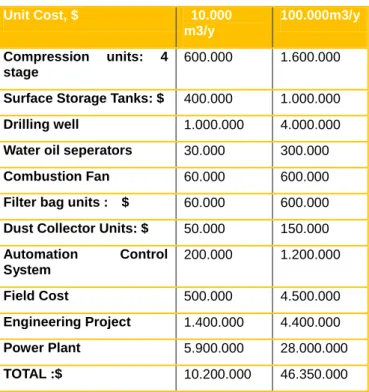
Gaussian normal distribution of risk probability values defines the value of the compresse air plant investment in data-intensive midpoint. It is obtained as given below section. As given in Tab 6 the compressed air storage unit cost reached high levels. Time became the main parameter in the evaluation.
(1)
Tab 6. The Capital costs of Compresse air storage in the region into the used oil reservoirs
Unit Cost, $ 10.000 m3/y 100.000m3/y Compression units: 4 stage 600.000 1.600.000
Surface Storage Tanks: $ 400.000 1.000.000 Drilling well 1.000.000 4.000.000 Water oil seperators 30.000 300.000 Combustion Fan 60.000 600.000 Filter bag units : $ 60.000 600.000 Dust Collector Units: $ 50.000 150.000 Automation Control System 200.000 1.200.000 Field Cost 500.000 4.500.000 Engineering Project 1.400.000 4.400.000 Power Plant 5.900.000 28.000.000 TOTAL :$ 10.200.000 46.350.000
For the integrated plant, the capital investment cost of 500 thousand tons/year capacity was determined as 53 million $, while 1 million tons/year capacity the investment value was doubled. Already region for high-capacity incinerators could not considered due to the impossibility of sources and the obtaining funds and logistics were not feasible. Mobile 25000 tons/year capacity plant, depending on the companies' unit costs is determined as 11 million $ (as given in Table 6).
Mobile plant and integrated plant operating costs were calculated based on the present prices. As Table 6 also given mobile plant labor, it will provide advantages in terms of reactive maintenance. Mobile plant operating cost was calculated as approximately 25 TL/ton for defined biowaste. This integrated facility cost rose to 63TL/ton.
Mobile plant and integrated plant operating costs and energy production (70% and 60% thermal efficiency fuel efficiency) was calculated to be connected. mobile plant as given in Figure 8, while in a period of their capital investment in 22 months, after a period of 36 months will generate more revenue for the integrated plant operating costs will be advantageous investment capital back to paying (Figure 8).
VII. Investment Modeling of Compressed Air Storage from Coal and Biomass
Combustion
Thus, the installed capacity of the planned plant was about 2 million kWh/year and the entire unit energy yield was 22 MWh/year and 15% storage capacity was used in cost estimations.
The costs of drilling equipment such as maintenance costs
General Pareto distribution of the cumulative risk the possibility of failure depth is closer to the discovery and exploration of geothermal resources available well data. Figure 9, as determined in the MATLAB software risk probability value is above 5% probability of 60-90. (2) while exponential distribution k = 0, where u is the cost function, is the variance ,k is hybrid distribution parameter, is the tim parameter, x is the flow rate by the following equation.
is the total cost, is tax, F is the interest, is maintanance cost, D is share rate, cm is capacity factor, K is the unit capacity. As given below;
Fig 9. Change of the Cost of Drilling for Compressed Air Storage. y = 0,6482e0,0007x R² = 0,9023 0 0,5 1 1,5 2 2,5 3 3,5 4 4,5 5 0 1000 2000 3000 4000 D ri lli n g Co st, M ill io n TL Drilling Depth,m
(3)
(4)
The cost calculation of the plant,
Calculation of unit cost of the facility, Calculation of the investment costs of the
facility at which it will go into production, Plant operating costs and the calculation
of the annual income,
(5) (6) (7)
The capital cost for compressed air storage and thermal oil storage may greatly affected by the ost of storage material and process units complecity.The proposed cost of investment depenting on flow rate of stored material and conversion to heat or energy as given below.
(8)
where R is the revenue, Q is the capacity, P is the sale price, r is the interest rate, m is month, n is the integer of month, E is investment cost, f is debt rate, cm is
capacity factor, L is the debt, u cost function, t is time, is the time unit parameter.
As given Tab 7 the cost distribution changed by time of storage well drilling and time. Risk point was similar to geothermal well drilling. As shown in Fig 10 risk parameters occurred in the projected cost risk analysis. As seen in Fig 11 the capital cost was ranged up to 180 million $ for 100.000 m3/y compressed air storage.
Tab 7. Normal distribution Cost variable values in Compressed air Storage Well Drilling with the cost of
investment regarding depth. RİSK Point Wea k Rock s Mid Roc k Har d Roc k 500 m 1500 m 2500 m Depth,m 1 3 6 1 4 8 Advance Rate 0.071 0.21 0.71 0.71 0.11 0.071 Drilling Period 12 59 112 42 122 333 Investmen ts 121 145 223 222 678 2311 Risk 1 3 6 1 4 8
Fig 10. ORC Use for Low Heat Geothermal and Biomass sources in energy and risks of Capital Investment costs in Turkey
0 20 40 60 80 100 120 140 160 180 0 50 100 150 200 250 300 350 Inve s tm e nt ,1 0 0 0 $ /k W h
Water Flow Rate,l/s
Tab 8. Compresse Air Storage Cost Variables on Coal and Biomass energy capital cost risk Projected Cost and Revenues Batman Without Storage Siirt Without Storage Batman With Storage Siirt With Storage Cost Risk Batman Cost Risk Siirt Net Electricity kWh 137,000,000 132,000,000 167,000,000 162,000,000 3 3 Average Annual Sale TL 0,26 0,26 0,26 0,26 6 6 Production Cost nominal 0,21 0,21 0,26 0,26 6 6 Production Cost actual 0,11 0,11 0,15 0,15 6 6 Return rate ,% 42 40 33 34 6 6 Annual Net Profit 22,000,000.TL 21,000,000.TL 12,000,000.TL 11,000,000.TL 6 6 Calculated Sale price change,% 14 14 14 14 6 6 Calculated debt rate,% 22 21 22 21 6 6 Capacity factor 1 1 1 1 2 2 Land cost 1,6 1,6 1,6 1,6 2 2 System performance factor 21 19 21 19 3 3
Toatal field, acre 4 4 4 4 1 1
Cogeneration Sellective Sellective Sellective Sellective 1 1
Average Risk 6 6
VIII. Conclusions
This project approach assumes basically that the thermal oil storage units are much feasible instead of compressed air units, so that is a decisive factor for the path of the storage method and heat exchanger units. Therefore a model of hot oil storage may be supported by biogas combustion, too. The gas temperature and. fluid bed combustion and pyrolysis oil use for coals and biomass may provide clean combustion and oil storage. Combustion rates were lower higher at the high temperatures over 900 C so that heat conduction loss to boiler materials might be fundamentally low enthalpy yield. The main conclusions are as follows:
Time uncertainties are taken into account by adding a contingency factor. This approach is simple and it is advantageous to be close to the real projected cost data.
Storage by compressed air was efficient but also requires more equipment for compression needed.
The liquidified air storage system needs subsequent high cost compression unıts. However, time variable and uncertain application of parametric variables makes possible reliable risk analysis. This research has examined various risk models for energy production. The most appropriate model is determined by comparison. The compressed air was efficient in natural gas combustion turbines but also requires optimization. The liquidified air storage system needs high cost stage by stage compression unıts.
The used oil fields will be suitable for compressed air storage. The capital cost of thermal oil storage will be suitable for industrial combustion systems at small scale and shorter time concern.
References Anonymous a, 2013, http://www.activepower.com. Anonymous b, 2013, http://www.hystoretechnologies.com. Anonymous c, 2013, http://www.nrel.gov. Anonymous d, 2013, http://www.cap-xx.com. Anonymous e, 2013, http://www.doc.ic.ac.uk. Anonymous f, 2013, http://www.electricitystorage.org. Anonymous h, 2013, http://www.enercon.com.
Anonymous a, 2015, Mobile incinerators, http://www.incinerators-ati.com/mobile-incinerator.php, ATİ Şirketi
Anonymous b, 2015, Yakma Kazanları, http://www.alfakazan.com.tr, Alfa Kazan ve Makine AŞ,Ankara
Anonymous c, 2015, Akışkan Yataklı Yakma Kazanı, http://www.mimsan.com.tr, Mimsan A.Ş. , İstanbul Anonymous d, 2015, http://www.atlasinc.dk/ Anonymous e , 2015, http://www.santes.com.tr/
Anonymous f, 2015, http://www.ottusa.com/mobile _systems/mobile_systems.htm
Akpınar, N , Şen, M, 1987, Kentsel katı atıklardan enerji üretimi, Enerji Enstitüsü
Bell D.A. Towler B.F., Fan M., 2011, Coal Gasification and Applications, ISBN: 978-0-8155-2049-8, Elsevier Inc., Oxford
Cabeza, L. F. (Ed)2015, Advances in thermal energy
storage systems , Elsevier, Woodhead Publishing Series in
Energy ISBN: 978-1-78242-088-0
Çakal, G.Ö. H. Yücel, A.G. Gürüz, 2007, Physical and chemical properties of selected Turkish lignites and their pyrolysis and gasification rates determined by thermogravimetric analysis, Journal of Analytical and Applied Pyrolysis, Volume 80, Issue 1, 262–268
Cherubini, F. Bargigli, S. Ulgiati, S. 2009, Life cycle assessment (LCA) of waste management strategies: landfilling, sorting plant and incineration, Energy, 34, pp. 2116–2123
Dinçer, İ. Rosen. M. A., 2011, Thermal energy storage: systems and applications, second edition, John Wiley & Sons, Ltd ,ISBN: 9780470747063 Online ISBN: 9780470970751, DOI: 10.1002/9780470970751
Donskoi, E.& McElwain, D.L.S., 1999, Approximate modelling of coal pyrolysis, Fuel, 78 , pp. 825–835
Ibrahim H, Ilinca A, Perron J. Energy storage systems—characteristics and comparisons. Renewable and Sustainable Energy Reviews 2007;12: 1221–50.
IEA, 2007,,A.J. Minchener and J.T. McMullan IEA Coal Research Ltd, Clean Coal Technology
IEA, 2013, World Energy Outlook
Jess A, Andresen A-K. Influence of mass transfer on thermogravimetric analysis of combustion and gasification reactivity of coke. Fuel.; 2009. doi:10.1016/j.fuel 2009.09.002
Kajitani S, Suzuki N, Ashizawa M, et al. CO2 gasification rate analysis of coal char in entrained flow coal gasifier. Fuel. 2006;85:163-169.
Kajitani S, Suzuki N, Ashizawa M, et al. CO2 gasification rate analysis of coal char in entrained flow coal gasifier. Fuel. 2006;85:163-169.
Karakaya, İ.,2008, İstanbul için stratejik kentsel katı atık Yönetimi yaklaşımı, Yüksek LisansTezi , İTÜ FBE Çevre Müh.Böl.
Kreith, F Tchobanoglous, G, 2002, Handbook of Solid Waste Management
L.P. Wiktorsson, W. Wanzl, 2000, Kinetic parameters for coal pyrolysis at low and high heating rates—a comparison of data from different laboratory equipment, Fuel, 79 , pp. 701–716
Liu, G., Benyon, P., Benfell, K.E., Bryant, G.W., Tate, A.G., Boyd R.K., 2002, The porous structure of bituminous coal chars and its influence on combustion and gasification under chemically-controlled conditions, Fuel, 79, pp. 617–626
Poullikkas A. Implementation of distributed generation technologies in isolated power systems. Renewable and Sustainable Energy Reviews 2007;11: 30–56.
Richard A. Denison, J R, 1990, Recycling and Incineration: Evaluating the Choices
Ron Isaacson, 1990, Methane from Community Wastes (Elsevier Applied Biotechnology Series)
Schurtz R, Fletcher TH. Pyrolysis and gasification of a sub-bituminous coal at high heating rates, 26th Annual Int Pittsburgh Coal Conf, Sept. 20-23, 2009.
Shadle LJ, Monazam ER, Swanson ML. Coal gasification in a transport reactor. Ind Eng Chem Res. 2001;40:2782-2792 Shadle LJ, Monazam ER, Swanson ML. Coal gasification in a transport reactor. Ind Eng Chem Res. 2001;40:2782-2792 Sharma A, Saito I, Takanohashi T. Catalytic steam gasification reactivity of hypercoals produced from different rank of coals at 600-775 oC. Energy & Fuels. 2008;22:3561-3565.
TAM, 2014,Tarım ve Köy İşleri Bakanlığı İstatistikleri, http://www.tarim.gov.tr
TEFM, 2008, Orman biyokütlesinden yakıt ve enerji üretimi, (Kahveci, O) TC. Çevre ve Orman Bakanlığı Orman genel müdürlüğü http://www.ogm.gov.tr
TEFM, 2009, Orman Genel Müdürlüğü’nde Biyoenerji Konusunda Yapılan Çalışmalar, Orman Genel Müdürlüğü, Biyoenerji Çalışma Grubu, Orman ve Enerji, Ankara, www.ogm.gov.tr
TKI, 2009, The Turkish Ministry of Energy, Energy, Dept., Lignite Coal Report
Tosun YI , 2012, Semi-fused Salt-Caustic Mixture Leaching of Turkish Lignites - Sorel Cement Use for Desulfurization, Proeedings of XIIIth International Mieral Processing Symposium, Bodrum, Turkey.
TSI,2014, Türkiye İstatistik Kurumu Verileri, 2014, http://www,tuik.gov.tr
TTK, 2009, The Turkish Ministry of Energy, Energy, Dept., Hard Coal Report
Wei-Biao, F. . Quing-Hua, W 2001, A general relationship between the kinetic parameters for the gasification of coal chars with CO2 and coal type, Fuel Processing Technology, 72, pp. 63–77