Determination of Different Demographic, Socio-Economic Factors on Bulgur
Consumption in Karaman
Merve ÖZBAY1 Mehmet KARATAŞ2 Muhammad AASIM2*
1Department of Hotel, Restaurant and Catering, Karamanoglu Mehmetbey University, Karaman, Turkey 2Department of Biotechnology, Faculty of Science, Necmettin Erbakan University, Konya, Turkey
*Corresponding Author: Received: July 20, 2016
E-mail:[email protected] Accepted: December 21, 2016
Abstract
Wheat porridge grains or bulgur is one of the oldest wheat grain based food used by human beings. It is major constituent of many of modern and popular Turkish cuisine and is gaining acceptance in other neigbouring East European european countries and USA due to their high nutritous value. In Turkey, Karaman province of Central Anatolia region of Turkey is the major producer of bulgur in the region; where bulgur is used in variety of ways by local people. This study focus on the socio-economic factors that affects the use of bulgur consumption in Karaman. A total of 291 consumers (samples ) from 6 different regions of Karaman were physically interviewed by asking 52 questions that covered the demographic and socio-economic parameters. The results were summarized on percentage basis. The results of this study showed the clear bearings of factors like education, income, price and brand etc on bulgur consumption in the region.
Keywords: Bulgur, Karaman, Socio-economic, Demographic factors
INTRODUCTION
Wheat porridge grains or bulgur is one of the oldest processed food stuff made from wheat grains dated back to 4000 years BC. Wheat was considered one of the holy plant in Chinese kingdom of Shen Nung (2800 BC) alongwith rice, sorghum, soyabean and common beans. It is well established that wheat was cooked and then dried around 1000 BC [1, 2].
Wheat porridge grains or bulgur is one of the major food product in Turkish Cuisine and consumed everywhere in Turkey. Bulgur is also produced and consumed in Eastern, Central and Western Europe, USA and Canada and all other continents. Similarly, bulgur is consumed by almost every nation World over but is mor popular among Turkish, Arabs, Greeks and Armenians families. However, consumption and production is very low in EU countries [2,3,4] compared to Turkey, where Bulgur is very popular.
In Turkey, There are almost 500 factories making bulgur with annual production of around 100000 tons per annum with annual growth rate of 1.5-2.5%. In Turkey, an average of 12 Kg bulgur is being consumed per person. Turkey is also largest provider of Bulgur to United Nations due to high nutritional value and long shelf life [4]. Bulgur is also very rich in Vitamin A, folic acid, unsaturated fatty acids with no Cholestrol. Bulgur can be used for making pilaff, soup or making other foods like vegetable stuffing and meat balls [5]. The foods made from bulgur can be used hot or cold [4, 6,7].
Bulgur is processed in two different ways in Antep and Karaman regions of Turkey. Karaman type bulgur is more popular and consumed compared to Antep type bulgur due to high nutritous value. Both of them are major wheat producing areas and are famous for wheat and agricultural based industries. A number of factories and famous brands of Bulgur in Turkey belongs to Karaman. Keeping in view, the present study was designed to find out the trend of bulgur consumption in Karaman province. The study will be helpful to find out the demographic and socio-economic factors that affects the use of bulgur in the area.
MATERIAL and METHODS
The primary material source in this study consisted of bulgur consumers living in Karaman city. Karaman is located in the South East of Central Anatolia region (37°10’52”N, 33°12’54”E). All consumers were interviewed in face to face meetings. A total of 291 consumers from six different locations of the Karaman were interviewed.
A questionare was designed with 52 questions in order to find out the use of bulgur and factors affecting its consumption. The questionare covered the demographic and socio-economic factors related to bulgur consumption.
In order to meet the objective of the study, extreme care was taken to select random groups representing the main group of population. It is well konwn that constitution of the sample groups is of immense importance. The probability method was employed in this study which is popular method used for sampling in research. The boundaries of the main group are in definite positions and it is possible to determine the confidence level which enabled to commentson the data. The formula for determining the size of the sample is given below [8].
Where
n: Number of people to be sampled N: Number of people in main unit/group
Z: The value of the z-table at a certain level of semantics p: probability of occurrence of the event being investigated
q: Probability of the event being investigated
d: - / + sampling error which is accepted according to the frequency of occurrence of the event being investigated [8].
Population of Karaman Province was estimated as 144.178 in 2011. The sampling error for this population at 0.05 and 95% confidence interval z value is 1.96. Probability of occurrence and non occurance of the phenomenon studied
was taken as p = 0.8 and q = 0.2. This showed that a total of 246 samples (consumers) are well enough for sampling. But we used 291 samples for survey to improve the probability level. In this study, available data was calculated and presented as perecentage.
RESULTS
In order to check the scientific reliability of the data research and data collection, reliability test of questionare was performed prior to survey. For this purpose, the value of Cronbach’s alpha was estimated. Alpha coefficient has a value between 0 to 1. Value closer to 1 shows the reliability of the questionare. In this study, the value of Alpha coefficient
was 0.82 that showed the acceptable level of the data and results.
Effects of Demographic and Socio-Econonmic Factors
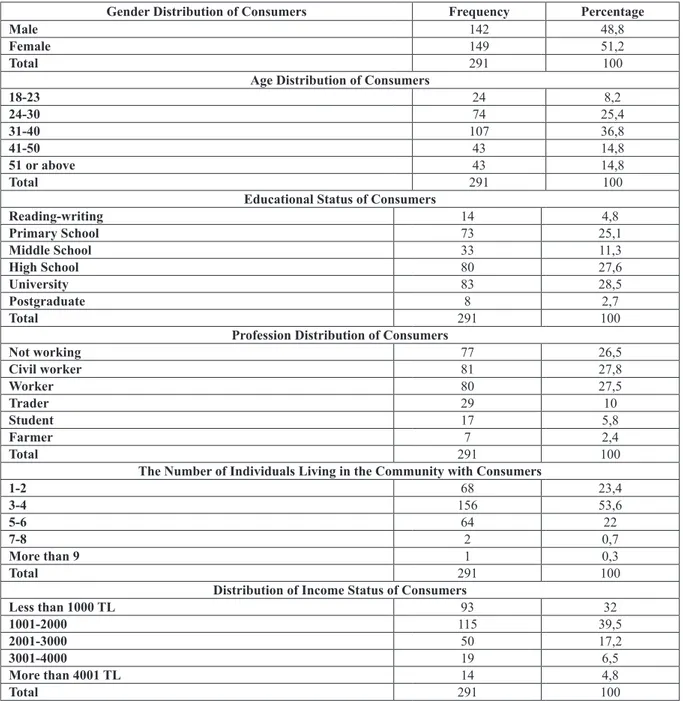
A total of 142 (48.8%) male and 149 (51.2 female consumers with a total of 291 consumers from Karaman province were interviewed during this study. These consumers were selected randomly from all towns of the province. People living in the villages or towns in the sorrounding of Karaman city were not included in this study. Other informations included age, education level, profession, average size of family and average monthly income of the consumers (Table 1).
Table 1. Socio-Economic parameters of customers
Gender Distribution of Consumers Frequency Percentage
Male 142 48,8
Female 149 51,2
Total 291 100
Age Distribution of Consumers
18-23 24 8,2 24-30 74 25,4 31-40 107 36,8 41-50 43 14,8 51 or above 43 14,8 Total 291 100
Educational Status of Consumers
Reading-writing 14 4,8 Primary School 73 25,1 Middle School 33 11,3 High School 80 27,6 University 83 28,5 Postgraduate 8 2,7 Total 291 100
Profession Distribution of Consumers
Not working 77 26,5 Civil worker 81 27,8 Worker 80 27,5 Trader 29 10 Student 17 5,8 Farmer 7 2,4 Total 291 100
The Number of Individuals Living in the Community with Consumers
1-2 68 23,4 3-4 156 53,6 5-6 64 22 7-8 2 0,7 More than 9 1 0,3 Total 291 100
Distribution of Income Status of Consumers
Less than 1000 TL 93 32 1001-2000 115 39,5 2001-3000 50 17,2 3001-4000 19 6,5 More than 4001 TL 14 4,8 Total 291 100
Results showed that 71.5% consumers in this study were either workers, civil servants or self-employed and their monthly income was below 2000 TL. 38.1% consumers spent 10-30%; 47.1% spent 30-50%; 13.4% spent 50-70% and remaining 1.4% spent 70-100% of their income on purchasing food stuff. This result showed that person with low income spent most of his income on buying food stuff. It was also notebale that consumers with monthly income below 1000 TL preferred more bulgur comapred to other income status which might be due to its low price. Results on age clearly defined that bulgur was the most preferable by the consumers with age between 31-40 followed by age range of 24-30 years. Contrarily, consumers from age group of 18-23 were the least to prefer bulgur. Results on education level also highlighed the relationship between education level and bulgur consumption. Consumers with education of pre school university graduate preferred bulgur due to its high nutritional value and positive effects on the health.
However, consumers without any education or postgraduates were the among with least bulgur consumption. Most of the families comprised of 3-4 persons followed by 1-2 persons that represented the general family structure of Central Anatolian region .
Factors taken into account Prior to purchase of Bulgur
Results on expiry date, brand consciousness, appearance and price show the purchasing ability and consciousness of the consumer. Our results showed that higher percentage of consumers paid attention to expiry date (82.5%), brand consciousness (82.5%), appearnace (78 %) and price (83.2%) of the product. Whereas, very low percentage of consumers remained undecided to answer these questions that was recorded as 7.6%, 5.5%, 10% and 8.2% for expiry date, brand, appearnace and price respectively (Table 2).
Table 2. Distribution of concerning points of consumers prior to purchase bulgur
Frequency Percentage (%)
I pay attention to manufacturing and expirat date prior to buying Bulgur
Fully Disagreed 11 3.7
Disagreed 18 6.2
No Idea 22 7.6
Agreed 100 34.4
Fully Agreed 140 48.1
I pay attention to brand prior to buy Bulgur Fully Disagreed 11 3.8 Disagreed 24 8.2 No Idea 16 5.5 Agreed 116 39.9 Fully Agreed 124 42.6
I pay attention to outlook prior to buy Bulgur Fully Disagreed 12 4.1 Disagreed 23 7.9 No Idea 29 10 Agreed 121 41.6 Fully Agreed 106 36.4
I pay attention to price prior to buy Bulgur Fully Disagreed 9 3.1 Disagreed 16 5.5 No Idea 24 8.2 Agreed 104 35.7 Fully Agreed 138 47.5
Primary Factors affecting bulgur consumption
Question related to availibility of bulgur in packaging, taste, nutritive value, longer shelf life, resistance to microbial pests, fast cooking and cheapness reflected the preferences of the conssumer comapred to other alternative food product like rice. Results showed that packaging of Bulgur is not important for the consumer as it falls between 11.7 % (undecided) to 26.5 % (agreed). However, 82.2% consumers preferred bulgur due to its tatse and 61.5% preferred due to
its nutrition value. 52.6% and 50.9% consumers preferred it due to its long shelf life and resitance against microbial pests (mainly fungus) under household conditions. 79.7% preferance of consumers was due to cheaper price compared to other competitors like rice. It was interesting to note that only 30.6% consumers preferred bulgur due to fast cooking time which showed that cooking time is not a main interest for the consumers (Table 3).
Decision making and Bulgur consumption
In general, females are considered to be a good judge of food products due to continuously cooking them at home. In this survey, the role of parent (mother or father) on making decision to buy bulgur was also investigated. The results were very interesting as only 24.4% females were found responsible for decision making about buying bulgur.
Whereas, 77% fathers in the family used their decison power to buy bulgur in Karaman. In Karaman, males (Fathers) role in selecting bulgur was 3 fold higher compared to females (mothers) that could be due to conservative and rural agricultural background of the province (Table 4).
Table 3. Primary Factors affecting preference about bulgur by consumers
Frequency Percentage (%)
I prefer to buy Bulgur in packing
Fully Disagreed 40 13.7
Disagreed 78 26.8
No Idea 34 11.7
Agreed 77 26.5
Fully Agreed 62 21.3
I prefer Bulgur due to its taste
Fully Disagreed 11 3.7
Disagreed 15 5.2
No Idea 26 8.9
Agreed 130 44.7
Fully Agreed 109 37.5
I prefer Bulgur due to its nutritional value Fully Disagreed 23 7.9 Disagreed 52 17.9 No Idea 37 12.7 Agreed 112 38.5 Fully Agreed 67 23
I prefer Bulgur due to its longer shelf life Fully Disagreed 16 5.5 Disagreed 54 18.5 No Idea 68 23.4 Agreed 100 34.4 Fully Agreed 53 18.2
I prefer Bulgur due to its resistance against micobial pathogens Fully Disagreed 27 9.2 Disagreed 73 25.1 No Idea 43 14.8 Agreed 105 36.1 Fully Agreed 43 14.8 Total 291 100
I prefer Bulgur due to its quick
cooking time Fully Disagreed 55 18.9
Table 4. Decision making about purchasing of Bulgur at home
Frequency Percentage (%)
My mother made decision to buy Bulgur in our house .
Fully Disagreed 65 22.3
Disagreed 110 37.8
No Idea 45 15.5
Agreed 45 15.5
Fully Agreed 26 8.9
My father made decision to buy Bulgur in our house .
Fully Disagreed 15 5.2
Disagreed 23 7.8
No Idea 29 10
Agreed 126 43.3
Fully Agreed 98 33.7
Nutritional value-health and bulgur consumption
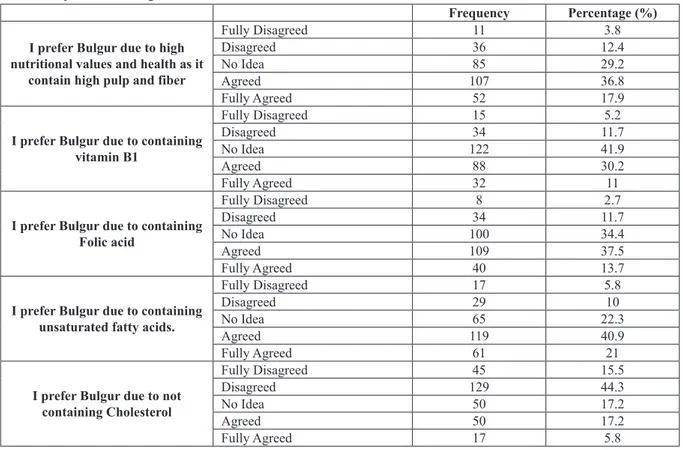
A number of questions about the importance of bulgur on nutritional values and health were asked to the consumers in this survey. These questions were about the preference of bulgur due to high pulp/fiber, B1 vitamin, folic acid, unsaturated fatty acids and no cholestrol. Results showed that majority of the consumers (54.7%) accepted the nutritional value of bulgur and its positive effects on health
(Table 5). However, most of the consumers had no idea about the role of these parameters mentioned above. Relatively high percentage of consumers gave either negative response or had no idea about the nutritional value or its effects on health. The possible reason might be unawareness due to low education level of the consumers about nutritional value of bulgur.
Table 5. Importance of Bulgur due to its nutritous values and its effects on health
Frequency Percentage (%)
I prefer Bulgur due to high nutritional values and health as it
contain high pulp and fiber
Fully Disagreed 11 3.8
Disagreed 36 12.4
No Idea 85 29.2
Agreed 107 36.8
Fully Agreed 52 17.9
I prefer Bulgur due to containing vitamin B1 Fully Disagreed 15 5.2 Disagreed 34 11.7 No Idea 122 41.9 Agreed 88 30.2 Fully Agreed 32 11
I prefer Bulgur due to containing Folic acid Fully Disagreed 8 2.7 Disagreed 34 11.7 No Idea 100 34.4 Agreed 109 37.5 Fully Agreed 40 13.7
I prefer Bulgur due to containing unsaturated fatty acids.
Fully Disagreed 17 5.8
Disagreed 29 10
No Idea 65 22.3
Agreed 119 40.9
Fully Agreed 61 21
I prefer Bulgur due to not containing Cholesterol Fully Disagreed 45 15.5 Disagreed 129 44.3 No Idea 50 17.2 Agreed 50 17.2 Fully Agreed 17 5.8
Consumption interval of bulgur
The consumption of bulgur frequency on Daily basis, once a week, once a fortnight or once a month was also enquired in this study and the response towards bulgur consumption frequency were varaible. More than half of the consumers (52.9 %) used bulgur on daily basis (Table
6); that showed the importance of bulgur in family diet
programe of the Karaman. Similarly, results about the consumption of bulgur once a week or fortnight also reflects
the high consumption of bulgur in Karaman. However, 74.7% consumers accepted that they prefer to eat bulgur at least once a month. The high consumption rate of bulgur in Karaman might also be due to its easy availibility, price and purchasing power of the consumers or inclusion of bulgur in lunch menu in university, school or private institutions.
Table 6. Frequency of bulgur Consumption
Frequency Percentage (%)
I use Bulgur everyday
Fully Disagreed 23 7.9
Disagreed 66 22.7
No Idea 48 16.5
Agreed 101 34.7
Fully Agreed 53 18.2
I use Bulgur once a week
Fully Disagreed 49 16.8
Disagreed 99 34
No Idea 45 15.5
Agreed 80 27.5
Fully Agreed 18 6.2
I use Bulgur once in 15 days
Fully Disagreed 83 28.5
Disagreed 105 36.1
No Idea 40 13.7
Agreed 45 15.5
Fully Agreed 18 6.2
I use Bulgur once a month
Fully Disagreed 8 2.7
Disagreed 26 8.9
No Idea 40 13.7
Agreed 131 45
Forms of Food made from bulgur
In this study, three questions were asked about the type of food prepared using bulgur. The preferences was for pilaff (cooked like rice), making soup or use in making other foods like meatballs or vegetable (pepper, vine or cabbage leaves) stuffing. 78.6% consumers used bulgur for making pilaff
whereas, 73.2% (Table 7) used bulgur for making other food stuffs like meatballs or stuffing. Very low percentage of consumers (27.5%) used bulgur for making soup. The main reason of using bulgur as pilaff or making other food stuffs is the high use of these products in daily food in Karaman.
Alternatives of Bulgur used
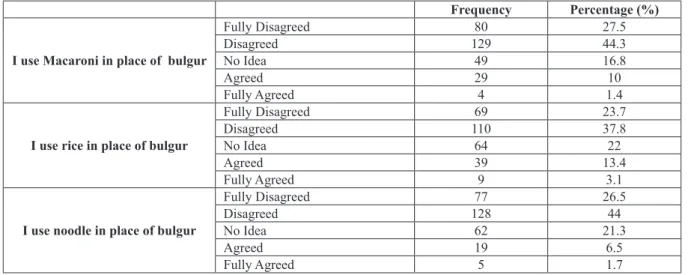
A number of questions were also asked about the competitors of bulgur in food chain of Karaman. These competitors were rice, macaroni and noodles. It was interesting to note that consumers preferred bulgur compared to rice, macaroni or noodles. The preference of
rice, macaroni and noodles over bulgur was recorded as 16.5%, 11.4% and 8.2% respectively (Table 8). This results showed the highly acceptance of bulgur in the kitchen of Karaman. Other reasons might be local production, taste or low price etc.
Table 7. Forms of Bulgur consumption
Frequency Percentage (%)
I consume bulgur as Pilaff
Fully Disagreed 14 4.8
Disagreed 29 10
No Idea 25 8.6
Agreed 163 56
Fully Agreed 60 20.6
I consume bulgur as soup
Fully Disagreed 35 12
Disagreed 103 35.4
No Idea 73 25.1
Agreed 64 22
Fully Agreed 16 5.5
I used Bulgur in dolma and meat balls Fully Disagreed 13 4.5 Disagreed 21 7.2 No Idea 44 15.1 Agreed 136 46.7 Fully Agreed 77 26.5
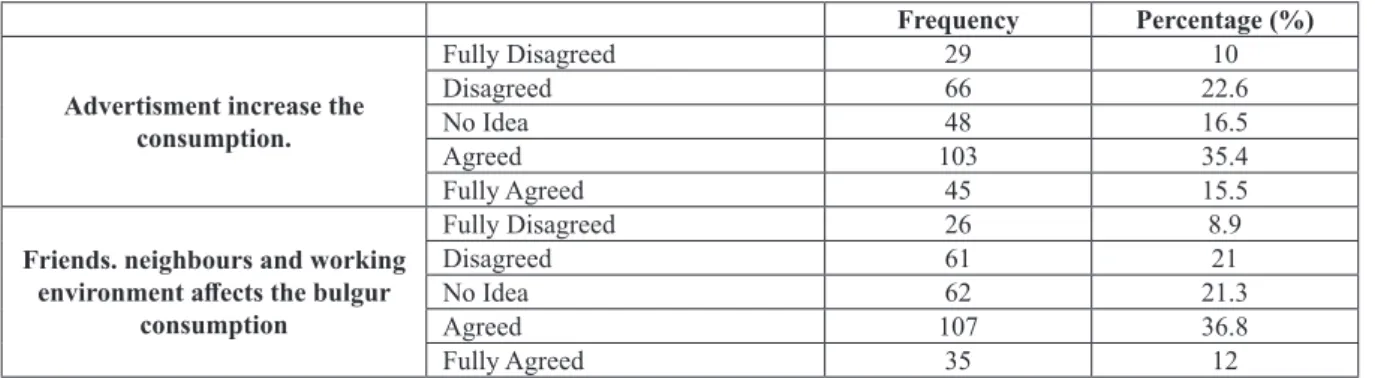
Role of Advertisement and community on bulgur consumption
In modern World, the role of electronic, printing and social media plays an important role in promoting products. The development of brand by mean of advertisement or by sharings their experience by the consumers to the specific product is very important and also affects the use of that
product. In this study, we asked about the role of advertisment and community on bulgur consumption irrespective of brand consciousness. The results were same for both questions; where almost 51 % and 49 % consumers accepted the role of advertisement and community on bulgur consumption (Table 9).
Table 8. Preferences substitute products instead of bulgur by Consumers
Frequency Percentage (%)
I use Macaroni in place of bulgur
Fully Disagreed 80 27.5
Disagreed 129 44.3
No Idea 49 16.8
Agreed 29 10
Fully Agreed 4 1.4
I use rice in place of bulgur
Fully Disagreed 69 23.7
Disagreed 110 37.8
No Idea 64 22
Agreed 39 13.4
Fully Agreed 9 3.1
I use noodle in place of bulgur
Fully Disagreed 77 26.5
Disagreed 128 44
No Idea 62 21.3
Agreed 19 6.5
Role of income and price on bulgur consuption
The results about the relative effects of family imncome and price of bulgur was also investigated in this study. 45% consumers agreed to this question whereas 55% answered no effect of income and price on bulgur consumption. This
might be due to the cheaper price of bulgur as almost 75% of the consumers were staisfied with the price. Whereas, only 25 % consumers complained for the high price of bulgur (Table 10).
Table 9. Effects of other Adverstising and community on purchasing bulgur
Frequency Percentage (%)
Advertisment increase the consumption. Fully Disagreed 29 10 Disagreed 66 22.6 No Idea 48 16.5 Agreed 103 35.4 Fully Agreed 45 15.5
Friends. neighbours and working environment affects the bulgur
consumption Fully Disagreed 26 8.9 Disagreed 61 21 No Idea 62 21.3 Agreed 107 36.8 Fully Agreed 35 12
Table 10. Effects of income and price on bulgur consumption
Frequency Percentage (%)
Bulgur consumption increase with low income
Fully Disagreed 32 11 Disagreed 71 24.4 No Idea 59 20.3 Agreed 102 35 Fully Agreed 27 9.3 Total 291 100
I find bulgur price expensive
Fully Disagreed 38 13.1
Disagreed 89 30.5
No Idea 89 30.6
Agreed 46 15.8
Fully Agreed 29 10
Role of selling places
Reliability and credibility of the prodcut and place where they are available for selling is also very important factor which reveals the quality of the final product. 60% consumers preferred to use their own made bulgur for
consumption. Similarly, 24 % consumers preferred to buy from shops, market or supermarkets which showed that making bulgur at home or farm is common practice in Karaman. 50% of consumers showed their trust on the local brand introduced by the regional süpermarkets (Table 11).
Table 11. Information about the place from where they purchase the bulgur
Frequency Percentage (%)
We produced Bulgur by ourselves
Fully Disagreed 11 3.8
Disagreed 29 10
No Idea 85 29.2
Agreed 120 41.2
Fully Agreed 46 15.8
I get Bulgur from shops. market or supermarkets Fully Disagreed 56 19.2 Disagreed 97 33.3 No Idea 71 24.4 Agreed 47 16.2 Fully Agreed 20 6.9
I always preferred to buy brand of bulgur belongs to supermarket
Fully Disagreed 18 6.2 Disagreed 49 16.8 No Idea 77 26.5 Agreed 96 33 Fully Agreed 51 17.5
CONCLUSION
The study presents the general overview of bulgur consumption in Karaman province on the basis of demographic and socio-economic factors. It was concluded that most the the consumers were farmers and civil workers with education level from university graduate to school education. Expiry date, brand and price were the main
factors and more than 82 % consumers paid attention to these factors prior to purchase. Similary, taste was also the important factor by the consumers. Packing and cooking time were the least attention paid factors by the consumers. Regarding gender, significantly high number of males in the family were found resposnible for purchasing decision. It was also noteable that most of the consumers in this study did not have sufficient knowledge about the nutritional
effects of bulgur on human health. However, consumers with higher education had knowledge about the nutritional effects which incresaed with the increase of their education. Minimum frquency of bulgur consumption was once a month. Most of the use of bulgur was in the form of Pilaff. This study is supposed to be helpful for determining the socio-economic factors responsible for bulgur consumption at Karaman. It is also highly recommended that consumers from the sorroundings of Karaman living in villages and towns must be included in the future studies. Furthermore, a comparative study must be designed in order to find the preference of bulgur due to highly variable demographic and socio-economic factors.
REFERENCES
[3] Bayram, M., Öner, M. D. ve Eren, F., 1996. Bulgur Üretiminin Bugünkü Durumu ve Sorunları. Gıda Teknolojisi Dergisi Sayı:8, s. 38-45.
[1] Bayram, M. ve Öner M. D., 2004. 2003’ de Bulgur Sektörü-1. Unlu Mamüller Teknolojisi 61, s. 23-29.
[4] Bayram, M., 2010. Bulgur Sektör Analizi ve Öngörüler. Miller Değirmenci Dergisi Sayı:20, s. 40-53.
[2] Bayram, M., Tiryakioğlu, A., Kayabaş, S., Duru, İ., Arslan, H., Koçak, E., Altıntaş, S., Baharoğlu, M., Dağyutan, A., Kılınç, İ. ve Balcı, F., 2010. Dünya’ da ve Türkiye’ de Bulgur Sanayinin Durumu, Üretim Teknolojisindeki Gelişmeler ve Sorunları-Çözüm Önerileri. Makarnalık Buğday ve Mamülleri Konferansı 17-18 Mayıs 2010. s. 33-41.
[6] Dönmez, E., Salantur, A.,Yazar, S.,Akar, T. ve Yıldırım, Y., 2004. Ülkemizde Bulgurun Yeri ve Bulgurluk Çeşit Geliştirme. Tarla Bitkileri Merkez Araştırma Enstitüsü Dergisi, s. 71-75.
[5] Kemahlıoğlu, K. ve Demirağ, K., 2010. İzmir Piyasasında Sunulan Bazı Bulgurların Türk Gıda Kodeksi Bulgur Tebliği ile Türk Standartları Enstitüsü Bulgur Standardı’ na Uyumlarının Karşılaştırılması. Akademik Gıda 8 (4), s. 29-34.
[7] Türksoy, S. ve Özkaya, B., 2004. Bulgurun Besin Değeri ve Prosesin Bileşim Üzerine Etkileri, Geleneksel Gıdalar Sempozyumu 23-24 Eylül 2004. Van, s. 329-333.
[8] Yıldız Akgümüş, Ş., 2010. Sivas İlinde Ekmek Tüketim Alışkanlıkları ve Üretici-Tüketici Dinamiklerinin Belirlenmesi. Yüksek Lisans Tezi, Atatürk Üniversitesi Fen Bilimleri Enstitüsü, Erzurum.