PANOECONOMICUS, 2019, Vol. 66, Issue 5, pp. 611-632 Recevied: 31 October 2016; Accepted: 26 June 2018.
UDC 339.72.053.1(4-672EU) https://doi.org/10.2298/PAN161031002A Original scientific paper
Ayşen Altun Ada
Corresponding author Dumlupinar University, Evliya Celebi Campus, Kutahya, Turkey
Sibel Çelik
Dumlupinar University, Evliya Celebi Campus, Kutahya, Turkey
Yasemin Deniz Koç
Dumlupinar University, Evliya Celebi Campus, Kutahya, Turkey
Testing for Financial Contagion:
New Evidence from the European
Debt Crisis
Summary: This paper tested for a contagion effect between the foreign
ex-change market of the Eurozone and the markets of seven emerging and growth leading economies - EAGLEs - during the European Debt Crisis. For this pur-pose, we used the daily domestic currency per unit of US Dollar of seven EA-GLEs countries from 01.01.2007 to 31.12.2012. The tranquil period was from 01.01.2007 to 19.10.2009 and the turmoil period was from 20.10.2009 to 31.12.2012. We found a contagion effect between the foreign exchange market of the Eurozone and the markets of Brazil, Mexico, and Turkey. The evidence suggests that foreign trade is likely to be the source of the contagion during the European Debt Crisis. The evidence presented in this paper is important for pol-icy makers, international investors, and portfolio managers.
Key words: Financial contagion, Economic crisis, European debt crisis,
DCC-GARCH.
JEL: E44, F31, G01.
The global crisis of 2008-2009, which was the biggest economic crisis since the Great Depression, started with the declaration by Bear Stearns, one of the biggest banks of the US, that two hedge funds had collapsed. This became a global liquidity crisis fol-lowing the bankruptcy of Lehman Brothers, one of the most important investment banks. Although the US mortgage market-based crisis was a credit crisis that initially only affected developed countries, it resulted in a European Debt Crisis (EDC) that later spilled over into developing countries and became severe, especially in 2010. The spillover effect of unanticipated local shocks that affect the expectations of investors, any adverse effect on the economic data of a country notwithstanding, in other coun-tries during periods of crisis is called pure contagion (Marcello Pericoli and Massimo Sbracia 2003). Kristin Forbes and Roberto Rigobon (2002) define contagion as an in-creasing correlation between markets during a crisis period. Because two markets are mutually correlated during periods of stability, contagion therefore exists if cross-ket co-movement increases significantly when a shock to one marcross-ket affects other mar-kets (Forbes and Rigobon 2002; Sibel Çelik 2012).
The aim of this study is to test for the contagion of EDC, which started in Greece and spilled over to the Eurozone, to emerging and growth leading economies -EAGLEs countries - and to reveal the channels of contagion. -EAGLEs, an economic
612 Ayşen Altun Ada, Sibel Çelik and Yasemin Deniz Koç
concept introduced by BBVA research in November 2010, refers to a group of coun-tries whose incremental GDP in the next 10 years is expected to be larger than the average of the G7 economies, excluding the US. EAGLEs consists of seven countries: Brazil, China, India, Indonesia, Mexico, Russia, and Turkey. This study differs from others in that it addresses the contagion spreading through foreign exchange markets and aims to detect the source, through international trade channels or financial chan-nels, and also examines its effects on EAGLEs. Focusing on foreign exchange markets reduces the problems caused by the differences in time zones of markets. The findings of the paper are important in terms of its influence on important decisions relating to monetary policy, asset allocation, risk management, capital adequacy, and asset pric-ing. This study also contributes to the literature in terms of methodology and interpre-tation of the findings, and provides useful insights for policy-makers in the field of international economics and finance.
The following chapter reviews the literature related to contagion of crises, the second chapter presents the study data, and the third chapter defines the methodology. The fourth chapter presents the analysis and key findings, which is then followed by suggestions and conclusions in the final chapter.
1. Literature Review
Contagion in financial markets may occur in different ways. If spillover is based on macro-economic fundamentals as a result of normal cross-market linkages, it is called fundamental-based contagion (Rudiger Dornbusch, Yung Chul Park, and Stijn Claessens 2000). If spillover occurs as a result of unverified market information and irrational investor behaviors, rather than macro-economic indicators, it is called herd behavior contagion (Thomas Moser 2003). If an increase in permanent and common interaction between asset prices arises from structural changes in the channels trans-mitting common shocks in periods of crisis, it is called change contagion (Nathaniel Frank and Heiko Hesse 2009). If contagion arises from behaviors, future expectations, or the decisions of several investors (who unconsciously influence each other) and becomes common behavior, it is called emotional contagion. If positive expectations are related to the spillover, it is called positive contagion, while negative expectations affecting investors’ vulnerability is known as negative contagion (Elaine Hatfield, John T. Cacioppo, and Richard L. Rapson 1994). The development of international commerce, liberalization policies in financial markets, the irrational emotional behav-ior of investors, and developments in information technologies have caused many dif-ferent positive and negative events to be triggered and extended across the markets. Therefore, identification of degrees of spillover and modes of contagion in terms of the negative impacts of crises spreading from one country to another has become one of the most important economic issues.
Following the economic crises at the end of the 1980s and the beginning of the 1990s, an extensive literature emerged that defined and reviewed contagion. The con-cept of contagion then began to be used more frequently in the literature, especially after the 1997-1998 Asian financial crisis. When the crisis in Thailand arose following devaluation in 1997, it penetrated Indonesia, Philippines, Malaysia, Hong Kong, and Korea. Knowing why the original crisis spilled over was therefore as important as
613 Testing for Financial Contagion: New Evidence from the European Debt Crisis
knowing what triggered the events in Thailand. Scholars argued that foreign currency crises may result in contagion through direct economic routes, such as bilateral com-mercial dealings, or through indirect linkages, such as changes in investor behavior. Some of the important statements on financial contagion were based on changes in investor behavior after the Russian crisis in 1998. This was followed by the global crisis of 2008-2009 which arose first in developed countries and then deeply affected both developed later and developing countries. A few years after the global crisis, EDC emerged as a huge global threat. During this period, the concept of contagion became increasingly prevalent in the literature, emphasizing that the developing countries are especially vulnerable to crisis due to their interdependent financial markets, the risks of banks, and real sector channels (Claessens and Forbes 2001; Joshua Aizenman et al. 2016).
Articles in the literature have tested for the existence of a contagion effect of economic crises in various financial markets such as Stock Exchange Markets, Foreign Exchange Markets, Bond Markets, Derivatives Markets, and Credit Default Swap Markets (Brian Boyer, Tomomi Kumagai, and Kathy Yuan 2006; Mardi Dungey et al. 2006; Neeltje Van Horen, Henk Jager, and Frank Klaassen 2006; Thomas C. Chiang, Bang Nam Jeon, and Huimin Li 2007; Sheng Chu Tai 2007; Jang Hyung Cho and Ali M. Parhizgari 2008; Virginie Coudert and Mathieu Gex 2008; Saleheen Khan and Kwang Woo Park 2009; Dimitris Kenourgios, Aristeidis Samitas, and Nikos Paltalidis 2011; Meriam Chihi Bouaziz, Nadhem Selmi, and Youness Boujelbene 2012; Kenour-gios and Puja Padhi 2012; Costas Karfakis and Theodore Panagiotidis 2015; Bong Han Kim, Hyeongwoo Kim, and Bong Soo Lee 2015). Several studies analyzed the spillo-ver mechanisms of crisis from one country to another in terms of international com-mercial linkages and real sectors other than financial markets (Paulo Horta, Carlos Mendes, and Isabel Vieira 2010; Dirk G. Baur 2012; Kenourgios and Dimitrios Di-mitriou 2014). Recent studies in contagion literature can be categorized as studies that only analyze the US global crisis (Baur 2012; Dimitriou, Kenourgios, and Theodore Simos 2013; Geert Bekaert et al. 2014; Horta, Sérgio Lagoa, and Luís Martin 2016), studies that only analyze EDC (Carlos Caceres, Vincenzo Guzzo, and Miguel Segovi-ano Basurto 2010; Go Tamakoshi, Yuki Toyoshima, and Shigeyuki Hamori 2012; Mark Mink and Jakob De Haan 2013; Samitas and Ioannis Tsakalos 2013; Tamakoshi and Hamori 2013) and studies that analyze both (Karfakis and Panagiotidis 2015; Aizenman et al. 2016). Some of these studies underline the fact that developing coun-tries are more vulnerable to shocks than developed councoun-tries, especially in periods of crisis (Kee Hong Bae, Andrew G. Karolyi, and Renee M. Stulz 2003; Kim, Kim, and Lee 2015; Aizenman et al. 2016), while others have aimed to reveal the relations be-tween markets during and after a crisis (Bouaziz, Selmi, and Boujelbene 2012; Karfakis and Panagiotidis 2015).
For instance, Kim, Kim, and Lee (2015) reviewed the US global crisis and aimed to identify the existence of a contagion effect in financial markets. The authors suggested a new approach that simultaneously estimated conditional correlation coef-ficient and the effects of temporal predictive factors in order to estimate the dynamic conditional correlation of financial asset returns. This enabled them to test the conta-gion spillover effect of the global crisis on developing Asian countries. Using the
614 Ayşen Altun Ada, Sibel Çelik and Yasemin Deniz Koç
MGARCH model, they concluded that foreign exchange markets have a stronger spill-over effect than the stock exchange market. Karfakis and Panagiotidis (2015), using the GARCH model and a dynamic conditional correlation method, analyzed three dif-ferent exchange rates to test for the effect of financial contagion on foreign exchange markets. Following the collapse of Lehman Brothers, they found financial contagion was present for foreign exchange markets. Horta, Lagoa, and Martin (2015) researched whether there was contagion from the NYSE Euronext group to the European Stock Exchange Market during the global crisis. They conducted their analysis using dy-namic conditional correlation and Copula models and identified financial contagion in all the stock exchange markets analyzed. They concluded that the market in France has a higher correlation than the markets in Belgium, the Netherlands, and Portugal. Beka-ert et al. (2014) examined the transfer of the 2007-2009 financial crisis to the industrial stock portfolios of 415 countries and found evidence of contagion arising from both the United States financial markets and the global financial sector, which resulted in a small impact on the stock portfolios. They concluded that there was considerable con-tagion in the domestic market stock portfolios of individual investors. Kenourgios, Di-mitriou, and Apostolas Cristopoluos (2013) analyzed the contagion effect of the 2007-2009 global financial crisis on numerous asset markets and several regions. They iden-tified an information channel that acted as a contagion mechanism among US stocks, real estate, commodities, and the emerging Brazilian market bond index. Using the DCC-GARCH model, Bouaziz, Selmi, and Boujelbene (2012) reviewed the contagion effects of the US stock market on the markets of developed countries during the eco-nomic crisis that originated from the US property market. They found that relations between the markets increased during the crisis and therefore it had spilled over into many markets. Alexander Chudik and Marcel Fratzscher (2012), using the VAR method, showed that investors secured themselves during the US crisis and financial capital was transferred from developing economies to the US bond market and other developed economies. Riadh Aloui, Mohamed Safouane Ben Aïssa, and Duc Khuong Nguyen (2011) investigated the scope of the current global crisis and its contagion effect by conducting an empirical review of BRIC countries’ excessive financial de-pendence on the United States. They found powerful evidence for time-varying inter-dependence between BRIC and US markets. To describe interinter-dependence between fi-nancial markets, Lalith P. Samarakoon (2011) created shock models examining the transfer of shocks induced by contagion of the US financial crisis between US and foreign markets. He identified major regional changes as well as significant bi-direc-tional, albeit asymmetric, interdependence and contagion between the US and emerg-ing markets, with dramatic variations in different regions.
Using a cross-country multiple indicator multiple cause model, Andrew K. Rose and Mark M. Spiegel (2010) sought to determine whether there was a contagion spillover of the 2008 financial crisis from the US to other countries using both financial and real channels. They could not find a strong relationship between international link-ages and the possibility of crisis. Wei Zhou (2017) examined the dynamic and asym-metric contagion reactions of financial markets caused by low-income group loans during the latest crisis and found that financial contagion reactions are predictive of changes in financial markets and can thus provide indications for risk management
615 Testing for Financial Contagion: New Evidence from the European Debt Crisis
during crisis periods. Kenourgios and Dimitriou (2014) analyzed the contagion effects of the crisis for the real sector as well as the financial sector. To do so, they conducted a regional and comparative analysis of the contagion effect of the global crisis on both sectors. The results showed that the global crisis affected all sector indexes in the US, while many regional sectors in Europe were not affected. Kenourgios and Dimitriou (2015) then investigated the contagion effects on ten sectors in six developed and developing regions during different phases of the crisis. They analyzed different finan-cial contagion channels between territories and real economy sectors using dynamic conditional correlation from the multivariate Fractional Integrated Asymmetric Power ARCH model. They found that the global financial crisis could be characterized by the effects of contagion between regional stock markets and financial and non-financial sectors.Baur (2012) explored the contagion effect of 2007-2009 global crises from the financial sector to the real economy by reviewing 10 sectors in the securities markets of 25 major developed and newly developing countries. Baur (2012) concluded that crises caused financial sector capitals to move increasingly “between countries” and “between financial sector and real economy capital”. Baur (2012) also concluded that sectors such as health, telecommunication, and technology are less affected by crises. Horta, Mendes, and Vieira (2010) compared the effects of contagion on the financial sector and the industrial sector by analyzing the effects of the NYSE - Euronext group on the European market during the US high interest rate crisis. They focused on the financial and industrial sectors in the stock exchange markets of four European coun-tries and concluded that contagion from the US high interest rate crisis spilled over into all the markets analyzed.
The methods used differ in literature related to EDC. Event study, copula mod-els, and the standard contagion test are all frequently used. The common ground in many studies regarding the crisis in European regions is a focus on the spillover modes of country-specific shocks to other countries. For instance, Mink and De Haan (2013) argue that the decline of credit rate in a country, statistically and economically, has a spillover effect on both countries and financial markets. They used an event study ap-proach to analyze the effects of credit rate decline in Greece on the stock returns of 48 commercial banks. They found that the news on Greece had not resulted in extraordi-nary returns, excluding the banks, whereas the news on the recovery package had re-sulted in extraordinary returns for Greece and other countries of the Eurozone who were highly in debt. Roberto A. De Santis (2014) conducted a similar study of how the credit rate decline in Greece affected other countries in the Eurozone using comple-mentary approaches. De Santis (2014) concluded that the spillover effect originating from Greece resulted in increases in exchange differences, increases in the need for foreign capital, and decreases in competitive capacity in countries with relatively poor financial fundamentals. Caceres, Guzzo, and Basurto (2010) established a spillover coefficient for 10 countries of the Eurozone by assessing the Eurozone spreads as spreads in common metric standard in government bond returns. They concluded that challenges in one country increase the possibility of a credit problem in other countries. A similar study, which sheds light on the spillover of country-specific shocks to other countries, was conducted by Albi Tola and Sebastien Walti (2015). Using a standard contagion test for 9 Eurozone countries, they discussed bond markets in connection
616 Ayşen Altun Ada, Sibel Çelik and Yasemin Deniz Koç
with country-specific shocks and developed an approach to distinguish global shocks and Eurozone shocks from country-specific shocks. They concluded that three-quar-ters of country-specific shocks spilled over into the Eurozone. Samitas and Tsakalos (2013) used an asymmetric dynamic conditional correlation model and copula function to search for correlation dynamics between Greek and European markets during the debt crisis. They found that the Greek Debt Crisis arose after the mortgage crisis with high interest rates and that the debt incurred by Greece had not affected European markets. They argued that a contagion effect was present in the collapse period, but this was not the case during the Greek Debt Crisis.
In comparative studies of the effects of the global crisis period and EDC, Aizen-man et al. (2016) reviewed the spillover effect of both crises on developing countries using event study methodology. They concluded that the global crisis clearly has a negative effect on stock markets and bond markets in developing countries; however, they could not establish a systematic model capturing the effect that news on the Eu-rozone crisis had on financial markets in developing countries. They therefore con-cluded that the Eurozone crisis was limited to the Union.
2. The Data and Crisis Period
2.1 The Data
This paper assesses the contagion effect between the foreign exchange market of Eu-rozone and the exchange markets of seven emerging and growth-leading economies (EAGLEs) during the EDC. For this purpose, the dataset includes the daily domestic currency per unit of US Dollar of seven EAGLEs countries: Brazil (BRL/USD), China (CNY/USD), India (INR/USD), Indonesia (IDR/USD), Mexico (MXN/USD), Russia (RUB/USD), and Turkey (TRY/USD). EUR/USD represents the domestic currency of the Eurozone since the first sign of EDC emerged in Greece for the period 01.01.2007-31.12.2012. There are several reasons for using foreign exchange market data to test the contagion effect. First, the foreign exchange market continuously operates 24 hours a day except for weekends and is the most liquid financial market in the world; this reduces the problem of different time zones between the countries. Second, most of the literature on contagion of crises has focused on the stock market, bond, or CDS market. Therefore, the evidence from foreign exchange markets contributes to the ex-isting literature.
2.2 Identification of Crisis Period
The detection of a crisis period in the literature is somewhat controversial. However, there are two main approaches to doing so (Dungey et al. 2011). The first method is based on ex post observation of events (Forbes and Rigobon 2002; Dungey et al. 2006; Dungey 2009). The second method is based on the threshold models (Barry Eichen-green, Rose, and Charles Wyplosz 1996; Julia Lowell, Carl Richard Neu, and Daochi Tong 1998; Carlo A. Favero and Francesco Giavazzi 2002). We used an event based approach to identify the crisis period and therefore identified 20 October 2009 as the beginning of the EDC. This date coincides with the day when the Greek Government announced that the public deficit of Greece was expected to be 12.5% of GDP,
617 Testing for Financial Contagion: New Evidence from the European Debt Crisis
although this was previously calculated as 6%. There are many papers in the literature which use this date as the beginning of EDC (Karfakis and Panagiotidis 2015). Con-sequently, the entire dataset in this paper runs from 01.01.2007 to 31.12.2012. The tranquil period is from 01.01.2007 to 19.10.2009 and the turmoil period is from 20.10.2009 to 31.12.2012.
2.3 Data Analysis
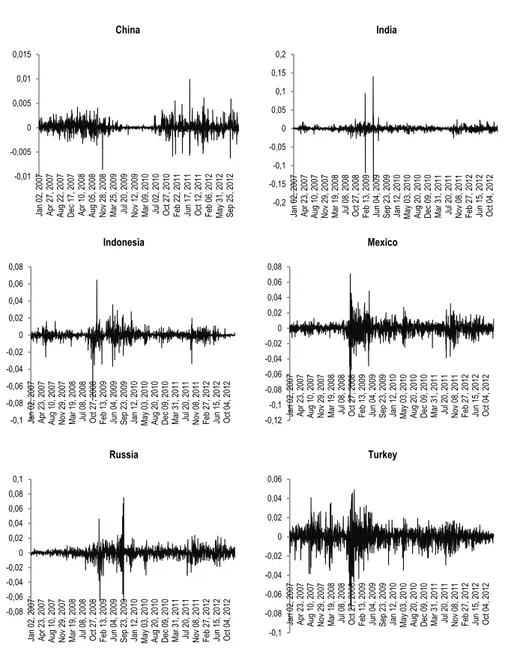
The return on domestic currencies is calculated as follows: 𝑙𝑛 𝑃 /𝑃 , where Pt is
the price level of domestic currency at time t. The graphs of price and return on do-mestic currencies are presented in Figure 1 and Figure 2 respectively.
0 0,5 1 1,5 2 Jan 01 , 2 007 Ap r 20, 20 07 Au g 09 , 20 07 N ov 2 8, 200 7 M ar 18 , 20 08 Ju l 07 , 20 08 Oct 2 4, 200 8 Feb 12 , 20 09 Jun 03 , 2 009 Se p 22 , 20 09 Jan 11 , 2 010 Ap r 30, 20 10 Au g 19 , 20 10 D ec 0 8, 201 0 M ar 30 , 20 11 Ju l 19 , 20 11 N ov 0 7, 201 1 Feb 24 , 20 12 Jun 14 , 2 012 Oct 0 3, 201 2 Eurozone 0 0,1 0,2 0,3 0,4 0,5 0,6 0,7 Jan 01 , 2 007 Ap r 20, 20 07 Au g 09 , 20 07 N ov 2 8, 200 7 M ar 18 , 20 08 Ju l 07 , 20 08 Oct 2 4, 200 8 Feb 12 , 20 09 Jun 03 , 2 009 Se p 22 , 20 09 Jan 11 , 2 010 Ap r 30, 20 10 Au g 19 , 20 10 D ec 0 8, 201 0 M ar 30 , 20 11 Ju l 19 , 20 11 N ov 0 7, 201 1 Feb 24 , 20 12 Jun 14 , 2 012 Oct 0 3, 201 2 Brazil 0 0,02 0,04 0,06 0,08 0,1 0,12 0,14 0,16 0,18 Jan 01 , 2 007 Ap r 20, 20 07 Au g 09 , 20 07 N ov 2 8, 200 7 M ar 18 , 20 08 Ju l 07 , 20 08 Oct 2 4, 200 8 Feb 12 , 20 09 Jun 03 , 2 009 Se p 22 , 20 09 Jan 11 , 2 010 Ap r 30, 20 10 Au g 19 , 20 10 D ec 0 8, 201 0 M ar 30 , 20 11 Ju l 19 , 20 11 N ov 0 7, 201 1 Feb 24 , 20 12 Jun 14 , 2 012 Oct 0 3, 201 2 China 0 0,005 0,01 0,015 0,02 0,025 0,03 Jan 01 , 2 007 Ap r 26, 20 07 Au g 21 , 20 07 D ec 1 4, 200 7 Ap r 09, 20 08 Au g 04 , 20 08 N ov 2 7, 200 8 M ar 24 , 20 09 Ju l 17 , 20 09 N ov 1 1, 200 9 M ar 08 , 20 10 Ju l 01 , 20 10 Oct 2 6, 201 0 Feb 21 , 20 11 Jun 16 , 2 011 Oct 1 1, 201 1 Feb 03 , 20 12 Ma y 30 , 20 12 Se p 24 , 20 12 India
618 Ayşen Altun Ada, Sibel Çelik and Yasemin Deniz Koç
Source: Authors’ calculations. Figure 1 Time Series of Domestic Currencies
0 0,00002 0,00004 0,00006 0,00008 0,0001 0,00012 0,00014 Jan 01 , 2 007 Ap r 26, 20 07 Au g 21 , 20 07 D ec 1 4, 200 7 Ap r 09, 20 08 Au g 04 , 20 08 N ov 2 7, 200 8 M ar 24 , 20 09 Ju l 17 , 20 09 N ov 1 1, 200 9 M ar 08 , 20 10 Ju l 01 , 20 10 Oct 2 6, 201 0 Feb 21 , 20 11 Jun 16 , 2 011 Oct 1 1, 201 1 Feb 03 , 20 12 Ma y 30 , 20 12 Se p 24 , 20 12 Indonesia 0 0,02 0,04 0,06 0,08 0,1 0,12 Jan 01 , 2 007 Ap r 20, 20 07 Au g 09 , 20 07 No v 28 , 2 007 M ar 18 , 20 08 Ju l 07 , 20 08 Oct 2 4, 200 8 Feb 12 , 20 09 Jun 03 , 2 009 Se p 22 , 20 09 Jan 11 , 2 010 Ap r 30, 20 10 Au g 19 , 20 10 De c 08 , 2 010 M ar 30 , 20 11 Ju l 19 , 20 11 No v 07 , 2 011 Feb 24 , 20 12 Jun 14 , 2 012 Oct 0 3, 201 2 Mexico 0 0,005 0,01 0,015 0,02 0,025 0,03 0,035 0,04 0,045 0,05 Jan 01 , 2 007 Ap r 26, 20 07 Au g 21 , 20 07 D ec 1 4, 200 7 Ap r 09, 20 08 Au g 04 , 20 08 N ov 2 7, 200 8 M ar 24 , 20 09 Ju l 17 , 20 09 N ov 1 1, 200 9 M ar 08 , 20 10 Ju l 01 , 20 10 Oct 2 6, 201 0 Feb 21 , 20 11 Jun 16 , 2 011 Oct 1 1, 201 1 Feb 03 , 20 12 Ma y 30 , 20 12 Se p 24 , 20 12 Russia 0 0,1 0,2 0,3 0,4 0,5 0,6 0,7 0,8 0,9 1 Jan 01 , 2 007 Ap r 20, 20 07 Au g 09 , 20 07 N ov 2 8, 200 7 M ar 18 , 20 08 Ju l 07 , 20 08 Oct 2 4, 200 8 Feb 12 , 20 09 Jun 03 , 2 009 Se p 22 , 20 09 Jan 11 , 2 010 Ap r 30, 20 10 Au g 19 , 20 10 D ec 0 8, 201 0 M ar 30 , 20 11 Ju l 19 , 20 11 N ov 0 7, 201 1 Feb 24 , 20 12 Jun 14 , 2 012 Oct 0 3, 201 2 Turkey -0,04 -0,03 -0,02 -0,01 0 0,01 0,02 0,03 0,04 0,05 Jan 02 , 2 007 Ap r 23, 20 07 Au g 10 , 20 07 N ov 2 9, 200 7 M ar 19 , 20 08 Ju l 08 , 20 08 Oct 2 7, 200 8 Feb 13 , 20 09 Jun 04 , 2 009 Se p 23 , 20 09 Jan 12 , 2 010 Ma y 03 , 20 10 Au g 20 , 20 10 D ec 0 9, 201 0 M ar 31 , 20 11 Ju l 20 , 20 11 N ov 0 8, 201 1 Feb 27 , 20 12 Jun 15 , 2 012 Oct 0 4, 201 2 Eurozone -0,1 -0,08 -0,06 -0,04 -0,02 0 0,02 0,04 0,06 0,08 0,1 Jan 02 , 2 007 Ap r 23, 20 07 Au g 10 , 20 07 N ov 2 9, 200 7 M ar 19 , 20 08 Ju l 08 , 20 08 Oct 2 7, 200 8 Feb 13 , 20 09 Jun 04 , 2 009 Se p 23 , 20 09 Jan 12 , 2 010 Ma y 03 , 20 10 Au g 20 , 20 10 D ec 0 9, 201 0 M ar 31 , 20 11 Ju l 20 , 20 11 N ov 0 8, 201 1 Feb 27 , 20 12 Jun 15 , 2 012 Oct 0 4, 201 2 Brazil
619 Testing for Financial Contagion: New Evidence from the European Debt Crisis
Source: Authors’ calculations. Figure 2 Time Series of Each Domestic Currency Return
Table 1 presents descriptive statistics for domestic currency returns over the tranquil period, turmoil period, and whole period, respectively. Except for Mexico and Russia, the means of the domestic currency returns during the tranquil period are higher than those during the turmoil period. Unexpectedly, except for China, the stand-ard deviations of the returns are higher in the tranquil period than those of the turmoil
-0,01 -0,005 0 0,005 0,01 0,015 Jan 02 , 2 007 Ap r 27, 20 07 Au g 22 , 20 07 D ec 1 7, 200 7 Ap r 10, 20 08 Au g 05 , 20 08 N ov 2 8, 200 8 M ar 25 , 20 09 Ju l 20 , 20 09 N ov 1 2, 200 9 M ar 09 , 20 10 Ju l 02 , 20 10 Oct 2 7, 201 0 Feb 22 , 20 11 Jun 17 , 2 011 Oct 1 2, 201 1 Feb 06 , 20 12 Ma y 31 , 20 12 Se p 25 , 20 12 China -0,2 -0,15 -0,1 -0,05 0 0,05 0,1 0,15 0,2 Ja n 0 2, 20 07 Ap r 23, 20 07 Au g 10 , 20 07 No v 29 , 2 007 M ar 19 , 20 08 Ju l 08 , 20 08 Oct 2 7, 200 8 Feb 13 , 20 09 Ju n 0 4, 20 09 Se p 23 , 20 09 Ja n 1 2, 20 10 Ma y 03 , 20 10 Au g 20 , 20 10 De c 09 , 2 010 M ar 31 , 20 11 Ju l 20 , 20 11 No v 08 , 2 011 Feb 27 , 20 12 Ju n 1 5, 20 12 Oct 0 4, 201 2 India -0,1 -0,08 -0,06 -0,04 -0,02 0 0,02 0,04 0,06 0,08 Jan 02 , 2 007 Ap r 23, 20 07 Au g 10 , 20 07 N ov 2 9, 200 7 M ar 19 , 20 08 Ju l 08 , 20 08 Oct 2 7, 200 8 Feb 13 , 20 09 Jun 04 , 2 009 Se p 23 , 20 09 Jan 12 , 2 010 Ma y 03 , 20 10 Au g 20 , 20 10 D ec 0 9, 201 0 M ar 31 , 20 11 Ju l 20 , 20 11 N ov 0 8, 201 1 Feb 27 , 20 12 Jun 15 , 2 012 Oct 0 4, 201 2 Indonesia -0,12 -0,1 -0,08 -0,06 -0,04 -0,02 0 0,02 0,04 0,06 0,08 Jan 02 , 2 007 Ap r 23, 20 07 Au g 10 , 20 07 N ov 2 9, 200 7 M ar 19 , 20 08 Ju l 08 , 20 08 Oct 2 7, 200 8 Feb 13 , 20 09 Jun 04 , 2 009 Se p 23 , 20 09 Jan 12 , 2 010 Ma y 03 , 20 10 Au g 20 , 20 10 D ec 0 9, 201 0 M ar 31 , 20 11 Ju l 20 , 20 11 N ov 0 8, 201 1 Feb 27 , 20 12 Jun 15 , 2 012 Oct 0 4, 201 2 Mexico -0,08 -0,06 -0,04 -0,02 0 0,02 0,04 0,06 0,08 0,1 Jan 02 , 2 007 Ap r 23, 20 07 Au g 10 , 20 07 N ov 2 9, 200 7 M ar 19 , 20 08 Ju l 08 , 20 08 Oct 2 7, 200 8 Feb 13 , 20 09 Jun 04 , 2 009 Se p 23 , 20 09 Jan 12 , 2 010 Ma y 03 , 20 10 Au g 20 , 20 10 D ec 0 9, 201 0 M ar 31 , 20 11 Ju l 20 , 20 11 N ov 0 8, 201 1 Feb 27 , 20 12 Jun 15 , 2 012 Oct 0 4, 201 2 Russia -0,1 -0,08 -0,06 -0,04 -0,02 0 0,02 0,04 0,06 Jan 02 , 2 007 Ap r 23, 20 07 Au g 10 , 20 07 N ov 2 9, 200 7 M ar 19 , 20 08 Ju l 08 , 20 08 Oct 2 7, 200 8 Feb 13 , 20 09 Jun 04 , 2 009 Se p 23 , 20 09 Jan 12 , 2 010 Ma y 03 , 20 10 Au g 20 , 20 10 D ec 0 9, 201 0 M ar 31 , 20 11 Ju l 20 , 20 11 N ov 0 8, 201 1 Feb 27 , 20 12 Jun 15 , 2 012 Oct 0 4, 201 2 Turkey
620 Ayşen Altun Ada, Sibel Çelik and Yasemin Deniz Koç
period. According to the Jarque-Bera test, none of the time series of currency returns show normal distribution in all periods.
Table 1 Descriptive Statistics for Domestic Currencies Tranquil period: (01.01.2007 to 19.10.2009)
Country Mean Median Maximum Minimum Std. dev. Skewness Kurtosis JB
Eurozone 0.000172 0.000283 0.036720 -0.029330 0.007305 0.168216 5.438228 184.2685*** Brazil 0.000306 0.000938 0.083363 -0.071210 0.014200 -0.391060 8.862429 1060.968*** China 0.000186 0.000042 0.004209 -0.008610 0.001050 -0.542790 10.64771 1814.839*** India -0.000074 -0.000052 0.140061 -0.140770 0.011077 -0.852440 97.50885 271767.7*** Indonesia 0.000059 0.000000 0.064710 -0.076170 0.007313 -0.906760 30.78165 23576.22*** Mexico -0.000247 0.000125 0.071022 -0.097000 0.010965 -1.144120 19.59725 8538.104*** Russia -0.000148 0.000174 0.075279 -0.064720 0.009065 0.105211 26.42603 16693.37*** Turkey 0.000034 0.000525 0.049136 -0.076250 0.012701 -0.688630 8.196097 878.9283*** Turmoil period: (20.10.2009 to 31.12.2012 )
Country Mean Median Maximum Minimum Std. dev. Skewness Kurtosis JB
Eurozone -0.000148 0.000000 0.023251 -0.022760 0.006758 -0.101810 3.545439 11.76497*** Brazil -0.000186 0.000000 0.040444 -0.079050 0.008615 -0.899810 13.63026 4034.534*** China 0.000108 0.000000 0.009912 -0.006250 0.001228 0.464254 13.61603 3941.555*** India -0.000189 0.000000 0.024178 -0.025480 0.005309 0.027502 5.242272 174.6109*** Indonesia -0.000033 0.000000 0.027539 -0.033870 0.004145 -0.310090 12.22785 2968.874*** Mexico 0.000016 0.000364 0.032165 -0.038580 0.007671 -0.397530 5.391027 220.3678*** Russia -0.000056 0.000164 0.024094 -0.031140 0.006620 -0.314300 5.425390 217.8872*** Turkey -0.000235 0.000334 0.019794 -0.034770 0.006925 -0.601820 4.757048 157.4355*** Whole period: (01.01.2007 to 31.12.2012 )
Country Mean Median Maximum Minimum Std. dev. Skewness Kurtosis JB
Eurozone -0.000000 0.000146 0.036720 -0.029333 0.007016 0.046046 4.617858 171.1241*** Brazil 0.000026 0.000305 0.083363 -0.079050 0.011579 -0.506786 11.56925 4852.269*** China 0.000144 0.000000 0.009912 -0.008606 0.001148 0.093449 12.88403 6368.670*** India -0.000044 0.000000 0.064710 -0.076165 0.005839 -0.893827 36.95892 75358.98*** Indonesia -0.000139 0.000000 0.140061 -0.140771 0.008500 -0.861948 131.4702 1075743.0*** Mexico -0.000112 0.000280 0.071022 -0.097000 0.009352 -0.990086 18.60405 16122.72*** Russia -0.000095 0.000179 0.075279 -0.064722 0.007853 -0.031280 23.31663 26898.81*** Turkey -0.000148 0.000393 0.049136 -0.076248 0.010042 -0.736613 10.32391 3636.959***
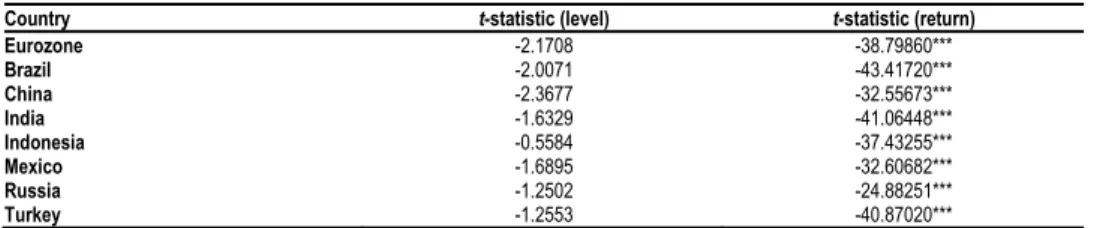
Source: Authors’ calculations. Because this paper uses a time series dataset, it is crucial to test the stationary of variables; therefore we applied a ADF (Augmented Dickey-Fuller) test before esti-mation of the DCC-GARCH model. The findings are shown in Table 2. According to the findings, none of the series are stationary at level. We then tested the stationary of the return series and concluded that all return series are stationary. Therefore, we used a return series to test for the contagion effect.
Table 2 Stationary Test: The Findings of the ADF Unit Root Test
Country t-statistic (level) t-statistic (return)
Eurozone -2.1708 -38.79860*** Brazil -2.0071 -43.41720*** China -2.3677 -32.55673*** India -1.6329 -41.06448*** Indonesia -0.5584 -37.43255*** Mexico -1.6895 -32.60682*** Russia -1.2502 -24.88251*** Turkey -1.2553 -40.87020***
Notes: *** denotes the rejection of the null hypothesis (variables have a unit root) of ADF unit root test at the 1% significance level. James G. MacKinnon (1996) critical values are -3.4343, -2.8631, -2.5676 for 1%, 5% and 10% levels, respectively.
621 Testing for Financial Contagion: New Evidence from the European Debt Crisis
3. Econometric Methodology
Many different methods have been used in the literature to assess the contagion effect of the financial crisis. These include probit-logit models (Eichengreen, Rose, and Wy-plosz 1996), regime switching models (Giampiero M. Gallo and Edoardo Otranto 2008), the copula approach (Juan Carlos Rodriguez 2007), and the heteroscedasticity-adjusted correlation measure (Forbes and Rigobon 2002). As an alternative to these tests, Sabur Mollah, Goran Zafirov, and Shahiduzzaman A. M. M. Quoreshi (2014) used GARCH based contagion tests while Alexei G. Orlov (2009) analysed contagion using Fourier’s analysis which decomposes the covariance into different frequency levels and estimates contagion as the change in the high-frequency components of the covariance between crisis and non-crisis periods. Vincent Bodart and Bertrand Cande-lon (2009) used a Vector Autoregressive (VAR) model and developed a contagion test based on a causality measure for different frequencies. Marco Gallegati (2012) used wavelet analysis to test the contagion effect. Aviral Kumar Tiwari, Mihai Ioan Mu-tascu, and Claudiu Tiberiu Albulescu (2016) used a continuous wavelet transform to test the level of co-movements, contagion, and rolling correlation between stock mar-kets.
In this paper, we use the DCC-GARCH model of Robert Engle (2002) to test for the existence of contagion during EDC. This model has four advantages over other estimation methods. First, it estimates correlation coefficients of the standardized re-siduals and thus accounts for heteroscedasticity directly. Second, the model allows us to detect changes in conditional correlations over time. Unlike the volatility-adjusted cross-market correlations employed in Forbes and Rigobon (2002), the DCC-GARCH model continuously adjusts the correlation for time-varying volatility. Third, the model allows us to include additional independent variables in the mean equation to ensure that the model is well specified. Fourth, the multivariate GARCH model can be used to examine multiple asset returns without adding too many parameters (Krishna Reddy Chittedi 2015). Hence, DCC provides a superior correlation measure (Cho and Parhi-zgari 2008).
The DCC-GARCH model is estimated in two steps, the first is a series of uni-variate GARCH estimates and the second the correlation estimate.
This paper uses the DCC-GARCH (1,1) model and, in the first step, the follow-ing regression has been estimated from which the residual returns will be obtained.
𝑟 = 𝛼 + 𝛼 𝑟 + 𝜀 . (1)
In Equation (1), 𝑟 is vector of asset returns and 𝜀 is vector of regression resid-uals. In the second step, the GARCH (1,1) model which is given in Equation (2), is estimated.
ℎ = 𝛽 + 𝛽 𝜀 + 𝛽 ℎ ,
𝛽 > 0
1 0𝛽 ≥ 0. (2)In the third step, the DCC-GARCH model is estimated as follows:
622 Ayşen Altun Ada, Sibel Çelik and Yasemin Deniz Koç
where 𝐻 is the multivariate conditional variance at time t, 𝑅 is a 𝑁 × 𝑁 symmetric dynamic correlations matrix at time t, and 𝐷 is a diagonal matrix of conditional stand-ard deviations of residual returns, obtained from estimating a univariate GARCH (1,1) model.
For a pair of markets, i and j, the dynamic conditional correlations are estimated as in Equation (4):
𝑄 = 1 − 𝛾 − 𝜃 𝑄 + 𝜃𝑄 + 𝛾𝜀, 𝜀, ,;
𝑅 = 𝑄∗ 𝑄 𝑄∗ , (4)
where 𝑄 = 𝑞 , is 𝑁 × 𝑁 time varying covariance matrix of standardized resid-uals, 𝑄 is the unconditional correlations of 𝜀, 𝜀, and 𝛾 and 𝜃 are non-negative scalar parameters that satisfy 𝛾 + 𝜃 < 1. In the DCC-GARCH model, as new information comes to the market, correlation coefficients change over time. When the new infor-mation decays, the correlation coefficients will revert to a long-run average. The two parameters, 𝛾 and 𝜃 of the DCC-GARCH model indicate the speed of this adjustment to new information (Yang Ding and Andrew Schwert 2010).
Therefore, for a pair of markets i and j the conditional correlation at time 𝑡 can be defined as:
𝜌 , =
̄ , , ,
̄ , , / ̄ , , /
, (5)
where 𝑞 is the element on the 𝑖 line and 𝑗 column of the matrix 𝑄 . The parame-ters are estimated using the maximum likelihood method. The log-likelihood of the estimators is given in Equation (6):
𝐿 = − ∑ 𝑛 𝑙𝑜𝑔 2𝜋 + 2 𝑙𝑜𝑔|𝐷 | + 𝑙𝑜𝑔|𝑅 | + +𝜀 𝑅 𝜀 . (6) In Equation (6), n is the number of equations and T is the number of observa-tions.
Following the estimation of the DCC-GARCH (1,1) model, we use t-tests to identify significant differences in the mean between the tranquil and turmoil periods using dynamic conditional correlation coefficients.
4. Empirical Findings
4.1 Detecting the Contagion Effect
Figure 3 shows the graph of DCC coefficients for the entire period.
Table 3 shows the unconditional correlations and the mean of DCC coefficients in the tranquil and turmoil periods. This shows that unconditional correlations increase in all countries in the turmoil period, except for Indonesia and Mexico. Similarly, DCC coefficients increase in all countries in the turmoil period except for China and Russia. Based on the increase in DCC mean values in percentage terms, Mexico and Turkey seem to be the most influenced by contagion effects during EDC. However, it is nec-essary to check whether DCC coefficients are statistically different in tranquil and
623 Testing for Financial Contagion: New Evidence from the European Debt Crisis
turmoil periods. Therefore we employed a t-test to identify the existence of contagion, the findings of which are presented in Table 4.
Source: Authors’ calculations. Figure 3 Graph of DCC Coefficients
0 0,1 0,2 0,3 0,4 0,5 0,6 4. 01. 200 7 4. 06. 200 7 4. 11. 200 7 4. 04. 200 8 4. 09. 200 8 4. 02. 200 9 4. 07. 200 9 4. 12. 200 9 4. 05. 201 0 4. 10. 201 0 4. 03. 201 1 4. 08. 201 1 4. 01. 201 2 4. 06. 201 2 4. 11. 201 2 Eurozone-Brazil 0 0,1 0,2 0,3 0,4 0,5 0,6 4. 01. 200 7 4. 06. 200 7 4. 11. 200 7 4. 04. 200 8 4. 09. 200 8 4. 02. 200 9 4. 07. 200 9 4. 12. 200 9 4. 05. 201 0 4. 10. 201 0 4. 03. 201 1 4. 08. 201 1 4. 01. 201 2 4. 06. 201 2 4. 11. 201 2 Eurozone-China 0 0,05 0,1 0,15 0,2 0,25 0,3 0,35 4. 01. 200 7 4. 06. 200 7 4. 11. 200 7 4. 04. 200 8 4. 09. 200 8 4. 02. 200 9 4. 07. 200 9 4. 12. 200 9 4. 05. 201 0 4. 10. 201 0 4. 03. 201 1 4. 08. 201 1 4. 01. 201 2 4. 06. 201 2 4. 11. 201 2 Eurozone-Indonesia -0,1 0 0,1 0,2 0,3 0,4 0,5 0,6 0,7 4. 01. 200 7 4. 06. 200 7 4. 11. 200 7 4. 04. 200 8 4. 09. 200 8 4. 02. 200 9 4. 07. 200 9 4. 12. 200 9 4. 05. 201 0 4. 10. 201 0 4. 03. 201 1 4. 08. 201 1 4. 01. 201 2 4. 06. 201 2 4. 11. 201 2 Eurozone-Mexico -0,4 -0,2 0 0,2 0,4 0,6 0,8 1 4. 01. 200 7 4. 06. 200 7 4. 11. 200 7 4. 04. 200 8 4. 09. 200 8 4. 02. 200 9 4. 07. 200 9 4. 12. 200 9 4. 05. 201 0 4. 10. 201 0 4. 03. 201 1 4. 08. 201 1 4. 01. 201 2 4. 06. 201 2 4. 11. 201 2 Eurozone-Russia -0,4 -0,2 0 0,2 0,4 0,6 0,8 1 4. 01. 200 7 4. 06. 200 7 4. 11. 200 7 4. 04. 200 8 4. 09. 200 8 4. 02. 200 9 4. 07. 200 9 4. 12. 200 9 4. 05. 201 0 4. 10. 201 0 4. 03. 201 1 4. 08. 201 1 4. 01. 201 2 4. 06. 201 2 4. 11. 201 2 Eurozone-Turkey
624 Ayşen Altun Ada, Sibel Çelik and Yasemin Deniz Koç
Table 3 Unconditional Correlations and Mean of DCC Correlations
Unconditional correlation Dynamic conditional correlation
Pre-crisis Crisis Difference (%) Pre-crisis Crisis Difference (%)
Brazil 0.3210 0.6108 90.28 0.3767 0.3957 5.01 China 0.3203 0.4830 50.80 0.3356 0.2167 -35.43 India 0.0405 0.2535 525.93 0.0472 0.0483 2.31 Indonesia 0.1712 0.1367 -20.15 0.1996 0.2014 0.87 Mexico 0.3426 0.0336 -90.19 0.3051 0.4932 61.66 Russia 0.3863 0.6520 68.78 0.6907 0.6240 -9.65 Turkey 0.4179 0.5142 23.04 0.3846 0.5661 47.19
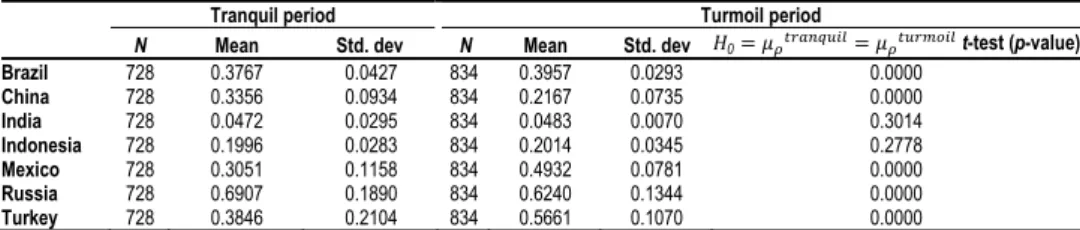
Source: Authors’ calculations. Table 4 presents the findings of t-tests used to identify the contagion effect. In this table, we cannot reject the null hypothesis as the mean of DCC coefficients are the same. Therefore, there is no contagion effect in tranquil and turmoil periods for China, India, Indonesia, and Russia. However, we reject the null hypothesis that there is no contagion for Brazil, Mexico, and Turkey. Therefore, we find evidence of the conta-gion effect between the Eurozone and three of the seven foreign exchange markets during EDC.
Table 4 Contagion Test: Test of the Mean Differences of the Estimated DCC Coefficients
Tranquil period Turmoil period
N Mean Std. dev N Mean Std. dev 𝐻0= 𝜇 = 𝜇 t-test (p-value)
Brazil 728 0.3767 0.0427 834 0.3957 0.0293 0.0000 China 728 0.3356 0.0934 834 0.2167 0.0735 0.0000 India 728 0.0472 0.0295 834 0.0483 0.0070 0.3014 Indonesia 728 0.1996 0.0283 834 0.2014 0.0345 0.2778 Mexico 728 0.3051 0.1158 834 0.4932 0.0781 0.0000 Russia 728 0.6907 0.1890 834 0.6240 0.1344 0.0000 Turkey 728 0.3846 0.2104 834 0.5661 0.1070 0.0000
Source: Authors’ calculations. 4.2 Channels of Contagion
This study has therefore identified a contagion effect between the Eurozone and the foreign exchange markets of Brazil, Mexico, and Turkey during EDC. In the next stage, we aimed to establish by which channel; financial or foreign trade, EDC has been transferred. For this purpose, we first examined a variance-covariance matrix among the Eurozone, Brazil, Mexico, and Turkey. We then analysed foreign trade data from Brazil, Mexico, Turkey, Greece, and the EU to determine the channel of conta-gion.
4.2.1 Financial Channels
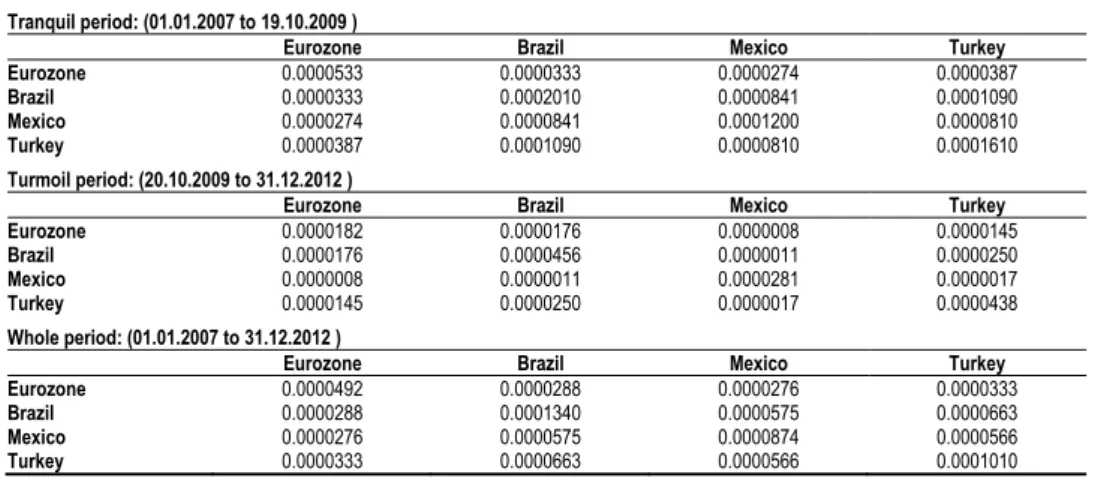
We investigated whether the transfer of crisis was through financial linkages. For this purpose, we analysed variance and covariance among the foreign exchange markets of Eurozone, Brazil, Mexico, and Turkey. The empirical findings are presented in Table 5.
Table 5 shows that variances and covariances among the foreign exchange mar-kets of countries are lower in the turmoil period than in the tranquil period. For exam-ple, while the variances of Brazil, Mexico, Turkey in the tranquil period are 0.02%, 0.012% and 0.016% respectively, in the turmoil period they are 0.0045%, 0.0028%
625 Testing for Financial Contagion: New Evidence from the European Debt Crisis
and 0.0043%, respectively. Similarly, while the covariances of Brazil and the Euro-zone, Mexico and the EuroEuro-zone, and Turkey and the Eurozone in the tranquil period are 0.0033%, 0.0027% and 0.0038% respectively, in the turmoil period they are 0.0017%, 0.00008% and 0.0014%, respectively.
Table 5 Variance and Covariances Tranquil period: (01.01.2007 to 19.10.2009 )
Eurozone Brazil Mexico Turkey
Eurozone 0.0000533 0.0000333 0.0000274 0.0000387
Brazil 0.0000333 0.0002010 0.0000841 0.0001090
Mexico 0.0000274 0.0000841 0.0001200 0.0000810
Turkey 0.0000387 0.0001090 0.0000810 0.0001610
Turmoil period: (20.10.2009 to 31.12.2012 )
Eurozone Brazil Mexico Turkey
Eurozone 0.0000182 0.0000176 0.0000008 0.0000145
Brazil 0.0000176 0.0000456 0.0000011 0.0000250
Mexico 0.0000008 0.0000011 0.0000281 0.0000017
Turkey 0.0000145 0.0000250 0.0000017 0.0000438
Whole period: (01.01.2007 to 31.12.2012 )
Eurozone Brazil Mexico Turkey
Eurozone 0.0000492 0.0000288 0.0000276 0.0000333
Brazil 0.0000288 0.0001340 0.0000575 0.0000663
Mexico 0.0000276 0.0000575 0.0000874 0.0000566
Turkey 0.0000333 0.0000663 0.0000566 0.0001010
Source: Authors’ calculations. If contagion occurs due to financial linkages among the countries, the covari-ance structure should be higher in turmoil periods. However, Table 5 shows that co-variance between countries decreases in the turmoil period. Therefore, the empirical evidence suggests that financial linkages are not the source of contagion between the Eurozone and Brazil, Mexico, and Turkey. In the next stage, we investigate whether the contagion is due to foreign trade channels.
4.2.2 Foreign Trade Channels
The US crisis that began in 2008 is responsible for the Greek crisis, which is the be-ginning of the EDC. The existence of structural problems such as high public expendi-ture and the fragile strucexpendi-ture of the markets in member states of the European Union (EU) triggered the debt crisis. It is argued that EDC differs from the global crisis in that its extent was limited to Europe (Aizenman et al. 2016) and that Greece played a similar role to the Lehman Brothers in the high credit interest rate crisis (Samitas and Tsakalos 2013). However, when considered in relation to developing countries, both crises represent big external shocks spilling over from developed economies. The in-tegration level of financial markets meant that the credit crunch effect of the developed countries was felt on the foreign trade volumes of all countries through finance. The effect of a decrease in consumer demand in developed countries can now be felt im-mediately on the production of developing countries. Global goods exportation, which was 15.5 trillion dollars in 2008, decreased by 23% in 2009. Global goods exportation of EAGLEs countries decreased by 25.71% in 2009. As a result of deteriorating finan-cial conditions and declining total demand from 2009-2012, the share of countries in global foreign trade and international trade volume has decreased.
626 Ayşen Altun Ada, Sibel Çelik and Yasemin Deniz Koç
An answer to the question regarding how EDC is transferred is now sought. For this purpose, the foreign trade figures of Brazil, Mexico, and Turkey were tabulated and compared with the foreign trade figures of the EU. The mutual exports and imports for each country were proportioned to total export and import amounts using data at Trade Map (2016)1. As shown in Table 6, the EU constituted 21.22% of Brazil’s total exports in the period 2009-2012. Although EDC is felt more in the Eurozone the mem-ber states of the EU are taken into consideration rather than the 19 Eurozone countries as the crisis affected all member states of the EU. In addition, although there are 28 member states of the EU as of 2013, there were only 27 EU member states during the period of analysis for this study. Brazil’s total imports from the EU are 21.49%. Brazil and the EU are therefore important markets for each other. It should be noted that this share was 24.74% in the decade before the crisis and so the amount of exports from Brazil to the EU, one of its most important trade partners, proportionally decreased. During this process, Brazil increased agricultural and biodiesel production and tried to increase its exports in other markets. Thus, Brazil could compensate for the decrease in iron-steel and crude oil items. It can be concluded that the mode of transfer and contagion effect of the EDC from Europe to Brazil evolved out of commercial rela-tions.
Table 6 Brazil’s Foreign Trade Data between 2009 and 2012 (%)
Exports to EU Imports from EU
2009 22.28 22.90
2010 21.76 21.17
2011 20.69 20.52
2012 20.15 21.37
Source: Authors’ calculations. In Table 7, Mexico’s total export and import rates show that its commercial relations with member states of the EU are by no means weak. The EU constitutes 5.34% of Brazil’s total exports and 11.06% of Brazil’s total imports. Mexico’s econ-omy went into recession as a result of constrictions in export opportunities to the US, which is its most important export market, despite market diversification efforts in 2009. The factor that affected deceleration of the rate of increase in Mexico’s total export revenues was the US crisis, starting in 2008, which was behind the EDC, and the effects of the crisis then continued with a long-term decrease in demand. When foreign trade relations with the EU are taken into consideration, it is quite likely that the contagion effect resulted from commercial relations.
Table 7 Mexico’s Foreign Trade Data between 2009 and 2012 (%)
Exports to EU Imports from EU
2009 5.08 11.65
2010 4.85 10.80
2011 5.48 10.75
2012 5.94 11.04
Source: Authors’ calculations.
1 Trade Map. 2016. Trade Statistics for International Business Development.
627 Testing for Financial Contagion: New Evidence from the European Debt Crisis
In Table 8, export and import data for Turkey are compared to those of the EU for 2009-2012. Their shares in total export and imports are proportionally presented. The table shows that 45% of Turkey’s total exports are made to the member states of the EU. Given that this share was 56.46% in the decade before the crisis, this represents a significant decrease. The total import rate of Turkey from the EU is 38.51%. Signif-icant decreases in the export of motor land vehicles, trailers, and iron-steel products from Turkey to the EU, which is a market that comprises half of Turkey’s foreign trade, shows that Turkey was affected by the crises through its foreign trade channel. Table 8 Turkey’s Foreign Trade Data between 2009 and 2012 (%)
Exports to EU Imports from EU
2009 46.76 40.19
2010 47.12 38.97
2011 46.97 37.87
2012 39.49 37.00
Source: Authors’ calculations. The EU is the most important foreign trading partner of Turkey and Brazil, both of which were included for the first time in the countries specified as the “fragile five” by Morgan Stanley in August 2013. There is therefore a high possibility of contagion to Turkey, Mexico, and Brazil through foreign trade channels. The analysis of foreign trade data thus provides strong evidence to show that EDC has infected other countries by means of EU trade.
5. Summary and Conclusion
This paper tested for the existence of financial contagion in foreign exchange markets during the EDC using the DCC-GARCH (1,1) model. The sample comprised seven countries: Brazil, China, India, Indonesia, Mexico, Russia and Turkey, known as EA-GLEs countries in the literature. We found evidence of contagion during EDC between the foreign exchange market of the Eurozone and the markets of Brazil, Mexico, and Turkey. However, we could not find any evidence of contagion between the foreign exchange market of the Eurozone and the markets of China, India, Indonesia and Rus-sia.
Only a few years after the USA precipitated global crises, the world economy had to face the EDC, the second phase of the financial crises caused by developed economies. EDC could affect emerging countries in two ways. The first is a decrease in credits and bad news from the EU which affects financial markets. This is the finan-cial impact of the crisis. Furthermore, because the EU is an important commerfinan-cial partner of numerous emerging countries, a recession in this region affects the export income and growth of emerging countries in a negative way. This is the impact of EDC on trade. In this paper, the evidence suggests that foreign trade is probably the source of the contagion during EDC.
Crises cause confidence problems for investors in the countries or regions in which they occur. With a tendency for risky investment alternatives in the decision-making process, the rational and irrational behavior of investors has an important effect on crises contagion. The expected returns from the financial and real markets vary in
628 Ayşen Altun Ada, Sibel Çelik and Yasemin Deniz Koç
crisis periods, which affect investors’ behavior and leads to capital outflows. The de-cisions and behaviors of policymakers in anticipating and ending economic crises are particularly important to investors’ confidence and expectations. For this reason, the transmission channels must be well understood because measures taken with the aim of mitigating the fragility caused by external shocks may vary according to the source of the contagion. The findings of this paper may be of interest to international investors and portfolio managers because the contagion effect decreases the diversification ben-efit. More pertinently, the findings are important for policy makers in Brazil, Mexico, Turkey, and EAGLEs countries because instability through financial contagion influ-ences their development. Therefore, policy makers in these countries should seek ways to close the channels of contagion to decrease instability in their countries. The growth of EAGLES countries is indexed to exportation. The fact that countries index their economic growth to foreign trade creates significant problems due to long-term reces-sions in crisis periods. EAGLEs countries are required to reduce the weight of foreign demand for their growth. National exports should not be concentrated on a single coun-try or bloc. Moreover, given the fact that the devastating effects of the global crisis on the real sector mostly occurred in the automotive industry and the iron and steel indus-try, it is necessary to consider the main export items of countries in this direction.
629 Testing for Financial Contagion: New Evidence from the European Debt Crisis
References
Aizenman, Joshua, Yothin Jinjarak, Minsoo Lee, and Donghyun Park. 2016.
“Developing Countries’ Financial Vulnerability to the Eurozone Crisis: An Event Study of Equity and Bond Markets.” Journal of Economic Policy Reform, 19(1): 1-19. http://dx.doi.org/10.1080/17487870.2015.1018831
Aloui, Riadh, Mohamed Safouane Ben Aïssa, and Duc Khuong Nguyen. 2011. “Global
Financial Crisis, Extreme Interdependences, and Contagion Effects: The Role of Economic Structure?” Journal of Banking and Finance, 35(1): 130-141. http://dx.doi.org/10.1016/j.jbankfin.2010.07.021
Bae, Kee Hong, Andrew G. Karolyi, and Renee M. Stulz. 2003. “A New Approach to
Measuring Financial Contagion.” Review of Financial Studies, 16(3): 717-763. http://dx.doi.org/10.1093/rfs/hhg012
Baur, Dirk G. 2012. “Financial Contagion and the Real Economy.” Journal of Banking and
Finance, 36(10): 2680-2692. http://dx.doi.org/10.1016/j.jbankfin.2011.05.019
Bekaert, Geert, Michael Ehrmann, Marcel Fratzscher, and Arnaud Mehl. 2014. “Global
Crises and Equity Market Contagion.” The Journal of Finance, 69(6): 2597-2649. http://dx.doi.org/10.1111/jofi.12203
Bodart, Vincent, and Bertrand Candelon. 2009. “Evidence of Interdependence and
Contagion Using a Frequency Domain Framework.” Emerging Markets Review, 10(2): 140-150. http://dx.doi.org/10.1016/j.ememar.2008.11.003
Bouaziz, Meriam Chihi, Nadhem Selmi, and Youness Boujelbene. 2012. “Contagion
Effect of the Subprime Financial Crisis: Evidence of DCC Multivariate GARCH Models.” European Journal of Economics, Finance and Administrative Sciences, 22(1-2): 66-76.
Boyer, Brian, Tomomi Kumagai, and Kathy Yuan. 2006. “How Do Crises Spread?
Evidence from Accessible and Inaccessible Stock Indices.” Journal of Finance, 61(2): 957-1003.http://dx.doi.org/10.1111/j.15406261.2006.00860.x
Caceres, Carlos, Vincenzo Guzzo, and Miguel Segoviano Basurto. 2010. “Sovereign
Spreads: Global Risk Aversion, Contagion or Fundamentals?” International Monetary Fund Working Paper 10/120.
Çelik, Sibel. 2012. “The More Contagion Effect on Emerging Markets: The Evidence of
DCC-GARCH Model.” Economic Modelling, 29(5): 1946-1959. http://dx.doi.org/10.1016/j.econmod.2012.06.011
Chiang, Thomas C., Bang Nam Jeon,and Huimin Li. 2007. “Dynamic Correlation
Analysis of Financial Contagion: Evidence from Asian Markets.” Journal of
International Money and Finance, 26(7): 1026-1228.
http://dx.doi.org/10.1016/j.jimonfin.2007.06.005
Chittedi, Krishna Reddy. 2015. “Financial Crisis and Contagion Effects to Indian Stock
Market: ‘DCC-GARCH’ Analysis.” Global Business Review, 16(1): 50-60. http://dx.doi.org/10.1177/0972150914553507
Cho, Jang Hyung, and Ali M. Parhizgari. 2008. “East Asian Financial Contagion under
DCC-GARCH.” International Journal of Banking and Finance, 6(1): 17-30.
Chudik, Alexander, and Marcel Fratzscher. 2012. “Liquidity, Risk and the Global
Transmission of the 2007-08 Financial Crisis and the 2010-2011 Sovereign Debt Crisis.” European Central Bank Working Paper 1416.
630 Ayşen Altun Ada, Sibel Çelik and Yasemin Deniz Koç
Claessens, Stijn, and Kristin Forbes. 2001. “International Financial Contagion: An
Overview of the Issues and the Book.” In International Financial Contagion, ed. Stijin Claessens and Kristin Forbes, 3-17. New York: Springer Publishing.
Coudert, Virginie, and Mathieu Gex. 2008. “Contagion in the Credit Default Swap Market:
The Case of the GM and Ford Crisis in 2005.” Centre d’Études Prospectives et d’Informations Internationales Working Paper 14.
De Santis, Roberto A. 2014. “The Euro Area Sovereign Debt Crisis: Identifying
Flight-to-Liquidity and the Spillover Mechanisms.” Journal of Empirical Finance, 26: 150-170. http://dx.doi.org/10.1016/j.jempfin.2013.12.003
Dimitriou, Dimitrios, Dimitris Kenourgios, and Theodore Simos. 2013. “Global Financial
Crisis and Emerging Stock Market Contagion: A Multivariate FIAPARCH-DCC Approach.” International Review of Financial Analysis, 30(C): 46-56.
http://dx.doi.org/10.1016/j.irfa.2013.05.008
Ding, Yang, and Andrew Schwert. 2010. “Crisis Period Forecast Evaluation of the
DCC-GARCH Model.” Unpublished.
Dornbusch, Rudiger, Yung Chul Park, and Stijn Claessens. 2000. “Contagion:
Understanding How It Spreads.” World Bank Research Observation, 15(2): 177-197.
Dungey, Mardi, Renee Fry, Brenda González-Hermosillo, and Vance Martin. 2006.
“Contagion in International Bond Markets during the Russian and LTCM Crises.”
Journal of Financial Stability, 2(1): 1-27. http://dx.doi.org/10.1016/j.jfs.2005.01.001
Dungey, Mardi. 2009. “The Tsunami: Measures of Contagion in the 2007-08 Credit Crunch.”
Center for Economic Studies Ifo Institute for Economic Research Forum, 9(4): 33-34.
Dungey, Mardi, Renee Fry, Brenda González-Hermosillo, and Vance Martin. 2011.
Transmission of Financial Crises and Contagion: A Latent Factor Approach. New
York: Oxford University Press.
Eichengreen, Barry, Andrew K. Rose, and Charles Wyplosz. 1996. “Contagious Currency
Crises.” National Bureau of Economic Research Working Paper 5681.
Engle, Robert. 2002. “Dynamic Conditional Correlation: A Simple Class of Multivariate
Generalized Autoregressive Conditional Heteroskedasticity Models.” Journal of
Business and Economic Statistics, 20(3): 339-350.
http://dx.doi.org/10.1198/073500102288618487
Favero, Carlo A., and Francesco Giavazzi. 2002. “Is the International Propagation of
Financial Shocks Non-Linear? Evidence from the ERM.” Journal of International
Economics, 57(1): 231-246. http://dx.doi.org/10.1016/S0022-1996(01)00139-8
Forbes, Kristin, and Roberto Rigobon. 2002. “No Contagion, only Interdependence:
Measuring Stock Market Co-movements.” Journal of Finance, 57(5): 2223-2261. http://dx.doi.org/10.1111/0022-1082.00494
Frank, Nathaniel, and Heiko Hesse. 2009. “Financial Spillovers to Emerging Markets
during the Global Financial Crisis.” Czech Journal of Economics and Finance, 59(6): 507-521.
Gallegati, Marco. 2012. “A Wavelet-Based Approach to Test for Financial Market
Contagion.” Computational Statistics & Data Analysis, 56(11): 3491-3497. http://dx.doi.org/10.1016/j.csda.2010.11.003
Gallo, Giampiero M., and Edoardo Otranto. 2008. “Volatility Spillovers, Interdependence
and Comovements: A Markov Switching Approach.” Computational Statistics & Data
631 Testing for Financial Contagion: New Evidence from the European Debt Crisis
Hatfield, Elaine, John T. Cacioppo, and Richard L. Rapson. 1994. Emotional Contagion.
Cambridge, M. A.: Cambridge University Press.
Horta, Paulo, Carlos Mendes, and Isabel Vieira. 2010. “Contagion Effects of the Subprime
Crisis in the European NYSE Euronext Markets.” The Portuguese Economic Journal, 9(2): 115-140. http://dx.doi.org/10.1007/s10258-010-0056-6
Horta, Paulo, Sérgio Lagoa, and Luís Martin. 2016. “Unveiling Investor-Induced Channels
of Financial Contagion in the 2008 Financial Crisis Using Copulas.” Quantitative
Finance, 16(4): 1-13. http://dx.doi.org/10.1080/14697688.2015.1033447
Karfakis, Costas, and Theodore Panagiotidis. 2015. “The Effects of Global Monetary
Policy and Greek Debt Crisis on the Dynamic Conditional Correlations of Currency Markets.” Empirica, 42(4): 795-811. http://dx.doi.org/10.1007/s10663-014-9277-8
Kenourgios, Dimitris, Aristeidis Samitas, and Nikos Paltalidis. 2011. “Financial Crises
and Stock Market Contagion in a Multivariate Time-Varying Asymmetric Framework.” Journal of International Financial Markets, Institutions and Money, 21(1): 92-106. http://dx.doi.org/10.1016/j.intfin.2010.08.005
Kenourgios, Dimitris, and Puja Padhi. 2012. “Emerging Markets and Financial Crises:
Regional, Global or Isolated Shocks?” Journal of Multinational Financial
Management, 22(1-2): 24-38. http://dx.doi.org/10.1016/j.mulfin.2012.01.002
Kenourgios, Dimitris, Dimitrios Dimitriou, and Apostolas Cristopoluos. 2013. “Asset
Markets Contagion during the Global Financial Crisis.” Multinational Finance
Journal, 17(1/2): 49-76.
Kenourgios, Dimitris, and Dimitrios Dimitriou. 2014. “Contagion Effects of the Global
Financial Crisis in US and European Real Economy Sectors.” Panoeconomicus, 61(3): 275-288. http://dx.doi.org/10.2298/PAN1403275K
Kenourgios, Dimitris, and Dimitrios Dimitriou. 2015. “Contagion of the Global Financial
Crisis and the Real Economy: A Regional Analysis.” Economic Modelling, 44(C): 283-293.http://dx.doi.org/10.1016/j.econmod.2014.10.048
Khan, Saleheen, and Kwang Woo Park. 2009. “Contagion in the Stock Markets: The Asian
Financial Crisis Revisited.” Journal of Asian Economics, 20(5): 561-569. http://dx.doi.org/10.1016/j.asieco.2009.07.001
Kim, Bong Han, Hyeongwoo Kim, and Bong Soo Lee. 2015. “Spillover Effects of the US
Financial Crisis on Financial Markets in Emerging Asian Countries.” International
Review of Economics and Finance, 39(C): 192-210.
http://dx.doi.org/10.1016/j.iref.2015.04.005
Lowell, Julia, Carl Richard Neu, and Daochi Tong. 1998. Financial Crises and Contagion
in Emerging Market Countries. Washington, D. C.: RAND.
MacKinnon, James G. 1996. “Numerical Distribution Functions for Unit Root and Cointe-gration Tests.” Journal of Applied Econometrics, 11(6): 601-618.
http://dx.doi.org/10.1002/(SICI)1099-1255(199611)11:6%3C601::AID-JAE417%3E3.0.CO;2-T
Mink, Mark, and Jakob De Haan. 2013. “Contagion during the Greek Sovereign Debt
Crisis.” Journal of International Money and Finance, 34(C): 102-113. http://dx.doi.org/10.1016/j.jimonfin.2012.11.006
Mollah, Sabur, Goran Zafirov, and Shahiduzzaman A. M. M. Quoreshi. 2014. “Financial
Market Contagion during the Global Financial Crisis.” Center for Innovation and Technology Research Working Paper 2014/5.
Moser, Thomas. 2003. “What Is International Financial Contagion?” International Finance,
632 Ayşen Altun Ada, Sibel Çelik and Yasemin Deniz Koç
Orlov, Alexei G. 2009. “A Cospectral Analysis of Exchange Rate Comovements during
Asian Financial Crisis.” Journal of International Financial Markets, Institutions and
Money, 19(5): 742-758. http://dx.doi.org/10.1016/j.intfin.2008.12.004
Pericoli, Marcello, and Massimo Sbracia. 2003. “A Primer on Financial Contagion.”
Journal of Economic Surveys, 17(4): 571-608.
http://dx.doi.org/10.1111/1467-6419.00205
Rodriguez, Juan Carlos. 2007. “Measuring Financial Contagion: A Copula Approach.”
Journal of Empirical Finance, 14(3): 401-423.
http://dx.doi.org/10.1016/j.jempfin.2006.07.002
Rose, Andrew K., and Mark M. Spiegel. 2010. “Cross Country Causes and Consequences
of the 2008 Crisis: International Linkages and American Exposure.” Pacific Economic
Review, 15(3): 340-363. http://dx.doi.org/10.1016/j.japwor.2011.11.001
Samarakoon, Lalith P. 2011. “Stock Market Interdependence, Contagion, and the U.S.
Financial Crisis: The Case of Emerging and Frontier Markets.” Journal of
International Financial Markets, Institutions and Money, 21(5): 724-742.
http://dx.doi.org/10.1016/j.intfin.2011.05.001
Samitas, Aristeidis, and Ioannis Tsakalos. 2013. “How Can a Small Country Affect the
European Economy? The Greek Contagion Phenomenon.” Journal of International
Financial Markets, Institutions and Money, 25(C): 18-32.
http://dx.doi.org/10.1016/j.intfin.2013.01.005
Tai, Sheng Chu. 2007. “Market Integration and Contagion: Evidence from Asian Emerging
Stock and Foreign Exchange Markets.” Emerging Markets Review, 8(4): 264-283. http://dx.doi.org/10.1016/j.ememar.2006.09.011
Tamakoshi, Go, Yuki Toyoshima, and Shigeyuki Hamori. 2012. “A Dynamic Conditional
Correlation Analysis of European Stock Markets from the Perspective of the Greek Sovereign Debt Crisis.” Economics Bulletin, 32(1): 437-448.
Tamakoshi, Go, and Shigeyuki Hamori. 2013. “Volatility and Mean Spillovers between
Sovereign and Banking Sector CDS Markets: A Note on the European Sovereign Debt Crisis.” Applied Economics Letters, 20(3): 262-266.
http://dx.doi.org/10.1080/13504851.2012.689107
Tiwari, Aviral Kumar, Mihai Ioan Mutascu, and Claudiu Tiberiu Albulescu. 2016.
“Continuous Wavelet Transform and Rolling Correlation of European Stock Markets.”
International Review of Economics & Finance, 42(C): 237-256.
http://dx.doi.org/10.1016/j.iref.2015.12.002
Tola, Albi, and Sebastien Walti. 2015. “Deciphering Financial Contagion in the Euro Area
during the Crisis.” The Quarterly Review of Economics and Finance, 55(C): 108-123. http://dx.doi.org/10.1016/j.qref.2014.09.009
Van Horen, Neeltje, Henk Jager, and Frank Klaassen. 2006. “Foreign Exchange Market
Contagion in the Asian Crisis: A Regression Based Approach.” Review of World
Economics, 142(2): 374-401. http://dx.doi.org/10.1007/s10290-006-0072-x
Zhou, Wei. 2017. “Dynamic and Asymmetric Contagion Reactions of Financial Markets
during the Last Subprime Crisis.” Computational Economics, 50(2): 207-230. http://dx.doi.org/10.1007/s10614-016-9606-z