Adıyaman Üniversitesi Sağlık Bilimleri Dergisi, 2020;6(2):223-230
doi:10.30569.adiyamansaglik.740506
Bu eser, Creative Commons Atıf-GayriTicari 4.0 Uluslararası Lisansı ile lisanslanmıştır. Telif Hakkı © 2020 Adıyaman Üniversitesi Rektörlüğü
Research Article/Özgün Araştırma
The correlation between maternal mealtime behaviors and children’s body mass
index
Anne yemek zamanı davranışları ve çocukların beden kitle indeksleri arasındaki
ilişki
Nevin USLU1 , Fahriye PAZARCIKCI2
1Burdur Mehmet Akif Ersoy University, Faculty of Health Sciences, Department of Pediatric Nursing, 15030,
Burdur-Turkey
2Süleyman Demirel University, Faculty of Health Sciences, Department of Pediatric Nursing, 32200, Isparta-Turkey
Atıf gösterme/Cite this article as: Uslu N, Pazarcıkcı F. The correlation between maternal mealtime behaviors and children’s body mass index. ADYÜ Sağlık Bilimleri Derg. 2020;6(2):223-230. doi:10.30569.adiyamansaglik.740506 Abstract
Aim: The purpose of study was to determine the correlation between mothers’ mealtime behaviors (MMTBs) and children’s body mass index (BMI). Materials and Methods: The study was done with 112 mothers whose children were hospitalized in a pediatric service of a public hospital for diagnosis and treatment. To collect data; Information Request Form and The Parent Mealtime Action Scale were used. The data were assessed with descriptive statistics, Shapiro-Wilk, Man-Whitney U, Kruskal Wallis, Bonferroni correction Dunn test and Spearman correlation test.
Results: It was identified that among MMTBs, the most demonstrated behaviors were consumption of daily fruit and vegetable availability, using positive persuasion and setting snack amounts. In study it was found that children’s BMI values were positively correlated with cooking child-selected meals while they were negatively and weakly correlated with fat reduction-subscale.
Conclusion: It is recommended that different prospective studies be done in order to compare mothers and fathers’ behaviors.
Keywords: Child; Eating practices; Mother’s mealtime behaviors.
Öz
Amaç: Bu çalışmanın amacı annelerin yemek zamanı davranışları (AYZD) ve çocukların beden kitle indeksleri (BKİ) arasındaki ilişkiyi belirlemektir. Gereç ve Yöntem: Çalışma bir devlet hastanesinin çocuk servisinde çocuğu tanı ve tedavi için yatan 112 anne ile yapılmıştır. Verilerin toplanmasında Anket Formu ve Ebeveyn Yemek Zamanı Ölçeği kullanılmıştır. Veriler, tanımlayıcı istatistikler, Shapiro-Wilk, Man-Whitney U, Kruskal Wallis, Bonferroni düzeltmeli Dunn testi ve Spearman korelayon testi ile değerlendirilmiştir.
Bulgular: AYZD’den en çok günlük sebze ve meyve tüketme, olumlu iknayı kullanma ve atıştırma miktarlarını sınırlama davranışlarının sergilendiği belirlenmiştir. Çalışmada çocuğun BKİ değerlerinin özel yemekler sunma alt ölçeği ile arasında pozitif, hayvansal yağların azaltılması alt ölçeği ile arasında negatif yönde ve zayıf bir ilişki olduğu belirlenmiştir. Sonuç: Gelecekte anne ve babaların davranışlarının karşılaştırıldığı farklı çalışmalar yapılması önerilmektedir.
Anahtar Kelimeler: Çocuk; Yemek yeme
uygulamaları; Annelerin yemek zamanı davranışları.
Yazışma Adresi/Address for Correspondence: Nevin USLU, Burdur Mehmet Akif Ersoy University, Faculty of Health Sciences, Department of Pediatric Nursing, 15030, Burdur-Turkey, E-mail: [email protected]
Geliş Tarihi/Received:20.05.2020 Kabul Tarihi/Accepted:15.06.2020 Yayım Tarihi/Published online:30.08.2020
https://dergipark.org.tr/tr/pub/adiyamansaglik
Bu makale araştırma ve yayın etiğine uygun hazırlanmıştır. intihal incelemesinden geçirilmiştir.
224
Introduction
Eating is a necessary and natural process that begins with fetal life so that life can continue. It is known that there is a correlation between acquiring correct eating habits and lifelong health protection and chronic disease prevention.1 In making children gain eating habits, the most important factor is parents. Parents guide children towards healthy eating habits through parental modeling, establishing family rules about mealtime and eating and being social support. Parental insistence on children about meals, their restriction of some foods, severe eating rules may lead to unhealthy eating behaviors among children.2-10
Since mothers –in particular- are primary child-caregivers and are main guards in eating environments; their mealtime behaviors are highly important.11 Therefore; mothers’ feeding/eating practices used to determine quality and amount of the foods consumed by children and their mealtime behaviors have lately been gaining importance. Mothers’ mealtime behaviors are generally in the form of restricting, forcing, using rewards/punishments and controlling children’s eating behaviors. Restrictions include parent-centered and authoritarian practices that ban children from getting foods or prevent their opportunity to consume these foods and limit type and/or amount of the foods eaten by parents.2, 4-9 Forcing includes
parents’ insistent and forcible practices that put pressure on children to eat more even if they are not hungry. Through using rewards/punishments, children’s eating behaviors are shaped by using food that children prefer or non-food items so that they can have their meals or obey. Controlling requires taking measures on children’s consumption of different foods such as desserts, snacks and high fat foods.2, 4-9 In
studies done, it is argued that controlling is associated with unhealthy eating behaviors since practices and behaviors such as restricting and forcing impair children’s self-regulatory mechanisms. It is suggested that these behaviors cause children to eat more even if they are not hungry, to put on weigh, to have a strong dislike for some foods, to
reduce vegetable consumption, to get unhealthy snack intake and to consume high energy foods and beverages.3-5-9, 12, 13 These
behaviors that mothers use to control what, when and how much children eat can be correlated with children’s BMI. Therefore; it is important to explore mothers’ mealtime behaviors.
The purpose of the study was to explore the correlation between mothers’ mealtime behaviors (MMTBs) and children’s body mass index.
Materials and Methods
The study was done with the mothers whose children aged 4-12 were hospitalized in a pediatric service of a public hospital for diagnosis and treatment because accessibility to and contact with the mothers at one center was easy. Sample volume was calculated according to the study of Arslan and Erol14, and 112 mothers were recruited for sampling using α=0.05 and power of 90%. Of mothers; those who had children aged 4-12 years and whose children were hospitalized at pediatric service, did not have any physical, mental, and psychological disabilities, were literate and were able to speak Turkish were included in the study.
Data collection tools Information request form
The form was developed by the researchers in line with the relevant literature. The form targeted at identifying such aspects as children’s age, gender, birth week, delivery type, body weight, body height, breastfeeding duration, time to start infant initial foods, feeding with instant foods and presence of chronic diseases. Besides; in the form were questions relating to mothers and fathers’ age, educational status, body weight, body height and presence of chronic diseases.2-9, 12-16 Parent mealtime action scale (PMAS)
Arslan and Erol performed the reliability and validity tests of the scale, developed by Helen M. Hendy et al. 14, 15 The scale, which measures behaviors that parents demonstrate while they feed their children, is a 3-point likert scale with 31 items and nine subscales.
225
These subscales are snack-limits, positive persuasion, daily fruit and vegetable availability, use of rewards, insistence on eating, snack modeling, child-selected meals, fat reduction, many food choices. Each subscale is assessed as a separate scale. There is no scale total score. In calculating sub-dimension scores, points marked for each item of the subscale are summed up and the total sum is divided into item-number of the subscale and average score is obtained. The subscale with the highest average score indicates the behavior used by parents most.14, 15
Data collection
The data were gathered using face to face interviews made with mothers that met inclusion criteria between the 1st of October 2017 and the 30th of March 2018. In the interviews, children’s body weights and heights were measured by using the tools and devices in the pediatric service. Mothers and fathers’ body weights and heights were not measured but mothers’ body weights and heights were collected with self-reports. BMIs were calculated using the formula of BMI=kg/m2. Children’s BMI values were evaluated according to the study of Neyzi et al.17
Ethical dimension
This study received ethics approval from Ethics Board (Approval no: 2017/101) and official permission from the Public Hospitals Union. Mothers were verbally informed of the study and provided written informed consents prior to participation.
Data analysis
All the statistical analyses were performed using IBM SPSS Statistics 22.0 package program (IBM Corp., Armonk, New York, USA). The data were presented in frequencies (n), percentages (%), means and standard deviation (X±sd). Normality of the data for the numeric variables was assessed using Shapiro-Wilk test, histogram and Q-Q graphics. To compare the difference between two groups Mann-Whitney U test was used while to compare the difference between more than two groups Kruskal Wallis test was
employed. In case of a different result from Kruskal Wallis test, Bonferroni correction Dunn test was used as multiple comparisons test. Correlations between numeric variables were analyzed using Spearman Correlation Analysis. p<0.05 values were considered to be statistically significant.
Results
In the study, average age of the children was 7.7±2.2 years, 52.7% of them were male, 81.3% of them were term born and 58.9% of them were cesarean born, 91.1% of them did not have any chronic disease. Children’s average anthropometric measurements at birth and those now were (respectively; at birth and now) body weight: 3148.0±647.7 gr, 24.7±10.4 kg, body height: 49.5±3.5 cm, 120.8±16.3 cm and BMI (kg/m2) 12.9±3.3, 16.3±3.5. According to BMI values; 67.0% of children are normal, 16.1% are underweight, 14.3% are obese, and 2.7% are overweight. All the children were breastfed, average breastfeeding duration was 16.2±8.6 months, average time to start infant initial foods was 5.6±2.2 month and 41.1% of them took instant foods. Average age of the mothers was 34.6±5.6 years, 33.0% of them had primary school graduation and 93.8% of them did not have any chronic diseases. As for the fathers; their average age was 38.3±6.1 years, 33.9% of them had primary school graduation and 96.4% of them did not have any chronic diseases.
Children’s BMI values were identified to positively and weakly be correlated with their age, mothers and fathers’ BMI values and their current BMI values (rhoage=0.352, p=0.000, rhomother=0.242, p=0.010, rhofather=0.201, p=0.034). However; children’s BMI values did not differ significantly in terms of children’s gender, birth week, delivery type, BMI at birth, breastfeeding duration, time to start initial foods, presence of chronic diseases, feeding with instant foods, parental age, parental education level, presence of chronic diseases in parents (p>0.05).
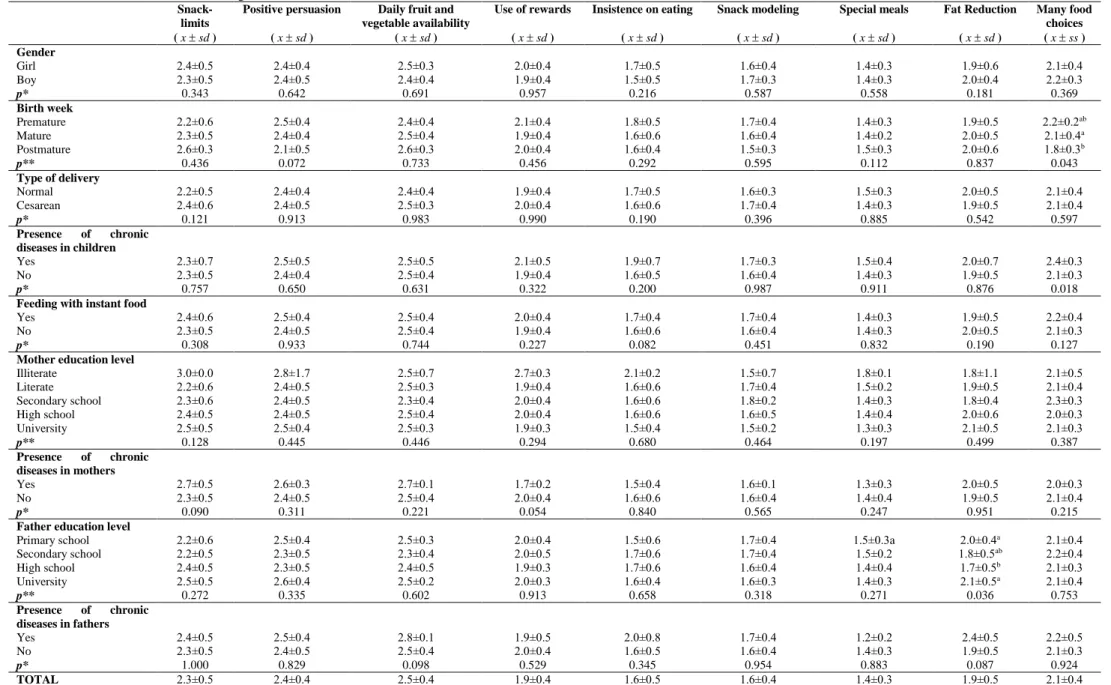
In the study; mothers’ mealtime behaviors were presented in Table 1 according to children’s characteristics.
226 Table 1. Mothers’ mealtime behaviors according to children’s characteristics.
Snack-limits ( x sd )
Positive persuasion ( x sd )
Daily fruit and vegetable availability ( x sd ) Use of rewards ( x sd ) Insistence on eating ( x sd ) Snack modeling ( x sd ) Special meals ( x sd ) Fat Reduction ( x sd ) Many food choices ( x ss ) Gender Girl Boy 2.4±0.5 2.3±0.5 2.4±0.4 2.4±0.5 2.5±0.3 2.4±0.4 2.0±0.4 1.9±0.4 1.5±0.5 1.7±0.5 1.6±0.4 1.7±0.3 1.4±0.3 1.4±0.3 1.9±0.6 2.0±0.4 2.1±0.4 2.2±0.3 p* 0.343 0.642 0.691 0.957 0.216 0.587 0.558 0.181 0.369 Birth week Premature Mature Postmature 2.2±0.6 2.3±0.5 2.6±0.3 2.5±0.4 2.4±0.4 2.1±0.5 2.4±0.4 2.5±0.4 2.6±0.3 2.1±0.4 1.9±0.4 2.0±0.4 1.8±0.5 1.6±0.6 1.6±0.4 1.7±0.4 1.6±0.4 1.5±0.3 1.4±0.3 1.4±0.2 1.5±0.3 1.9±0.5 2.0±0.5 2.0±0.6 2.2±0.2ab 2.1±0.4a 1.8±0.3b p** 0.436 0.072 0.733 0.456 0.292 0.595 0.112 0.837 0.043 Type of delivery Normal Cesarean 2.2±0.5 2.4±0.6 2.4±0.4 2.4±0.5 2.4±0.4 2.5±0.3 1.9±0.4 2.0±0.4 1.7±0.5 1.6±0.6 1.6±0.3 1.7±0.4 1.5±0.3 1.4±0.3 2.0±0.5 1.9±0.5 2.1±0.4 2.1±0.4 p* 0.121 0.913 0.983 0.990 0.190 0.396 0.885 0.542 0.597 Presence of chronic diseases in children Yes No 2.3±0.7 2.3±0.5 2.5±0.5 2.4±0.4 2.5±0.5 2.5±0.4 2.1±0.5 1.9±0.4 1.9±0.7 1.6±0.5 1.7±0.3 1.6±0.4 1.5±0.4 1.4±0.3 2.0±0.7 1.9±0.5 2.4±0.3 2.1±0.3 p* 0.757 0.650 0.631 0.322 0.200 0.987 0.911 0.876 0.018
Feeding with instant food Yes No 2.4±0.6 2.3±0.5 2.5±0.4 2.4±0.5 2.5±0.4 2.5±0.4 2.0±0.4 1.9±0.4 1.7±0.4 1.6±0.6 1.7±0.4 1.6±0.4 1.4±0.3 1.4±0.3 1.9±0.5 2.0±0.5 2.2±0.4 2.1±0.3 p* 0.308 0.933 0.744 0.227 0.082 0.451 0.832 0.190 0.127
Mother education level Illiterate Literate Secondary school High school University 3.0±0.0 2.2±0.6 2.3±0.6 2.4±0.5 2.5±0.5 2.8±1.7 2.4±0.5 2.4±0.5 2.4±0.5 2.5±0.4 2.5±0.7 2.5±0.3 2.3±0.4 2.5±0.4 2.5±0.3 2.7±0.3 1.9±0.4 2.0±0.4 2.0±0.4 1.9±0.3 2.1±0.2 1.6±0.6 1.6±0.6 1.6±0.6 1.5±0.4 1.5±0.7 1.7±0.4 1.8±0.2 1.6±0.5 1.5±0.2 1.8±0.1 1.5±0.2 1.4±0.3 1.4±0.4 1.3±0.3 1.8±1.1 1.9±0.5 1.8±0.4 2.0±0.6 2.1±0.5 2.1±0.5 2.1±0.4 2.3±0.3 2.0±0.3 2.1±0.3 p** 0.128 0.445 0.446 0.294 0.680 0.464 0.197 0.499 0.387 Presence of chronic diseases in mothers Yes No 2.7±0.5 2.3±0.5 2.6±0.3 2.4±0.5 2.7±0.1 2.5±0.4 1.7±0.2 2.0±0.4 1.5±0.4 1.6±0.6 1.6±0.1 1.6±0.4 1.3±0.3 1.4±0.4 2.0±0.5 1.9±0.5 2.0±0.3 2.1±0.4 p* 0.090 0.311 0.221 0.054 0.840 0.565 0.247 0.951 0.215
Father education level Primary school Secondary school High school University 2.2±0.6 2.2±0.5 2.4±0.5 2.5±0.5 2.5±0.4 2.3±0.5 2.3±0.5 2.6±0.4 2.5±0.3 2.3±0.4 2.4±0.5 2.5±0.2 2.0±0.4 2.0±0.5 1.9±0.3 2.0±0.3 1.5±0.6 1.7±0.6 1.7±0.6 1.6±0.4 1.7±0.4 1.7±0.4 1.6±0.4 1.6±0.3 1.5±0.3a 1.5±0.2 1.4±0.4 1.4±0.3 2.0±0.4a 1.8±0.5ab 1.7±0.5b 2.1±0.5a 2.1±0.4 2.2±0.4 2.1±0.3 2.1±0.4 p** 0.272 0.335 0.602 0.913 0.658 0.318 0.271 0.036 0.753 Presence of chronic diseases in fathers Yes No 2.4±0.5 2.3±0.5 2.5±0.4 2.4±0.5 2.8±0.1 2.5±0.4 1.9±0.5 2.0±0.4 2.0±0.8 1.6±0.5 1.7±0.4 1.6±0.4 1.2±0.2 1.4±0.3 2.4±0.5 1.9±0.5 2.2±0.5 2.1±0.3 p* 1.000 0.829 0.098 0.529 0.345 0.954 0.883 0.087 0.924 TOTAL 2.3±0.5 2.4±0.4 2.5±0.4 1.9±0.4 1.6±0.5 1.6±0.4 1.4±0.3 1.9±0.5 2.1±0.4
227
The first three behaviors with the highest scores in mother mealtime behaviors were daily fruit and vegetable availability, positive persuasion and snack-limits. In terms of children’s gender and delivery type, mother mealtime behaviors were not different but mother mealtime behaviors were statistically different in terms of birth week and presence of chronic disease in children (p˂0.05). Average scores in many food choices of those mothers whose children were premature born and had chronic disease were noted to be higher (p˂0.05). It was seen that average score of mother mealtime behaviors was not statistically significant in terms of mother education level, presence of chronic disease in mothers and fathers (p>0.05). However; average score of fat reduction was statistically different in terms of fathers’ education level (p˂0.05).
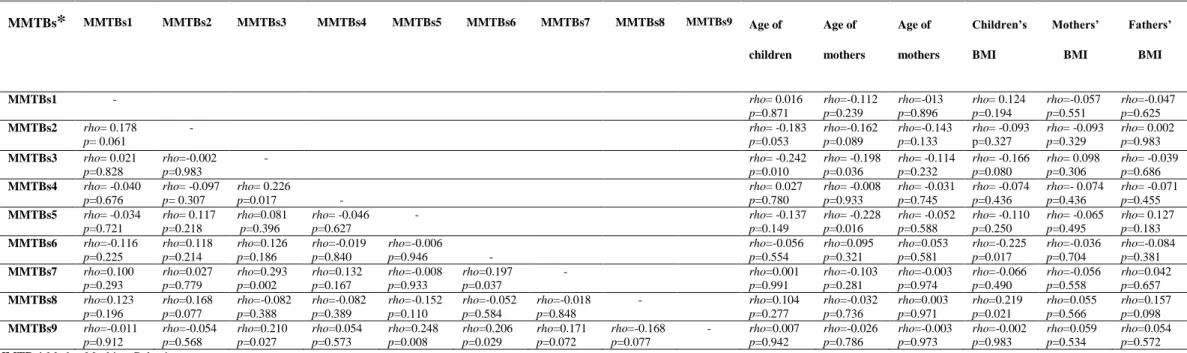
The correlations of PMAS-subscales with each other and between PMAS subscales and children’s, mothers’, fathers’ age and BMI values were presented in Table 2. It was found that there was a positive and weak correlation between use of rewards and insistence on eating, positive persuasion, many food choices (p˂0.05). Besides; as children’s and mothers’ age decreased, use of rewards increased (respectively; rho=-0.210 p=0.010, rho=-0.198 p=0.036). Also; a positive and weak correlation existed between child-selected meals and positive persuasion, many food choices. In the study; it was understood that there was a positive correlation between children’s BMI values and child-selected meals but a negative and weak correlation was identified between children’s BMI values and fat reduction (p˂0.05).
Table 2. The correlation between PMAS-subscales and children’s, mothers’ and fathers’ ages and their BMI values
MMTBs* Mother Mealtime Behaviors
MMTBs1. Snack Modeling, MMTBs2. Daily Fruit and Vegetable Availability, MMTBs3. Use of Rewards, MMTBs4. Insistence on Eating, MMTBs5. Snack Modeling, MMTBs6. Special Meals, MMTBs7. Positive Persuasion, MMTBs8. Fat Reduction, MMTBs9. Many Food Choices
MMTBs* MMTBs1 MMTBs2 MMTBs3 MMTBs4 MMTBs5 MMTBs6 MMTBs7 MMTBs8 MMTBs9 Age of children Age of mothers Age of mothers Children’s BMI Mothers’ BMI Fathers’ BMI MMTBs1 - rho= 0.016 p=0.871 rho=-0.112 p=0.239 rho=-013 p=0.896 rho= 0.124 p=0.194 rho=-0.057 p=0.551 rho=-0.047 p=0.625 MMTBs2 rho= 0.178 p= 0.061 - rho= -0.183 p=0.053 rho=-0.162 p=0.089 rho=-0.143 p=0.133 rho= -0.093 p=0.327 rho= -0.093 p=0.329 rho= 0.002 p=0.983 MMTBs3 rho= 0.021 p=0.828 rho=-0.002 p=0.983 - rho= -0.242 p=0.010 rho= -0.198 p=0.036 rho= -0.114 p=0.232 rho= -0.166 p=0.080 rho= 0.098 p=0.306 rho= -0.039 p=0.686 MMTBs4 rho= -0.040 p=0.676 rho= -0.097 p= 0.307 rho= 0.226 p=0.017 - rho= 0.027 p=0.780 rho= -0.008 p=0.933 rho= -0.031 p=0.745 rho= -0.074 p=0.436 rho=- 0.074 p=0.436 rho= -0.071 p=0.455 MMTBs5 rho= -0.034 p=0.721 rho= 0.117 p=0.218 rho=0.081 p=0.396 rho= -0.046 p=0.627 - rho= -0.137 p=0.149 rho= -0.228 p=0.016 rho= -0.052 p=0.588 rho= -0.110 p=0.250 rho= -0.065 p=0.495 rho= 0.127 p=0.183 MMTBs6 rho=-0.116 p=0.225 rho=0.118 p=0.214 rho=0.126 p=0.186 rho=-0.019 p=0.840 rho=-0.006 p=0.946 - rho=-0.056 p=0.554 rho=0.095 p=0.321 rho=0.053 p=0.581 rho=-0.225 p=0.017 rho=-0.036 p=0.704 rho=-0.084 p=0.381 MMTBs7 rho=0.100 p=0.293 rho=0.027 p=0.779 rho=0.293 p=0.002 rho=0.132 p=0.167 rho=-0.008 p=0.933 rho=0.197 p=0.037 - rho=0.001 p=0.991 rho=-0.103 p=0.281 rho=-0.003 p=0.974 rho=-0.066 p=0.490 rho=-0.056 p=0.558 rho=0.042 p=0.657 MMTBs8 rho=0.123 p=0.196 rho=0.168 p=0.077 rho=-0.082 p=0.388 rho=-0.082 p=0.389 rho=-0.152 p=0.110 rho=-0.052 p=0.584 rho=-0.018 p=0.848 - rho=0.104 p=0.277 rho=-0.032 p=0.736 rho=0.003 p=0.971 rho=0.219 p=0.021 rho=0.055 p=0.566 rho=0.157 p=0.098 MMTBs9 rho=-0.011 p=0.912 rho=-0.054 p=0.568 rho=0.210 p=0.027 rho=0.054 p=0.573 rho=0.248 p=0.008 rho=0.206 p=0.029 rho=0.171 p=0.072 rho=-0.168 p=0.077 - rho=0.007 p=0.942 rho=-0.026 p=0.786 rho=-0.003 p=0.973 rho=-0.002 p=0.983 rho=0.059 p=0.534 rho=0.054 p=0.572
228
Discussion
In order to develop healthy eating habits and behaviors in children; all family members need to demonstrate adequate and balanced nutrition habits because children take their parents as role models, learn healthy eating habits from them and show nutritional preferences similar to their parents.5, 18 The studies done reported that especially children at the age of 2-16 show the same dietary patterns as their parents and mostly take their parents as example19-24 which is mainly associated with parents’ BMI values, too. In particular, children with obese parents are more likely to be obese than other children. If both parents are obese, obesity likelihood of these children is 80%; if either of the parents is obese, obesity likelihood of these children is 40% and finally, if both of the parents are not obese, obesity likelihood of these children is 14%.25 In this study, too, it was noted that a positive correlation existed between parents’ BMI values and children’s BMI values and as parental BMI values increased so did children’s BMI values.
Parents may–directly or indirectly-influence children’s eating preferences, practices and BMIs. Mothers are primary and responsible caregivers in children eating habits. Therefore; mothers’ feeding and eating practices are crucial.26,27 The relevant literature reported that as feeding practices, mothers mostly try to control children’s body weight by restricting food intake or forcing them to eat less or by increasing or decreasing children’s direct food intake.2,4-9 The previous
studies especially stated that these practices of mothers are associated with children’s weight, restricting behaviors may result in overweightness but repressive practices of mothers may result in low weight in children.2,4-6,9,16,28 In the current study; mothers were found to have used restrictive and repressive behaviors and practices mostly, to have limited children’s eating, drinking and snack amounts, to have increased daily fruit and vegetable consumption and to have used positive persuasion in order to encourage children to eat. As children’s BMI values increased, so did mothers restrictive behaviors. Besides,
mothers whose children were premature born and had chronic disease preferred many food choices to feed their children. Children who were premature born and had chronic disease are under bigger risk for delayed growth and development as compared to the healthy children.29 We were of the opinion that – similar to the literature- mothers in the current study, fearing that their children would have low weight, demonstrated repressive behaviors.4, 5, 28
In feeding children, mothers may use some foods as rewards so that children can consume an undesired food or demonstrate a desired behavior; which may affect children’s food preferences and obesity development.5, 30, 31
The study of Muslu et al. showed that mothers and fathers’ age are negatively correlated with use of rewards.31 The study of Kim et al. suggested that parents’ rewarding behaviors are positively correlated with children’s snack consumption but are negatively correlated with behaviors that encourage them to eat.32
The study of Saltzman et al. argued that there is a correlation between use of rewards and children’s high BMI values.33 The relevant
literature points out that use of foods as rewards elevates child’s sensitivity to foods and is positively associated with emotional over-eating. Also, persuasive feeding practices are reported to positively be correlated with emotional over-eating.8,34 In the current study; mothers’ use of rewards was found not to be correlated with children’s BMI values but there was a positive correlation between behaviors of insistence on eating, positive persuasion and many food choices and children’s BMI values. It may be concluded that food sensitivity of the children of the participant mothers in the current study may pose as a risk factor for emotional over-eating and obesity; which also underlined the fact that the participating mothers demonstrated low level of awareness about healthy eating/feeding and obesity.
There are many factors that affect mothers’ behaviors in feeding children; one of which is mothers’ education level. In the studies undertaken, it was reported that as mothers’ education level increased, so did their repressive and authoritarian behaviors but
229
their rewarding feeding practices decreased.31,
35, 36 In this current study; it was found that
mothers’ mealtime behaviors did not differ according to their education level; however, as fathers’ education level increased so did average score in fat reduction-subscale of maternal mealtime behaviors. Even though mothers are generally children’s primary care givers, family-based social gender roles and responsibilities of mothers and fathers have lately been changing. Fathers may play an effective role in making decisions related to children’s eating and feeding practices as much as mothers. In the relevant literature, studies done with fathers are limited and those that recruited fathers generally focused on well-educated fathers and growing level of responsibility for children’s eating and feeding practices was explained to be correlated with education.37-40 However; there is no study that investigates effects of fathers, their age, education level and other demographic characteristics upon maternal feeding practices and decisions.
Children’s characteristics may play a role in feeding children and mothers’ eating behaviors, too. Some of the studies underlined that female children are subjected to more repressive and controlling behaviors in terms of gender27, 41 whereas others underlined no difference in this respect.31, 42 In this current study, too, it was identified that mother mealtime behaviors did not differ in children’s gender; however, as children’s and mothers’ age increased, use of rewards decreased.
Limitations
The limitations of this study are that it is performed in a single center, it can only be generalized to this sample and it is limited to the age group we have chosen.
Conclusion
As a conclusion; although the participant mothers in the study generally showed repressive and restrictive behaviors, they also used rewards. Particularly, mothers whose children were premature born and had chronic disease offered many food choices to their children. Children’s BMI values and child-selected meals and fat reduction behaviors
were seen to be correlated. It is recommended that prospective studies focus on practices of both parents and clarify roles of fathers in eating and feeding practices. Besides, it is recommended that studies that will explore how parents influence each other in making decisions of eating and feeding practices and will determine if there are other factors that affect these decisions be undertaken.
Ethics Committee Approval
Approval was obtained from the Mehmet Akif Ersoy University Non-Interventional Clinical Research Ethics Committee (no:2017/101) for the research. The study was also carried out in accordance with the Helsinki Declaration of Principles.
Informed Consent
All mothers who participated in to this study were informed both verbally and in written. Informed consent was signed by all participants.
Author Contributions
Study design: NU, FP; Data collection: NU, FP; Data analysis: NU; Manuscript writing: NU, FP.
Acknowledgements
We would like to thank Bünyamin Ertürk and Fatma Aksu who supported this research. Conflict of Interest
There are no conflicts of interest. Financial Disclosure
This study has not been financially supported.
References
1. World Health Organization (2019), Facts and figures on childhood obesity, URL: https://www.who.int/end-childhood-obesity/facts/en/, Accessed: 10.01.2020
2. Gevers DWM. Kremers SPJ, de Vries NK, Assema P. Clarifying concepts of food parenting practices. A Delphi study with an application to snacking behavior. Appetite. 2014;79:51– 57.
3. Jani R. Mallan KM. Daniels L. Association between Australian-Indian mothers' controlling feeding practices and children's appetite traits, Appetite.2015; 84:188-195.
4. Shloim N. Edelson LR. Martin N, Hetherington MM. Parenting styles, feeding styles, feeding practices, and weight status in 4-12 year-old children: a systematic review of the literature.
Front Psychol.2015;14(6):1849.
5. Vaughn AE. Ward DS. Fisher JO. et al. Faith fundamental constructs in food parenting practices: a content map to guide future research. Nutrition Reviews.2016;74(2):98–117.
230 6. Farrow CV. Haycraft E. Blissett JM. Observing maternal
restriction of food with 3⁻5-year-old children: relationships with temperament and later body mass ındex (BMI). Int J
Environ Res Public Health.2018; 15:15(6).
7. Haines J. Downing KL, Tang L. Campbell KJ, Hesketh KD. Associations between maternal concern about child's weight and related behaviours and maternal weight-related parenting practices: a cross-sectional study. Int J Behav Nutr Phys
Act.2018;15(1):104.
8. Hughes SO. Papaioannou MA. Maternal predictors of child dietary behaviors and weight status. Curr Nutr Rep.2018;7(4):268-273.
9. Van Lippevelde W. Vervoort L. Vangeel J, Goossens L. Can
parenting practices moderate the relationship between reward sensitivity and adolescents' consumption of snacks and
sugar-sweetened beverages?Nutrients.2020;8:12(1). pii: E178.
10. Bergmeier H. Paxton SJ. Milgrom J et al. Early mother-child dyadic pathways to childhood obesity risk: A conceptual model. Appetite.2020;144:104459.
11. Webber L. Cooke L. Hill C, Wardle J. Associations between children's appetitive traits and maternal feeding practices.
Journal of the American Dietetic Association.2010;110
(11):1718-1722.
12. Mallan K. Jansen E, Harris H, Llewellyn C, Fildes A, Daniels LA. Feeding a fussy eater: Examining longitudinal bidirectional relationships between child fussy eating and maternal feeding practices. Journal of Pediatric Psychology.2018;1-8.
13. Jordan AA, Appugliese DP, Miller AL, Lumeng JC,
Rosenblum KL, Pesch MH. Maternal prompting types and child vegetable intake: Exploring the moderating role of picky eating. Appetite.2020;146:104518.
14. Arslan N. Erol S. Ebeveyn Yemek Zamanı Davranışları Ölçeği’nin Türkçe geçerlik ve güvenirliği. Hemşirelikte
Araştırma Geliştirme Dergisi.2014;16(3):16-27.
15. Hendy HM, Williams KE, Camise TS, Eckman N, Hedemann A. The Parent Mealtime Action Scale (PMAS). Development and association with children’s diet and weight.
Appetite.2009;52(2):328–339.
16. Schmidt R, Hiemisch A, Kiess W, Hilbert A. Interaction effects of child weight status and parental feeding practices on children's eating disorder symptomatology. Nutrients.2019; 12;11(10). pii: E2433.
17. Neyzi O. Günöz H. Furman A. et al. Türk çocuklarında vücut ağırlığı, boy uzunluğu, baş çevresi ve vücut kitle indeksi referans değerleri. Çocuk Sağlığı ve Hastalıkları Dergisi.2008;51:1-14
18. Vaughn AE. Martin CL. Ward DS. What matters most - what parents model or what parents eat? Appetite.2018;126:102-107. 19. Beydoun MA. Wang Y. Parent–child dietary intake
resemblance in the United States: evidence from a large representative survey. Soc Sci Med.2009;68:2137–2144. 20. Ovaskainen M. Nevalainen J. Uusitalo L. et al. Some
similarities in dietary clusters of pre-school children and their mothers. Br J Nutr.2009;102:443–452.
21. Wang Y, Beydoun MA, Li J, Liu Y, Moreno LA. Do children and their parents eat a similar diet? Resemblance in child and parental dietary intake: systematic review and meta-analysis. J
Epidemiol Community Health.2011;65:177–189.
22. Vollmer RL, Adamsons K, Gorin A, Foster JS, Mobley AR. Investigating the relationship of body mass index, diet quality, and physical activity level between fathers and their preschool-aged children. J Acad Nutr Diet.2015;115:919–926.
23. Hebestreit A. Intemann T. Siani A. et al. Dietary patterns of European children and their parents in association with family food environment: results from the I.Family study.
Nutrients.2017; 9:126.
24. Vepsäläinen H. Nevalainen J., Fogelholm M. et al. Like parent, like child? Dietary resemblance in families. Int J Behav Nutr
Phys Act.2018;3;15(1):62.
25. Cinaz P. Çocukluk çağında obezite. Hasanoğlu, E., Düşünsel, R., Bideci, A. (Eds.). Temel Pediatri. Güneş Tıp Kitabevleri, Ankara, 2010;59-65.
26. Khandpur N. Blaine RE. Fisher JO. Davison KK. Fathers' child feeding practices: a review of the evidence, Appetite.2014; 78:110-121
27. Bergmeier HJ, Skouteris H, Haycraft E, Haines J, Hooley M. Reported and observed controlling feeding practices predict
child eating behavior after 12 months. J Nutr.2015;145(6):1311-1316.
28. Hidalgo-Mendez J, Power TG, Fisher JO, O'Connor TM, Hughes SO. Child weight status and accuracy of perceived child weight status as predictors of Latina mothers' feeding practices and styles. Appetite.2019;1;142:104387.
29. Potts NL. Mandleco BL. Pediatric Nursing: Caring for Children and Their Families, Delmar, Cengage Learning. USA, 2012 30. Sleddens EF, Kremers SP, De Vries NK, Thijs C. Relationship
between parental feeding styles and eating behaviours of Dutch children aged 6-7. Appetite.2010; 54: 30-6.
31. Muslu GK., Beytut D. Kahraman A, Yardımcı F, Başbakkal Z. Ebeveyn besleme tarzı ve etkileyen etmenlerin incelenmesi.
Türk Ped Arş.2014;49: 224-30.
32. Kim HO. Kim GN. Park E. Perception of childhood obesity in mothers of preschool children. Osong public health and
research perspectives.2015;6(2):121-125.
33. Saltzman JA, Pineros-Leano M, Liechty JM, Bost KK, Fiese BH; STRONG Kids Team. Eating, feeding, and feeling: emotional responsiveness mediates longitudinal associations between maternal binge eating, feeding practices, and child weight. Int J Behav Nutr Phys Act.2016;2;13:89.
34. Miller N, Mallan KM, Byrne R, de Jersey S, Jansen E, Daniels LA. Non-responsive feeding practices mediate the relationship between maternal and child obesogenic eating behaviours.
Appetite.2020;13:104648.
35. Saxton J, Carnell S, van Jaarsveld CH, Wardle J. Maternal education is associated with feeding style. J Am Diet
Assoc.2009;109:894-8.
36. Nowicka P, Sorjonen K, Pietrobelli A, Flodmark CE, Faith MS. Parental feeding practices and associations with child weight status. Swedish validation of the Child Feeding Questionnaire finds parents of 4-year-olds less restrictive.
Appetite.2014;81:232-41.
37. Haycraft E. Blissett J. Predictors of paternal and maternal controlling feeding practices with 2- to 5-year-old children. J
Nutr Educ Behav.2012;44(5):390-7.
38. Penilla C. Tschann JM. Deardorff J. et al. Fathers' feeding practices and children's weight status in Mexican American families. Appetite.2017;1;117:109-116.
39. Reisz S, Aviles AI, Messina S, Duschinsky R, Jacobvitz D, Hazen N. Fathers’ attachment representations and infant feeding practices. Appetite.2019; 142: 104374.
40. Rahill S. Kennedy A. Kearney J. A review of the influence of fathers on children's eating behaviours and dietary intake.
Appetite.2020;147:104540.
41. Rollins BY, Loken E, Savage JS, Birch LL. Maternal controlling feeding practices and girls' inhibitory control interact to predict changes in BMI and eating in the absence of hunger from 5 to 7 y. Am J Clin Nutr. 2014;99(2):249‐257. 42. Kröller K. Warschburger P. The association between maternal
feeding style and food intake of children with a higher risk for overweight. Appetite.2008;51: 166-72.