THE DYNAMICS OF FINANCIAL AND MACROECONOMIC DETERMINANTS IN NATURAL GAS AND CRUDE OIL MARKETS: EVIDENCE FROM
OECD/GCC/OPEC COUNTRIES
A THESIS SUBMITTED TO
THE INSTITUTE OF SOCIAL SCIENCES OF
YILDIRIM BEYAZIT UNIVERSITY
BY
MERVE KARACAER ULUSOY
IN PARTIAL FULFILLMENT OF THE REQUIREMENTS FOR
THE DEGREE OF DOCTOR OF PHILOSOPHY IN
THE DEPARTMENT OF BANKING AND FINANCE
This study supported by YBU Scientific Research Project Coordination Unit under Project number: 1604 as a PhD thesis
ABSTRACT
THE DYNAMICS OF FINANCIAL AND MACROECONOMIC DETERMINANTS IN NATURAL GAS AND CRUDE OIL MARKETS: EVIDENCE FROM
OECD/GCC/OPEC COUNTRIES
Karacaer-Ulusoy, Merve
Ph.D., Department of Banking and Finance Supervisor: Assoc. Prof. Dr. Ayhan KAPUSUZOĞLU
March 2016, 390 pages
This study analyzes the countries in the Organization for Economic Cooperation and Development (OECD), Gulf Cooperation Council (GCC) and Organization of the Petroleum Exporting Countries (OPEC) within the data period to test whether there is long-term or short-term relationship between world’s oil and natural gas consumption and the economic growth in the relevant countries. This analysis is undertaken in relation to the variables of world energy prices (Brent, West Texas Intermediate, Dubai, Henry Hub, Japan and Russia) and the liquidity level, stock market and industrial production of the target countries. Within the framework of this study, Augmented Dickey Fuller (ADF), Phillips-Perron (PP) and Kwiatkowski-Phillips-Schmidt-Shin (KPSS) unit root tests, Johansen cointegration and Granger causality analyses are implemented. The empirical
findings of this thesis indicate that there are multidirectional relationships between the above-mentioned variables. These relationships can be explained by the factors that each country group owns within the framework of their energy sources, financial markets, economic conditions and geographical positions. The data accrued and analyzed in this thesis is presented as a contribution to guide policymakers, global investors and researchers in constituting an extensive country specific energy, macroeconomic and financial policies.
Keywords: energy consumption, oil and natural gas prices, financial and economic developments, cointegration, causality
ÖZET
DOĞAL GAZ VE PETROL PİYASALARINDA FİNANSAL VE MAKROEKONOMİK ETKENLERİN DİNAMİKLERİ: OECD/GCC/OPEC ÜLKELERİ ÜZERİNE AMPİRİK
BİR ÇALIŞMA
Karacaer-Ulusoy, Merve
Doktora, Bankacılık ve Finans Bölümü Tez Danışmanı: Doç. Dr. Ayhan KAPUSUZOĞLU
Mart 2016, 390 sayfa
Bu çalışmada enerji, finansal ve makroekonomik değişkenler arasında kısa ve uzun dönemli olarak çeşitli ilişkilerin varlığı araştırılmıştır. Bu doğrultuda, Ekonomik Kalkınma ve İşbirliği Örgütü (OECD), Körfez Arap Ülkeleri İşbirliği Konseyi (GCC) ve Petrol İhraç Eden Ülkeler Teşkilatı (OPEC) grubunda yer alan ülkelerin toplam enerji, doğalgaz ve petrol tüketimi ile ilgili ülkelerin ekonomik büyümeleri arasındaki ilişkinin var olup olmadığı incelenmiştir. Çalışmada ele alınan diğer bir boyut ise, dünya petrol (Brent, West Texas Intermediate ve Dubai) ve doğalgaz (Henry Hub, Japonya ve Rusya) fiyatlarındaki değişimin OECD, GCC ve OPEC grubunda yer alan ülkelerin likidite seviyeleri, hisse senedi piyasaları ve sanayi üretimleri üzerinde etkili olup olmadığıdır. Araştırma sürecinde son olarak, çalışma kapsamında yer alan ülkelerinin finansal gelişmeleri ile ekonomik büyümeleri arasında kısa ya da uzun dönemli ilişkinin varlığı incelenmiştir. Çalışma kapsamında Augmented Dickey Fuller (ADF), Phillips-Perron (PP) ve
Kwiatkowski-Phillips-Schmidt-Shin (KPSS) birim kök testleri, Johansen eşbütünleşme ve Granger nedensellik analizleri gerçekleştirilmiştir. Elde edilen bulgular değerlendirildiğinde; yukarıda bahsedilen değişkenler arasında çok yönlü ilişkiler olduğu gözlemlenmiştir. İlişkilerdeki bu farklılıklar her ülke grubunun sahip olduğu enerji kaynakları, finansal piyasalar, ekonomik şartlar ve coğrafi konumlar arasındaki farklılık olmasından kaynaklanmaktadır. Tezde ele alınan verilerin ve uygulanan analizlerin politika yapıcılara, küresel yatırımcılara ve araştırmacılara ülke bazlı olmak üzere enerji, makroekonomi ve finans politikaları kapsamında katkı sağlayacağına inanılmaktadır.
Anahtar Kelimeler: enerji tüketimi, petrol ve doğal gaz fiyatları, finansal ve ekonomik gelişme, eşbütünleşme, nedensellik
ACKNOWLEDGMENTS
I would like to extend my special thanks to;
…to my thesis advisor, Assoc. Prof. Dr. Ayhan Kapusuzoğlu for his enlightening guidance, advice, encouragement, support and patience throughout my research.
…the examining committee members, Prof. Dr. Mehmet Baha KARAN, Assist. Prof. Dr. Erhan ÇANKAL, Prof. Dr. Nildağ Başak CEYLAN and Assoc. Prof. Dr. Mustafa İBİCİOĞLU for their precious contributions and criticisms.
…my friends for their support and encouragements.
I would also like to extend my sincerest gratitude and appreciation to;
…my all family members for guiding me to academic world and for their invaluable love, support and encouragements.
…AND to my dear husband Serkan ULUSOY for his efforts, technical assistance, encouragement, love and patience.
TABLE OF CONTENTS
PLAGIARISM PAGE ...iii
ABSTRACT ... iv
ÖZET ... vi
ACKNOWLEDGMENTS ... ix
TABLE OF CONTENTS ... x
LIST OF TABLES ... xiii
LIST OF FIGURES ... xv
LIST OF ABBREVIATIONS ... xvi
CHAPTER 1 INTRODUCTION ...1
2 WORLD OIL AND NATURAL GAS MARKETS ...6
2.1 THE HISTORY OF OIL ...7
2.2 OIL PRICES ...9
2.3 NATURAL GAS MARKETS ... 10
2.4 NATURAL GAS PRICES ... 11
2.5 PRODUCERS, CONSUMERS, NET EXPORTERS AND NET IMPORTERS OF CRUDE OIL ... 13
2.6 PRODUCERS, CONSUMERS, NET EXPORTERS AND NET IMPORTERS OF
NATURAL GAS ... 15
3 THEORETICAL BACKGROUND OF THE FACTORS AFFECTING THE ENERGY MARKETS ... 18
3.1 THEORETICAL APPROACHES TO THE RELATIONSHIP BETWEEN ENERGY AND ECONOMIC GROWTH ... 18
3.1.1 Classical Growth Model ... 19
3.1.2 Neo-Classical Growth Model ... 19
3.1.3 Ecological Growth Model ... 21
3.2 EMPIRICAL LITERATURE ON THE CAUSAL RELATIONSHIP BETWEEN ENERGY CONSUMPTION AND ECONOMIC GROWTH ... 24
3.3 THEORETICAL APPROACHES TOWARDS ENERGY MARKETS AND THE FINANCIAL/ ECONOMIC VARIABLES ... 31
3.4 EMPIRICAL LITERATURE CONCERNING THE RELATIONSHIP BETWEEN ENERGY MARKETS AND FINANCIAL/ ECONOMIC VARIABLES ... 33
3.5 EMPIRICAL LITERATURE ON THE RELATIONSHIP BETWEEN ENERGY MARKETS AND LIQUIDITY ... 40
3.6 THEORETICAL APPROACHES TO THE RELATIONSHIP BETWEEN FINANCIAL DEVELOPMENT AND ECONOMIC GROWTH ... 42
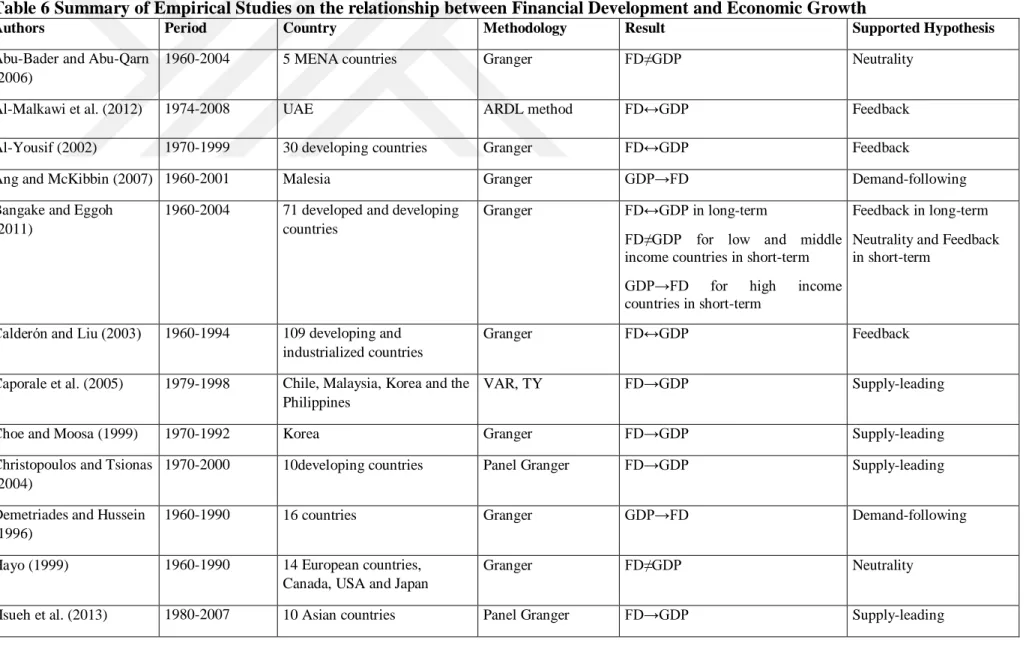
3.7 EMPIRICAL LITERATURE ON THE RELATIONSHIP BETWEEN FINANCIAL DEVELOPMENT AND ECONOMIC GROWTH ... 44
4 DATA SET AND METHODOLOGY ... 50
4.1 DATA SET ... 50
4.2 METHODOLOGY ... 57
4.2.1 Unit Root Tests ... 58
4.2.1.1 Augmented Dickey Fuller Test ... 58
4.2.1.2 Phillips-Perron Test ... 59
4.2.1.3 Kwiatkowski-Phillips-Schmidt-Shin Test ... 60
4.2.2 Cointegration Analysis ... 60
4.2.3 Granger Causality Test Based on VECM ... 61
4.3 EMPIRICAL FINDINGS ... 63
4.3.1 Results of the Unit Root Tests ... 63
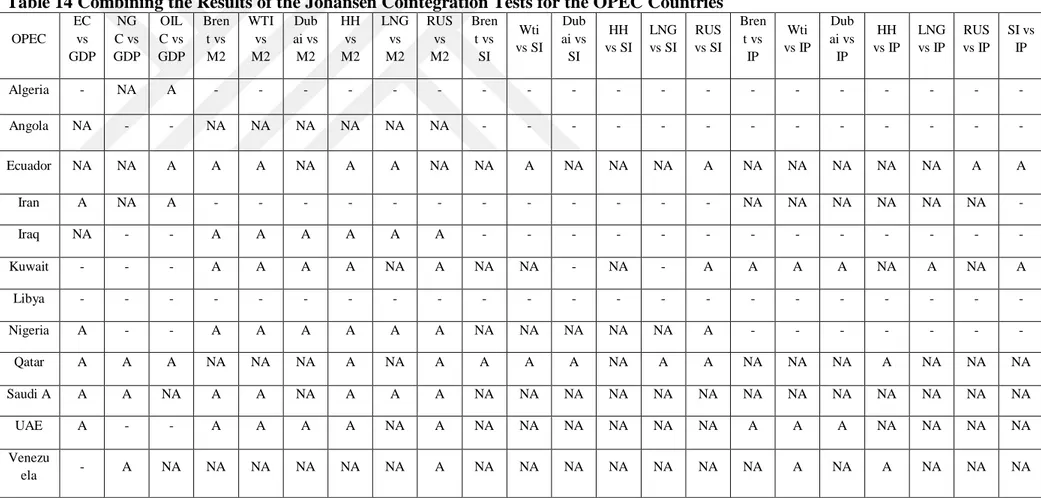
4.3.2 Results of the Johansen Cointegration Tests ... 71
4.3.3 Results of the Granger Causality Tests ... 84
5 CONCLUSIONS ... 103
REFERENCES ... 108
APPENDICES ... 119
A. ANALYSIS RESULTS OF OECD COUNTRIES ... 119
B. ANALYSIS RESULTS OF GCC COUNTRIES ... 306
C. ANALYSIS RESULTS OF OPEC COUNTRIES ... 315
CURRICULUM VITAE ... 366
LIST OF TABLES
Table 1 Producers, Consumers, Net Exporters and Net Importers of Crude Oil ... 14
Table 2 Producers, Consumers Net Exporters and Net Importers of Natural Gas ... 17
Table 3 Summary of Empirical Studies on the Causal relationship between Energy Consumption and Economic Growth ... 25
Table 4 Summary of Empirical Studies on the relationship between Energy Markets and Financial/Economic Variables ... 34
Table 5 Summary of Empirical Studies on the relationship between Energy Markets and Liquidity ... 36
Table 6 Summary of Empirical Studies on the relationship between Financial Development and Economic Growth ... 45
Table 7 Countries that are used in the Study ... 51
Table 8 Data Period of the Country Set ... 54
Table 9 : Combining the Results of the Unit Root Tests for the OECD Countries ... 64
Table 10 Combining the Results of the Unit Root Tests for the GCC Countries... 67
Table 11 Combining the Results of the Unit Root Tests for the OPEC Countries ... 69
Table 12 Combining the Results of the Johansen Cointegration Tests for the OECD Countries ... 72
Table 13 Combining the Results of the Johansen Cointegration Tests for the GCC Countries ... 78
Table 14 Combining the Results of the Johansen Cointegration Tests for the OPEC Countries ... 81
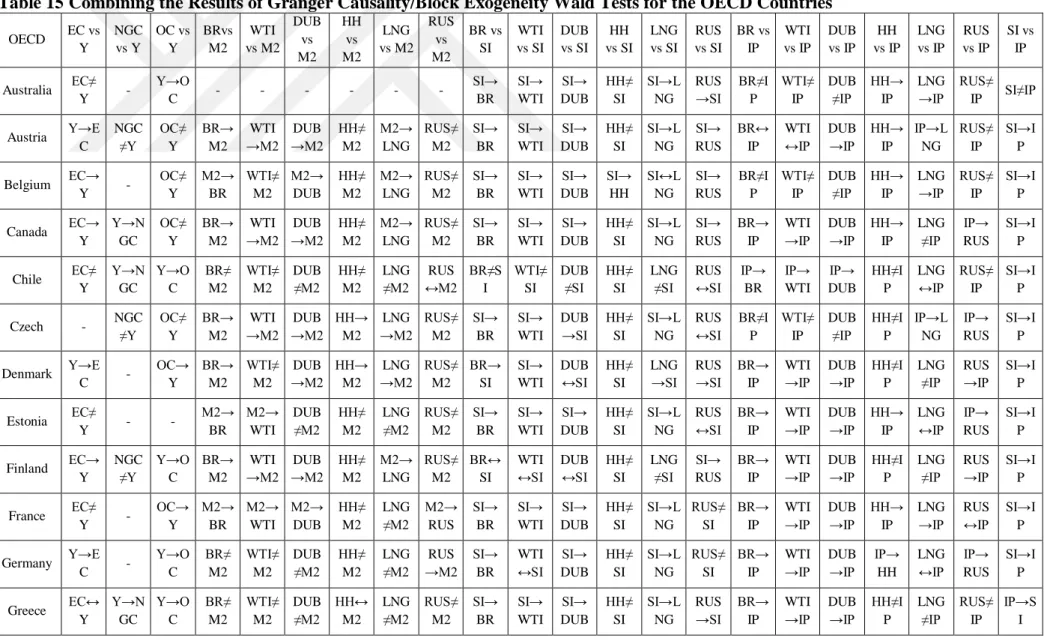
Table 15 Combining the Results of Granger Causality/Block Exogeneity Wald Tests for the OECD Countries ... 85
Table 16 Combining the Results of Granger Causality/Block Exogeneity Wald Tests for the GCC Countries ... 93 Table 17 Combining the Results of Granger Causality/Block Exogeneity Wald Tests for the OPEC Countries ... 98 Table 18 Summary of Granger Causality Test Results ... 102
LIST OF FIGURES
Figure 1 Henry Hub and West Texas Intermediate Prices (1997-2015) ...6
Figure 2 Crude Oil Prices 1861-2014 ...9
Figure 3 Spot Prices for Selected Benchmark Crude Oils (1976-2013) ...9
Figure 4 USA Energy Production by fuel, 1980-2040 ... 11
Figure 5 Natural Gas Prices in Japan, German, UK, USA and Canada (1997-2014) ... 12
Figure 6 The Process of the Ecological and Neo-Classical Approaches ... 22
Figure 7 Graphs of Oil and Natural Gas Prices (Log Level) (1980.01-2015.12) ... 52
xvi
LIST OF ABBREVIATIONS
ADF Augmented Dickey-Fuller Test
BP British Petroleum
GCC Gulf Cooperation Council
GDP Gross Domestic Product
HH Henry Hub
IEA International Energy Agency
IMF International Monetary Fund
KPSS Kwiatkowski-Phillips-Schmidt-Shin Test
OECD Organization for Economic Co-operation and Development OPEC Organization of the Petroleum Exporting Countries
PP Phillips-Perron Test
UAE United Arab Emirates
UK United Kingdom
USA United States of America
VAR Vector Autoregressive Model
VECM Vector Error Correction Model
1 CHAPTER
1 INTRODUCTION
Energy and its sustainability is one of the most important issues of today’s world. The increased consumption of fossil fuels such as oil, coal and natural gas amplified the importance that should be given to energy issues. Within the process of globalization it cannot be denied that economic activity and energy consumption are interdependent. According to Sari, Ewing, and Soytas (2008) energy is a final good for end-users besides being an input in the production process of business sector. Yıldırım, Sukruoglu, and Aslan (2014) revealed that energy consumption and economic development are interdependent since energy is the key component in production process therefore, when a country’s production process depends on energy, energy conservation policies may restrict its economic activities. Economic growth represents the level of a country’s welfare; thus it is highly critical to understand the causal relationship between energy consumption and economic growth and the factors that affect economic growth (Apergis & Payne, 2010b; Apergis & Payne, 2010c; Kraft & Kraft, 1978; Squalli, 2007; Payne, 2010).
Energy sources have a very important place in national economies but due to globalization the required inputs and outputs may not be in the same region. Furthermore, in the situation when there is a disruption of oil and natural gas supplies world oil and natural gas prices are affected, and this impacts on the countries’ status as an importer or exporter, in addition this can significantly affect various financial and macroeconomic aspects.
From 1948 to 1972, oil prices were less than $3.50per barrel then following the 1973 oil supply shock, by 1974 oil prices had risen, globally, to $12 per barrel. This dramatic increase resulted from the oil embargo declared by Organization of the Petroleum Exporting Countries (OPEC) in response to the United States army supporting Israel in
Arab-Israel War. The embargo restricted the export of petroleum and introduced a cut in oil production. The later oil supply shock of 1979 was a result of the Iranian Revolution after which Iran cuts oil production and exportation and once again oil prices rose. These rises in oil prices provided higher profit margins for OPEC countries however, they led to recession for oil-dependent countries. In 2008 the financial crisis led to a recession and a fall in oil prices. The war in Libya in 2011, led to a decrease in oil production and prices rose to the 2008 level of approximately $91. At the beginning of 2014, the price of Brent oil reached $108 per barrel. Then, a small change in China's level of oil demand and a strong shock to the global supply, in 2015 oil prices dropped by approximately 50% which is expected to result in loss in revenue for oil exporting countries. The current Brent oil price level (approximately $29) is under the 2008 price level. This fall in prices may continue however, a new oil shock may also occur in the near future. In such a case, the data presented in this study can guide policymakers, global investors and researchers in designing effective and less costly tools to mitigate the effect of oil price shocks.
The volatility of oil prices has drawn attention to the importance of the effects of energy prices on macroeconomic activities. These effects have been considered using two different approaches. Many researchers have researched the effects of the oil prices shocks of the 1970s and 1980s on macroeconomic variables such as gross domestic product (GDP), inflation, interest rates, industrial production, productivity or liquidity. Numerous other researchers have investigated channels through which energy prices can affect macroeconomic variables (Burbidge & Harrison, 1984; DePratto, De Resende, & Maier, 2009; Ferderer, 1997; Hamilton, 2008; Kilian, 2008).
Theoretically, the increase in oil prices can have various effects four of which are given below. First, there is the supply-side effect in which in the case of increased energy prices, the input cost of the company increases while productivity and accordingly profitability decrease this in turn might force organizations to reduce new capital investments or use energy-efficient capital. Second is the demand-side effect. This refers to the income transfer from the oil importing countries to the oil exporting countries, which damages the aggregate demand in oil importing countries since the decrease in purchasing power of oil importing countries is higher than the increase in purchasing power of oil exporting countries. Third, the real-balance effect which is namely that increased energy prices have both direct and indirect effects on inflation. Initially, the increased energy prices will
slowdown economic activities and cause inflation. Then, due to the higher prices of oil products (such as gasoline and heating-oil) the price of alternative energy sources will also increase. Thus, an indirect effect occurs due to the behavioral responses of companies and their workers, this is also called a second round effect. In this case firms can reflect the increased input costs in the prices of non-energy products. Furthermore, with the increased cost of living, workers can demand higher wages. A corruption in price-wage loop can damage the wealth of households, by reducing consumption and output. The fourth way that higher energy prices affect the economy is through the monetary policy channel. Increased energy prices decrease consumption, investment and stock prices, increase unemployment and construct new production methods which are less dependent on oil inputs (Cologni & Manera, 2008; Kumar, 2005).
It has been observed that the increases in oil prices cause recession especially in industrialized countries, slowdown the productivity and growth, besides cause inflation (Barsky & Kilian, 2004; Hamilton, 1983; Mork & Hall, 1979). On the other hand, the effects of oil price changes differ depending on countries level of development, stage of economy and its organizational structure. For example; in oil-importing countries the increase in oil prices raises inflation and input costs, which effect manufacturing and transportation industries, besides leads to a decrease in demand of non-oil products; reflecting the lower purchasing power. Furthermore, a slowdown in economic growth leads to a reduction in labor demand; in other words employment level. On the fiscal side, government expenditures rise on the one hand and tax revenues drop on the other, leading to an increase in the budget deficit and interest rates (Yıldız & Karacaer-Ulusoy, 2015). These macroeconomic issues and their important impact on the financial system have also been discussed in the literature over many years (Lucas, 1988; Patrick, 1966; Robinson, 1952; Schumpeter, 1911). In particular, after 1980; the outcomes of financial liberalization regarding the financial system began to achieve prominence. The financial system plays a crucial role in encouraging the development of economic activities since the system includes financial markets, insurance companies, security markets, banks, other financial intermediaries and the supervision of these intermediaries. Knowledge acquisition, the costs of the execution of contracts and transactions have led need for financial contracts, markets and intermediaries. The differential costs due to administrative, legal and tax differences have led to the creation of district financial contracts, markets and
intermediaries between countries (Levine, 2004). There are several views about the direction of the causal relationship between financial development and economic growth. A common view is that financial liberalization increases the shared risk; which in turn lowers the cost of equity while raising the borrowed money, capital accumulation, investments besides the demand for energy, and ultimately improves economic growth (Greenwood & Jovanovic, 1989; Sadorsky, 2010). On the other hand, others believe that financial liberalization may have negative effects on the countries that do not have strong legal institutions. According to those supporting this view, the high level of liberalized financial markets causes the total real credits of domestic firms to decrease, which in turn results in a slowdown of investments and economic growth (Samargandi, Fidrmuc, & Ghosh, 2014).
The importance of the energy sources and their effects on the financial and macroeconomic factors are the motivation for this research. This study is the one of the first that focuses on energy consumption and prices (oil and natural gas), economic performance (economic growth, industrial production and liquidity) and financial development (stock market). For that purpose, it investigates the relationship between energy consumption, energy prices, the stock market index and the economic performance in the OECD, GCC and OPEC. The first tested hypothesis during the selected data period is whether causality exists between the global total energy, oil and natural gas consumption and economic growth in the target countries. The second hypothesis to be tested is whether there is an evidence of causality between the world energy prices (Brent oil, West Texas Intermediate (WTI), Dubai, Henry Hub (HH), Japan and Russia) and the stock market, liquidity level and industrial production of the selected countries. Finally, the existence of causality between financial development and the economic growth of the target countries is tested.
This study provides comprehensive and detailed evidence within the scope of the target countries (OECD; GCC and OPEC) revealing which factors have a greater impact within the international arena. The factors and the relationships will be presented separately for each country. This study contributes to the existing literature by offering policymakers, global investors and researchers a deeper understanding of the relationship between the oil and natural gas markets and macroeconomic activities. Furthermore, this study aims to fill
a gap in the literature by presenting more information on the financial development and the economic growth of an extensive number of country groups.
The thesis is organized as follows. Chapter II provides information about world oil and natural gas markets by presenting statistics about production, consumption, importation and exportation. Chapter III contains the theoretical framework and empirical literature concerning energy and energy consumption, energy prices and liquidity, energy markets and financial/economic variables, and financial development and economic growth. The data set, econometric models are utilizes in the analyses and the empirical results obtained from these analyses are introduced in Chapter IV. The final chapter discusses the policy implications of the findings.
CHAPTER II
2 WORLD OIL AND NATURAL GAS MARKETS
Theoretically, crude oil and natural gas prices are associated because they are used as substitutes in consumption and complements in production (Figure 1). For example, Villar and Joutz (2006) indicate that there is a long-term cointegrating relationship between HH and WTI prices, while Brown and Yücel (2009) also prove that crude oil prices have an important and significant effect on natural gas prices of the United Kingdom (UK) and the east coast of the United States of America (USA).
Figure 1 Henry Hub and West Texas Intermediate Prices (1997-2015)
Source: Energy Information Administration, Short-Term Energy Outlook (2016) 0 20 40 60 80 100 120 1997 1999 2001 2003 2005 2007 2009 2011 2013 2015
Henry Hub Spot (dollars per thousand cubic feet)
West Texas Intermediate Spot Average (dollars per barrel)
This section provides historical and statistical information about global oil and natural gas markets. The historical information was obtained from Hamilton’s (2011) study, the historical crude oil chart (Figure 2) and statistical information of crude oil and natural gas was taken from International Energy Agency (IEA, 2014) and British Petroleum (BP, 2015).
2.1 THE HISTORY OF OIL
The West Coast Gasoline Famine of 1920 was the first oil-related shock of the 20th century. According to Hamilton (2011), the real economic importance of oil emerged in the 20th century. There was an incredible increase in demand for oil and the production capacity of the USA was unable to meet this demand. The increased production level in 1920 together with the reduction of demand with the Great Depression of 1929 caused oil prices to decrease and resulted in a second oil shock.
Hamilton (2011) investigated the oil shocks that occurred after World War II. Between 1945-1947 period the US demand for oil products had increased by 12%, which led to an 80% increase in oil prices. In 1952-1953, Iran’s oil was nationalized, in response to this act a world boycott to Iranian oil began which resulted in oil supply disruptions and raised oil prices. The oil shock of 1956-1957 occurred as a result of the Suez Crisis in which Egypt nationalized (the English French company that operated the) Suez Canal. This action created chaos for Israel, UK and France. The closure of Suez Canal formed many difficulties for Europe, which mainly meets its oil demand from Middle East and this reduction in the demand for oil caused oil prices to increase.
According to Hamilton (2011) the price increases of 1969-1970 period are mainly response to the inflationary pressures of the 1970 period. Hamilton (2011) categorizes the oil price shocks that occurred between 1973 and 1996 as the age of OPEC. In 1973-1974, Syria and Egypt attacked Israel and in response, OPEC announced an oil embargo on the countries that supported Israel against the armies of the Arab countries. This embargo restricted the export of petroleum to the USA and west countries, while introducing a cut in OPEC’s total oil production. As a result of this embargo, there was an extreme rise in oil prices. As
stated by Hamilton (2011) OPEC’s action demonstrates the importance of geopolitical events as well as economic factors on the oil market.
In 1979 the Iranian Revolution and the country cutting its oil production and export creating another oil crisis. In this case, the majority of the lost Iranian oil production was met by Saudi Arabia. Following the Iranian Revolution in 1980, the Iran-Iraq war began and oil prices continued to increase. According to Hamilton (2011), this process that began with the Iranian revolution, can be considered as an oil shock. While these rises in oil prices provided higher profit margins for OPEC countries; they led to recession for oil-dependent countries. As a result, the aggregate demand for oil started to decrease causing oil prices to collapse in 1986. Hamilton (2011) indicates this fall as an oil shock for producers. On the other hand, the invasion of Kuwait by Iraq in 1990 initiated the first Persian Gulf War and thus, there was a new oil shock due to the increased oil prices. Hamilton (2011) calls the period of 1997-2010 the new industrial age. In this period, the world economy had shown a significant growth, especially with the growth of the economies in the Middle East, China and Asia. In 1999, the Asian crisis erupted and with the decrease in the demand for oil, prices started to fall and reached a more reasonable level. Then financial crisis of 2008 led to a worldwide recession and consequently oil prices fell dramatically from $134 per barrel in June 2008 to $39 per barrel in February 2009. In 2011, the civil war in Libya caused a decrease in oil production and oil prices rose to the 2008 level.
At the beginning of 2014, the price of Brent crude oil was $108 per barrel. In 2014, the most important expansion was on the supply side with the USA recording the largest increase in oil production from shale reserves. However, demand was weaker compared to supply because although the production of non-OPEC increased, OPEC did not cut its oil production in order to protect its market share. In this period, excluding the financial crisis of 2008, global primary energy consumption was at its lowest since the 1990s. With a small change in China's level of demand and a strong global supply shock, in 2015 oil prices decreased by approximately 50% and dropping to $47 in January 2015. Baumeister and Kilian (2015) gave the reason for the oil shock of 2014 as being the sudden decrease of oil prices associated with the decline in global real economic activities. However, the production of shale gas by the USA should be ignored when considering the recent oil shock in 2014.
Figure 2 Crude Oil Prices 1861-2014
2.2 OIL PRICES
According to Energy Information Administration (EIA, 2016) the most used global crude oil prices as a benchmark are Brent, WTI, Dubai and Nigerian oil. Figure 3 indicates that there is a strong co-movement among these four crude oil prices, which makes it easier for both buyers and sellers without exposing them to huge crude oil price differences.
Figure 3 Spot Prices for Selected Benchmark Crude Oils (1976-2013)
Brent is a benchmark for light, sweet crude oil that is produced in the North Sea; Brent and
Forties, Ekofisk and Oseberg. In 2013, the loadings of Brent oil were about 1% of the world’s total crude oil production. It is used to price the crude oil produced and traded in Europe, Africa, the Mediterranean and Australia. As it is light and sweet it is efficient for diesel fuel and gasoline refining. One big great advantage of Brent oil is that it is easy to transport to distant locations.
WTI is a light, sweet oil that is produced in the American states of Cushing and Oklahoma.
It is also efficient for gasoline refining.
Dubai is medium sour oil, and is mainly used to price the oil produced in the Middle East.
It is the main benchmark for Persian Gulf oil which is exported to the Asian market.
Nigerian Forcados crude oil is a light crude oil and a benchmark for Nigeria.
2.3 NATURAL GAS MARKETS
Natural gas is believed to be one of the most important energy sources that will meet the global energy demand in the near future. The prospects of EIA (2014) indicate that the production of natural gas will be higher than the production of any other energy sources in the USA (Figure 4). The gas is transported as liquefied natural gas (LNG) at -260 degrees Fahrenheit through pipelines to a liquefaction facility, which is generally located next to a port or railhead. LNG is then loaded onto a ship or a railroad car to be delivered to the facility destination where it is re-gasified and sent to the required destination through pipelines (Kapusuzoglu, Liang, & Karacaer-Ulusoy, 2015).
Figure 4 USA Energy Production by fuel, 1980-2040
Source: EIA, 2014
There are three basic regional natural gas markets; North America, Europe (including Russia and North Africa) and Asia which links to the Persian Gulf. North America mainly imports from Canada and Mexico, Europe primarily imports from Norway, Russia and Algeria and Japan/South Korea primarily imports from Indonesia, Australia, Malaysia and the Middle East (Siliverstovs, L’Hégaret, & Von Hirschhausen, 2005).
These markets have different price structures. In USA there is gas-on-gas competition and an open access to pipeline transportation whereas Asia takes crude oil as a benchmark while pricing natural gas (MIT Energy Initiative, 2011). Europe is secured with long-term, oil-indexed contracts whereas in the UK market pricing has been adopted which occurs at a virtual trading location, called the National Balancing Point (NBP).
2.4 NATURAL GAS PRICES
From the beginning of the gas trade, the natural gas prices had been linked to oil indexation. The 1990s, marked the beginning of the liberalization of Europe's natural gas markets, and this provide the opportunity for gas to be priced at the hub cost which
provides flexibility especially for long-term contracts. A trading hub is a physical or virtual place where the exchange of natural gas can be implemented by market participants. A physical hub has storage capacities, such as LNG stations or gas pipelines, whereas trading in a virtual hub gas occurs within the regional or national transmission grid system. At a virtual hub, quantities of gas are transferred from a transmission system operator to an exit network operator. Each day, both the entry and exit quantities have to be balanced.
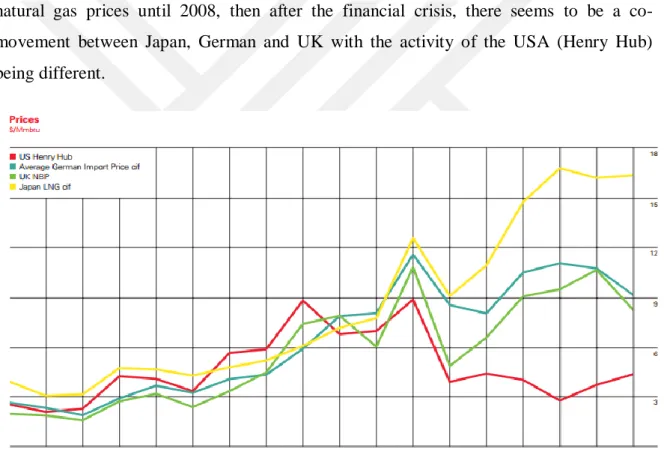
According to BP (2015), the most frequently used global natural gas hubs as a benchmark are USA (Henry Hub), Canada (Alberta) and the UK (NBP). On the other hand, the most used contract prices are the Japan and German imports from Russia which are represented by LNG imports. Figure 5 shows that there is a strong co-movement between these four natural gas prices until 2008, then after the financial crisis, there seems to be a co-movement between Japan, German and UK with the activity of the USA (Henry Hub) being different.
Figure 5 Natural Gas Prices in Japan, German, UK, USA and Canada (1997-2014)
2.5 PRODUCERS, CONSUMERS, NET EXPORTERS AND NET IMPORTERS OF CRUDE OIL
The data related to crude oil production, consumption, import and export are given in Table 1. According to the results; the amount of total production of the first three crude oil producing countries is more than 30 percent of world crude oil production distributed as follows; Saudi Arabia 12.9%, Russia 12.6% and USA 12.1% production levels respectively. The total consumption of the first three crude oil consuming countries is more than 30 percent of world crude oil consumption, comprising USA 19.9%, China 12.4% and Japan 4.7%. The total net export amount of the first three crude oil exporting countries is more than 30 percent of world crude oil exports as follows; Saudi Arabia 19.5%, Russia 12.2% and United Arab Emirates (UAE) 6.5%. The total net import amount of the first three crude oil importing countries is more than 40 percent of world crude oil imports, comprising; USA 19.6%, China 14% and India 9.5%.
The results show that most of the crude oil producing and exporting countries are members of OPEC and GCC; while most of the crude oil consuming and importing countries are OECD members. The results also draw attention to other points; firstly, Saudi Arabia and Russia are the two countries that produce and export most crude oil. This may be because as they have oil fields they produce crude oil more than they consume. Secondly, the first four countries that mostly consume and import crude oil are the same; USA, China, Japan and India; they are not in the list of first 10 world countries that export crude oil. Thus, the USA, China, Japan and India are consuming crude oil more than they produce.
Table 1 Producers, Consumers, Net Exporters and Net Importers of Crude Oil
Producers* % Consumers* % Net Exporters** % Net Importers** %
Saudi Arabia (GCC, OPEC) 12.9 USA (OECD) 19.9 Saudi Arabia (GCC, OPEC) 19.5 USA (OECD) 19.6
Russia 12.6 China 12.4 Russia 12.2 China 14
USA (OECD) 12.1 Japan (OECD) 4.7 UAE (GCC, OPEC) 6.5 India 9.5
China 5 India 4.3 Iraq
(OPEC) 6.1 Japan (OECD) 8.9 Canada (OECD) 5 Russia 3.5 Nigeria (OPEC) 5.6 Korea (OECD) 6.2 Iran (OPEC) 4 Saudi Arabia (GCC, OPEC) 3.4 Kuwait (OPEC) 5.3 Germany (OECD) 4.6 Iraq (OPEC) 3.8 Brazil 3.4 Canada (OECD) 5.2 Italy (OECD) 3.3 Kuwait (GCC, OPEC) 3.8 South Korea (OECD) 2.6 Venezuela (OPEC) 5.1 Spain (OECD) 3.0 UAE (GCC, OPEC) 3.7 Germany (OECD) 2.6 Angola (OPEC) 4.4 France (OECD) 2.8 Venezuela (OPEC) 3.6 Canada (OECD) 2.4 Mexico (OECD) 3.2 Netherlands (OECD) 2.7
Others 33.5 Others 40.8 Others 26.9 Others 25.4
World 100 World 100 World 100 World 100
15
2.6 PRODUCERS, CONSUMERS, NET EXPORTERS AND NET IMPORTERS
OF NATURAL GAS
Table 2. According to the results; the amount of total production of the first three natural gas producing countries is more than 40 percent of world natural gas production distributed as follows; USA 20.7%, Russia 18.3% and Iran 4.8%. The total consumption of the first three natural gas consuming countries is more than 40 percent of world natural gas consumption, comprising; USA 22.7%, Russia 12.0% and China 5.4%. The total net export amount of the first three natural gas exporting countries is more than 40 percent of world natural gas exports as follows; Russia 21.4%, Qatar 14.2% and Norway 12.8%. The total net import amount of the first three natural gas importing countries is more than 30 percent of world natural gas imports, comprising; Japan %15.7, Germany 8.3% and Italy 6.9%. The results show that most of the natural gas producing and exporting countries are OPEC members; while most of the natural gas consuming and importing countries are members of OECD. The results also reveal various aspects; USA and Russia are the two countries that mostly produce and consume natural gas; Russia exports the most natural gas. On the other hand; while USA is not in the export list of first 10 world countries it ranks eighth in the import list. Thus; Russia is produces more than it consumes, and the USA consumes more than it produces.
Table 2 Producers, Consumers Net Exporters and Net Importers of Natural Gas
Producers* % Consumers*** % Net Exporters* % Net Importers* %
USA (OECD) 20.7 USA (OECD) 22.7 Russia 21.4 Japan (OECD) 15.7
Russia 18.3 Russia 12.0 Qatar (GCC, OPEC) 14.2 Germany (OECD) 8.3 Iran (OPEC) 4.8 China 5.4 Norway (OECD) 12.8 Italy (OECD) 6.9 Canada (OECD) 4.6 Iran (OPEC) 5.0 Turkmenistan 6.8 China 6.1 Qatar (GCC, OPEC) 4.5 Japan (OECD) 3.3 Canada (OECD) 6.7 Korea (OECD) 6.0
China 3.7 Saudi Arabia (GCC, OPEC) 3.2 Algeria (OPEC) 5.4 Turkey (OECD) 5.9 Norway (OECD) 3.2 Canada (OECD) 3.1 Indonesia (OPEC) 4.1 France (OECD) 4.7 Turkmenistan 2.5 Mexico (OECD) 2.5 Netherlands (OECD) 3.6 USA (OECD) 4.0 Saudi Arabia (GCC, OPEC) 2.4 Germany (OECD) 2.1 Nigeria (OPEC) 3.0 UK (OECD) 3.9 Algeria (OPEC) 2.3 UAE (GCC, OPEC) 2.0 Australia (OECD) 3.0 Spain (OECD) 3.4
Others 33.0 Others 60.3 Others 19.0 Others 35.0
World 100 World 100 World 100 World 100
18 CHAPTER III
3 THEORETICAL BACKGROUND OF THE FACTORS AFFECTING THE
ENERGY MARKETS
The relationship between energy markets and financial variables is one of the issues that have attracted many researchers. Initially, most of the studies focused on developed countries. However, with the shocks in oil prices starting to affect the entire world, the numbers of countries that have been examined have also increased. In this section first the assumptions of classical, neo-classical and ecological growth models and the empirical literature between energy and economic growth will be examined. Secondly, the relationship between energy markets and financial variables will be introduced followed by a discussion of the theory behind empirical studies on the basis of relevant variables. In the last section, the theoretical relationship between financial development and economic growth will be explained, and then a review of the relevant studies in literature will be presented.
3.1 THEORETICAL APPROACHES TO THE RELATIONSHIP BETWEEN
ENERGY AND ECONOMIC GROWTH
Economic growth is defined as the quantity of goods and services produced in a particular period within a particular economy. The relationship between energy and economic growth has an important place in the economic literature. The common belief presented in the literature is that energy affects economic growth through domestic production growth, total factor productivity, resource allocation and employment opportunities through the impact of factors such as the substitution-complementarity relationship between energy and
capital, developments in technology and the changes in energy input-output combination (Yapraklı, 2013).
3.1.1 Classical Growth Model
The classical, neo-classical and ecological growth models are the three basic approaches that explain the relationship between energy and economic growth. From 1776 to 1843 the work of Adam Smith, Thomas R. Malthus and David Ricardo focused on the theory of economic growth. Dominant in this historical period, energy is not addressed as a factor of production; rather the main source of economic activities is the land (nature) and as nature is a limited resource the economic activities are also limited. In other words, energy is not directly considered as a factor of production, instead it is taken into consideration as an intermediate good. In this context, the classical economists divide economy into two main sectors; agriculture and industry. According to these classicists, while land is cultivated with labor in the agriculture sector, it does not have any importance in the industrial sector. In addition, the classical economists argue that the amount of land is fixed, but can vary in quality, and this fixed amount of land leads to diminishing returns of labor and capital in the agriculture sector. This declining productivity indicates the limitations that land put on the economy. Classical economists believe that it is possible to obtain natural resources through different forms of energy like light, heat, electricity, plant life, wind, elasticity, gravitation (Alam, 2006).
3.1.2 Neo-Classical Growth Model
Neo-classical approach that appeared in the late nineteenth century associates economic growth with human capital, labor and foreign technology. The energy and economic growth relationship is ignored while treating energy indirectly; as a raw material or intermediate good. This is mainly because in the neo-classical approach land is not considered as a factor of production due to the limited land supply. In other words, neo-classical economists ignore the relationship between land and economy (Alam, 2006).
This approach treats the economy as a closed system where goods are produced with inputs of capital and labor and then the products are delivered to the customers and companies. To create economic growth the inputs of human capital or labor should be increased. In addition, improvements in terms of technological developments and the quality of inputs of human capital or labor provide support for economic growth. In the neo-classical approach, the impact of natural resources on economic growth divided into the two distinct groups of renewable and non-renewable is also taken into consideration and these resources are allocated (Ockwell, 2008).
The neo-classical growth model has been categorized under three mainstream models. The first is the Solow (1956) in which, growth is the transition stage that moves a country towards stability. An underdeveloped country with low capital per worker can generate capital accumulation while at the same time exhibiting rapid growth. In contrast, if saving rate remains constant, the economy will reach the point of equilibrium over time when the growth rate is zero. It is not possible in either example to obtain infinite growth by only generating capital accumulation. If saving rates increase, even though growth will occur for some time until a new equilibrium is reached, higher saving rates will lead to lower living standards. According to the neo-classical growth theory, sustainable economic growth can be achieved only through technological developments (Stern & Cleveland, 2004). Neo-classicists believe that all the economies will grow until a certain point of equilibrium at which it is impossible to make additional investments. For any growth beyond the equilibrium point, to achieve ongoing economic growth, it is essential to have technological development. It is only possible to increase existing capital returns with the advances in technology (Ockwell, 2008; Solow, 1956).
The second model focuses on the role of natural capital consumption in ensuring sustainable economic growth. In other words, natural resources are treated as a source of growth. According to this model, although there is an abundance amount of resources such as sunlight or hydrogen, the amounts of all natural resources are limited furthermore, some environmental resources are non-renewable. This situation leads to the problem of sustainable economic growth and development. This means there will be a positive impact on sustainable economic growth in the situation where there are multiple inputs such as capital and natural resources, the dependence on a single input will lead to the opposite of this situation. In the neo-classical literature, the main focus of economic growth is to
determine in which circumstances there will be sustainable economic growth. Sustainable economic growth; in other words, non-declining consumption is determined according to technical and institutional conditions. While technical conditions contain a mix of renewable and non-renewable resources, the initial donations of capital and natural resources and the convenience of substitution among inputs, institutional conditions contain the market structure, property rights system and systems for the welfare of future generations. When natural resources are depleted, in terms of production they will be replaced with their substitutes or equivalents of fake capital. While the neo-classics are interested with institutional arrangements that provide sustainable economic growth, they neglect the technical arrangements. The reason for this is that they assume that sustainable growth is technically possible (Stern & Cleveland, 2004).
In the final growth model, natural resources as well as technological changes are addressed in terms of ensuring economic growth. According to this model, in addition to the substitution of capital for resources, technological development can also provide economic growth or at least a level of constant consumption in the case of limited resources. In this model, while the increase of the total factor productivity technically makes economic sustainability easier, sustainability can be possible even with an elasticity of substitution that is less than one. However, this does not mean that there will be sustainability because of technical feasibility (Smulders, 2004; Stern & Cleveland, 2004).
For the three traditional economic growth models described above, the contribution of energy to economic activities is only taken into account in relation to the cost of production. From the economic perspective, these models consider energy as an “intermediate good” in production instead of an “essential input”. In this context, separating economic growth arising from energy use is an acceptable probability (Ockwell, 2008).
3.1.3 Ecological Growth Model
One of the first scientists to criticize that energy was ignored in economic theory was N. Georgescu-Roegen (1976). In his fund-flow model he showed that there are two aspects of the production process; the flow of materials, energy and information (material cause) is
transformed by human labor and manufactured capital (the efficient cause) in his fund-flow model (Stern & Cleveland; 2004). Georgescu-Rogen believes that the damage to the environment caused by the increase in output is ignored, and this situation destroys energy resources as they are non-reproducible.
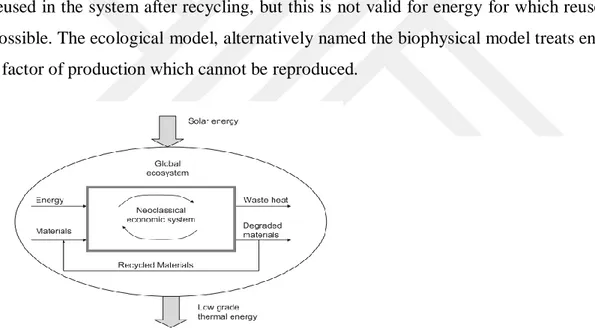
Ecological economists criticize the neo-classical view as failing to ground economic activities by not considering the physical reality. They believe that considering economy as an open subsystem of the global ecosystem is a more realistic view. Figure 6 shows the process of the ecological and neo-classical approaches in which the neo-classical system is considered as a subsystem within the ecological system. Ecological economists criticize the neo-classical model for failing to include natural resources and waste products. Within the context of the ecological model, energy and raw materials are used and thrown out as waste heat and degraded materials in the neo-classical model. Degraded materials are reused in the system after recycling, but this is not valid for energy for which reuse is not possible. The ecological model, alternatively named the biophysical model treats energy as a factor of production which cannot be reproduced.
Figure 6 The Process of the Ecological and Neo-Classical Approaches
Source: Ockwell, 2008
Reproducibility is one of the key concepts in the economics of production. In the production process some inputs are non-reproducible, and others are reproducible in return for certain costs. Capital, labor and in the long-term natural resources are considered as reproducible factors of production, while energy is not (Stern, 1999). In this context, the role and existence of energy in economics of production are subject to discussion by many scientists and ecological economists.
In the context of the law of thermodynamics, the first law, energy and mass conservation, states that in any conversion process the energy input and output should be equal (Ayres; 1998). To obtain a particular level of output, greater or equal amounts of matter should be used as the input, and the remainder should be considered as waste matter. For this reason, in a particular production process that produces tangible output, there should be a minimal input requirement. The second law of thermodynamics, concerning efficiency, states that a minimum quantity of matter is needed for its transformation. Each production process contains the transformation or movement of matter. Although the substitution of certain elements and chemicals is possible, some form of matter should be moved or transformed and therefore, energy is needed. All economic processes need energy; as a result energy is a crucial part of the factor of production(Stern 1997; Stern & Cleveland, 2004). According to the second law of thermodynamics, also called as entropy law, additional energy is needed to transform one type of matter into other matter. This implies limits to the substitution of energy by other inputs in the production process (Ockwell, 2008).
It is considered by some that like energy, information is also considered as a non-producible factor of production (Chen, 1994; Spreng, 1993; Ruth, 1995; Stern, 1994). According to these authors, energy is necessary in order to obtain knowledge. Even non-intelligent living organisms need information to use energy. Despite measuring capital and labor is easier compared to information, when compared with energy information and knowledge cannot be easily measured (Stern, 1999).
According to the biophysical model of economy, energy is the only primary factor of production, while capital and labor are embodied energy. The prices of commodities should be determined depending on the cost of the use of the embodied energy associated with the commodities (Hannon, 1973). If there is an increase in the cost of embodied energy, the prices of commodities will increase. According to this approach, the distribution of the surplus of production depends on capital, labor and the bargaining power of different social classes such as property owners (Kaufmann, 1987).
3.2 EMPIRICAL LITERATURE ON THE CAUSAL RELATIONSHIP BETWEEN ENERGY CONSUMPTION AND ECONOMIC GROWTH
Kraft and Kraft (1978) presented the first study of the causal relationship between energy consumption and economic growth for the period from 1947 to 1974 in the USA. They used Sims technique and showed that there is a unidirectional causality running from GDP to energy consumption. This causal relationship between energy consumption and economic growth is categorized under four hypotheses (Apergis & Payne, 2010b; Apergis & Payne, 2010c; Payne, 2010; Squalli, 2007). The first one is the growth hypothesis argues that energy consumption has a significant impact on economic growth. In such a situation, policies applied to reduce energy consumption are likely to have a negative effect on economic growth. The second hypothesis concerns conservation stating that there is a uni-directional causal relationship from economic growth to energy consumption. Under this hypothesis, conservation policies applied to decrease energy consumption are not expected to have a negative effect on economic growth. The feedback hypothesis emphasizes the bi-directional causal relationship between energy consumption and economic growth; that there is an interdependent relationship. In such a situation, conservation policies implemented to reduce energy consumption may affect economic growth. On the other hand, the fourth hypothesis focuses on neutrality which implies that there is a non-causal relationship between energy consumption and economic growth meaning that energy consumption is a small part of economic growth, and therefore cannot significantly affect it. Thus conservation policies aiming to reduce energy consumption will not impact on economic growth.
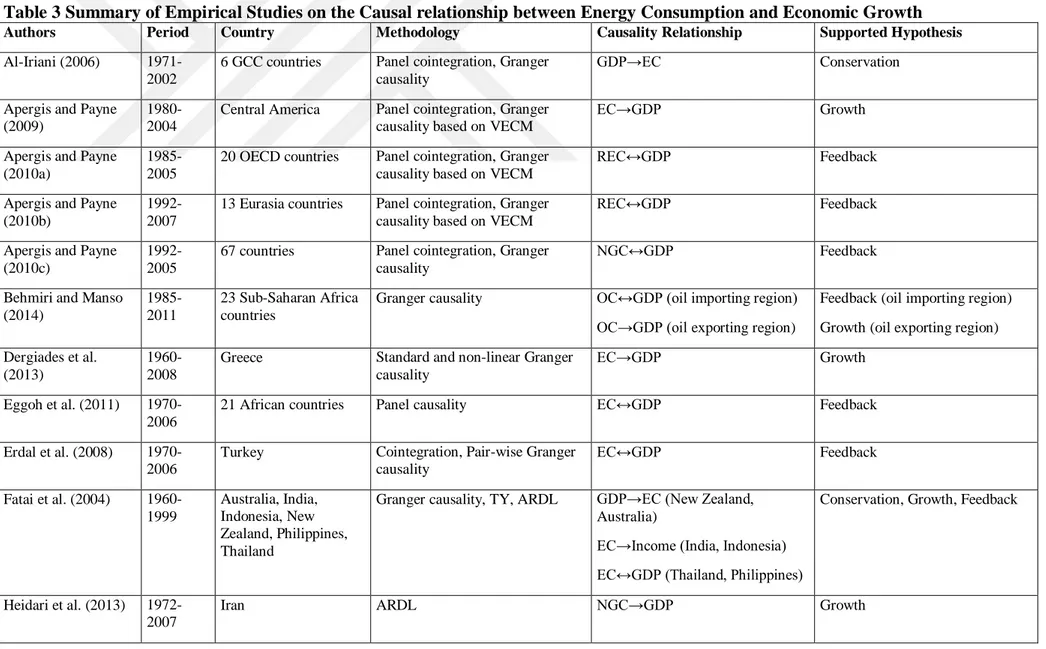
The literature concerning the relation between energy consumption and economic growth is extensive with various studies been undertaken in different countries, within a range of time periods, utilizing proxy variables using diverse econometric methodologies (Table 3).
Table 3 Summary of Empirical Studies on the Causal relationship between Energy Consumption and Economic Growth
Authors Period Country Methodology Causality Relationship Supported Hypothesis
Al-Iriani (2006) 1971-2002
6 GCC countries Panel cointegration, Granger causality
GDP→EC Conservation
Apergis and Payne (2009)
1980-2004
Central America Panel cointegration, Granger causality based on VECM
EC→GDP Growth
Apergis and Payne (2010a)
1985-2005
20 OECD countries Panel cointegration, Granger causality based on VECM
REC↔GDP Feedback
Apergis and Payne (2010b)
1992-2007
13 Eurasia countries Panel cointegration, Granger causality based on VECM
REC↔GDP Feedback
Apergis and Payne (2010c)
1992-2005
67 countries Panel cointegration, Granger causality
NGC↔GDP Feedback
Behmiri and Manso (2014)
1985-2011
23 Sub-Saharan Africa countries
Granger causality OC↔GDP (oil importing region) OC→GDP (oil exporting region)
Feedback (oil importing region) Growth (oil exporting region) Dergiades et al.
(2013)
1960-2008
Greece Standard and non-linear Granger causality
EC→GDP Growth
Eggoh et al. (2011) 1970-2006
21 African countries Panel causality EC↔GDP Feedback
Erdal et al. (2008) 1970-2006
Turkey Cointegration, Pair-wise Granger causality EC↔GDP Feedback Fatai et al. (2004) 1960-1999 Australia, India, Indonesia, New Zealand, Philippines, Thailand
Granger causality, TY, ARDL GDP→EC (New Zealand, Australia)
EC→Income (India, Indonesia) EC↔GDP (Thailand, Philippines)
Conservation, Growth, Feedback
Heidari et al. (2013) 1972-2007
26
Kraft and Kraft (1978)
1947-1974
USA Sims technique GDP→EC Conservation
Kula (2014) 1980-2008
19 OECD countries Panel cointegration, Granger causality GDP→RELC Conservation Lee (2005) 1975-2001 18 Developing countries
Panel cointegration, Granger causality
EC→ GDP Growth
Lee and Chang (2007)
1965-2002
22 developed, 18 developing countries
Panel VAR, GMM GDP→EC (developing countries) EC↔GDP (developed countries)
Conservation (developing countries)
Feedback (developed countries) Lee et al. (2008)
1960-2001
22 OECD countries Panel cointegration, Granger causality based on VECM
EC↔GDP Feedback
Llind and Wesseh (2014)
1971-2010
South Africa Cointegration, bootstrap causality EC →GDP Growth
Masih and Masih (1996)
1955-1991
6 Asian economies Cointegration, Sims technique and Granger causality based on VECM
EC →GDP (India) GDP →EC (Indonesia) EC↔GDP (Pakistan)
EC≠GDP (Malaysia, Philippines, Singapore)
Growth (India)
Conservation (Indonesia) Feedback (Pakistan)
Neutrality (Malaysia, Philippines, Singapore)
Mehrara (2007) 1971-2002
11 oil exporting countries
Panel cointegration, causality GDP→EC Conservation
Mulali (2011) 1980-2009
Middle East, North African countries
Cointegration, Granger causality based on VECM
OC↔GDP Feedback
Ozturk and Al-Mulali (2015)
1980-2012
GCC countries Panel Granger causality NGC↔GDP Feedback
Payne (2009) 1949-2006
Pirlogea and Cicea (2012)
1990-2010
Spain, Romania, EU-27 Cointegration, Granger causality EC→GDP (Spain; petroleum products and natural gas) NGC→GDP (Romania) EC≠GDP (EU-27)
Growth (Spain, Romania)
Neutrality (EU-27)
Soytas et al. (2001) 1960-1995
Turkey Panel cointegration, Granger causality
EC→GDP Growth
Squalli (2007) 1980-2003
11 OPEC countries TY GDP→ELC (Algeria, Iraq and
Libya)
ELC↔GDP (Iran, Qatar, Venezuela)
Conservation (Algeria, Iraq and Libya)
Feedback (Iran, Qatar, Venezuela)
Yang (2000) 1954-1997
Taiwan Cointegration, Granger causality EC↔GDP GDP→OC NGC→GDP
Feedback, Conservation, Growth
Yildirim et al. (2012) 1949-2010
USA TY, Bootstrap corrected causality REC≠GDP Neutrality
Yıldırım et al. (2014) 1971-2010
Bangladesh, Egypt, Indonesia, Iran, Korea, Mexico, Pakistan, Philippines, Turkey
Bootstrapped autoregressive metric causality approach
EC→GDP (Turkey)
EC≠GDP (Bangladesh, Egypt, Indonesia, Iran, Korea, Mexico, Pakistan, Philippines)
Growth (Turkey)
Neutrality (Bangladesh, Egypt, Indonesia, Iran, Korea, Mexico, Pakistan, Philippines)
Wandji (2013)
1971-2009 Cameroon
Cointegration and Granger causality
EC→GDP Growth
Notes: EC→GDP refers to the uni-directional causality running from energy consumption to economic growth. GDP→EC refers to the uni-directional
causality running from economic growth to energy consumption. EC↔GDP refers to the bidirectional causality between energy consumption and economic growth. EC≠GDP refers no causality between energy consumption and economic growth. EC=total energy consumption, ELC= electricity consumption, GDP=economic growth, OC=oil consumption, NGC=natural gas consumption, VAR=vector autoregressive model, ECM=error correction model, ARDL=autoregressive distributed lag, GMM= generalized method of moments, REC=renewable energy consumption, RELC=renewable electricity consumption, TY=Toda-Yamamoto and VECM= vector error correction model
Examples of the studies that support the growth hypothesis in which the causality runs from energy consumption to economic growth by using Johansen cointegration and Granger causality tests are as follows; Soytas, Sari, and Ozdemir (2001) under took research in Turkey covering the 1960-1995 period; Lee (2005) analyzed 18 developing countries from 1975 to 2001; Apergis and Payne (2009) investigated Central American countries over the period from 1980 to 2004; Dergiades, Martinopoulos, and Tsoulfidis (2013) examined the situation in Greece from 1960 to 2008; Wandji (2013) investigated the growth hypothesis in relation to Cameroon from 1971 to 2009; Lin and Wesseh (2014) analyzed South Africa countries from 1971 to 2010. Moreover; Heidari, Katircioglu, and Saeidpour (2013) examined the relationship between natural gas consumption and GDP in Iran using ARDL method covering the period from 1972 to 2007.
In terms of the studies supporting the conservation hypothesis in which the direction of causality runs from economic development to energy consumption the following examples of research were found in the literature. Kraft and Kraft (1978) used Sims technique and the USA data set covering the period from 1947 to 1974; Al-Iriani (2006) analyzed six GCC countries (Bahrain, Kuwait, Oman, Qatar, Saudi Arabia and UAE) using panel cointegration and Granger causality methods from 1971 to 2002; Mehrara (2007) examined 11 oil exporting countries (Iran, Kuwait, UAE, Saudi Arabia, Bahrain, Oman, Algeria, Nigeria, Mexico, Ecuador and Venezuela) using panel cointegration and causality methods for the period from 1971 to 2002 and Kula (2014) explored the relationship between renewable electricity consumption and GDP for OECD countries with the 1980-2008 period by using panel cointegration and Granger causality methods.
Feedback hypothesis in which there is a bi-directional causality between energy consumption and economic development is supported by many studies. Erdal, Erdal and Esengün (2008) analyzed Turkey from 1970 to 2006 using cointegration and Pair-wise Granger causality techniques; Lee, Chang, and Chen (2008) investigated 22 OECD countries for the 1960-2001 period using panel cointegration and Granger causality based on VECM; Apergis and Payne (2010a; 2010b) examined the causal relationships between renewable energy consumption and economic growth for 20 countries covering the 1985-2005 period, and for 13 Eurasia countries over the 1992-2007 period; and Apergis and Payne (2010c) analyzed the causal relationship between natural gas consumption and GDP in 67 countries within the period of 1992-2005 using panel cointegration and Granger
causality techniques; Eggoh, Bangaké, and Rault (2011) investigated 21 African counties from 1970 to 2006 dividing their sample into the net exporting and net importing countries. Moreover; Mulali (2011) examined the effect of oil consumption on economic growth for the Middle East and North African counties during the 1980-2009 period applying cointegration and Granger causality based on VECM; whereas Ozturk and Al-Mulali (2015) studied the relationship between natural gas consumption and the GDP of GCC countries for the period 1980-2012 using panel Granger methods.
There are also studies that support the neutrality hypothesis in which there is no causality between energy consumption and economic growth. Masih and Masih (1996) analyzed 6 Asian countries using Johansen cointegration, Sims technique and Granger causality based on VECM. The research covered the 1995-1991 periods in India, Pakistan, Malaysia and the Philippines and for Indonesia and Singapore, they used the time period of 1960-1990. According to the results of their study, neutrality hypothesis is supported by Malaysia, Singapore and the Philippines. For the USA, Payne (2009) investigated the periods from 1949 to 2006 using the Toda-Yamamoto Granger causality technique; whereas Yildirim, Saraç, and Aslan (2012) also examining the USA selected the 1949-2010 period and the bootstrap-corrected causality technique to their study. Using cointegration and Granger causality techniques; Pirlogea and Cicea (2012) investigated Spain, Romania and EU-27 countries over the period from 1990 to 2010. Their results showed that there is no causal relationship between energy consumption and economic development in EU-27 countries; whereas Yıldırım et al. (2014) investigate Next 11 countries using the time periods of 1971-2010 for Bangladesh, Egypt, Indonesia, Pakistan and Philippines, 1971-2007 for Iran, 1971-2011 for Korea and Mexico and 1960-2011 for Turkey. According to their results, the neutrality hypothesis is supported except in the case of Turkey.
The literature also contains studies that support different hypotheses for various countries. Yang (2000) investigated the causal relationship between economic growth and total energy consumption as well as coal, oil, natural gas and electricity by considering 1954-1997 period for Taiwan. Cointegration and Granger causality tests were applied in the study and identified a bi-directional causality between energy consumption and GDP, a uni-directional causality from GDP to oil consumption and from natural gas consumption to GDP. Fatai, Oxley and Scrimgeour (2004) examined the possible impacts of energy conservation policies on the economies of Australia, India, Indonesia, New Zealand, the
Philippines and Thailand. Covering the 1960-1999 period, Granger causality, TY and ARDL methods are applied to analyze the causal relationship between energy consumption and GDP. Findings from New Zealand show that there is a uni-directional causality from the real GDP to the industrial, commercial and total energy consumption. Similar findings have also been confirmed for Australia. In addition, there is a uni-directional causality from energy consumption to income for India and Indonesia while there is a bi-directional causality for Thailand and the Philippines. According to the authors, energy conservation policies may not significantly affect real GDP in industrialized countries such as New Zealand and Australia compared to developing Asian countries. Lee and Chang (2007) analyzed the causal relationship between energy consumption and GDP using panel VARs and GMM techniques. The researchers divide their sample into two groups of 22 developed and 18 developing countries using the time span 1965-2002 for the former countries and 1971-2002 for latter group. The results imply that there is a uni--directional causality from GDP to energy consumption for developing countries, while a bi-directional causality exists between the relevant variables for developed countries. Squalli (2007) examined the relationship between electricity consumption and economic growth for OPEC countries using the TY method. For the 1980-2003 period, there were different results for the countries; a uni-directional causality from GDP to electricity consumption for Algeria, Iraq and Libya; while there was a bi-directional causality for Iran, Qatar and Venezuela. The causal relationship between crude oil consumption and GDP for 23 Sub-Saharan Africa countries for the 1985-2011 period was analyzed by Behmiri and Manso (2014). Their findings in relation to the Granger causality tests showed that in the short-term, there is a bi-directional causality between crude oil consumption and GDP for the oil importing region, while there is a uni-directional causality from crude oil consumption to GDP for the oil exporting region. In the long-term there is a bi-directional causality between the relevant variables for both regions.
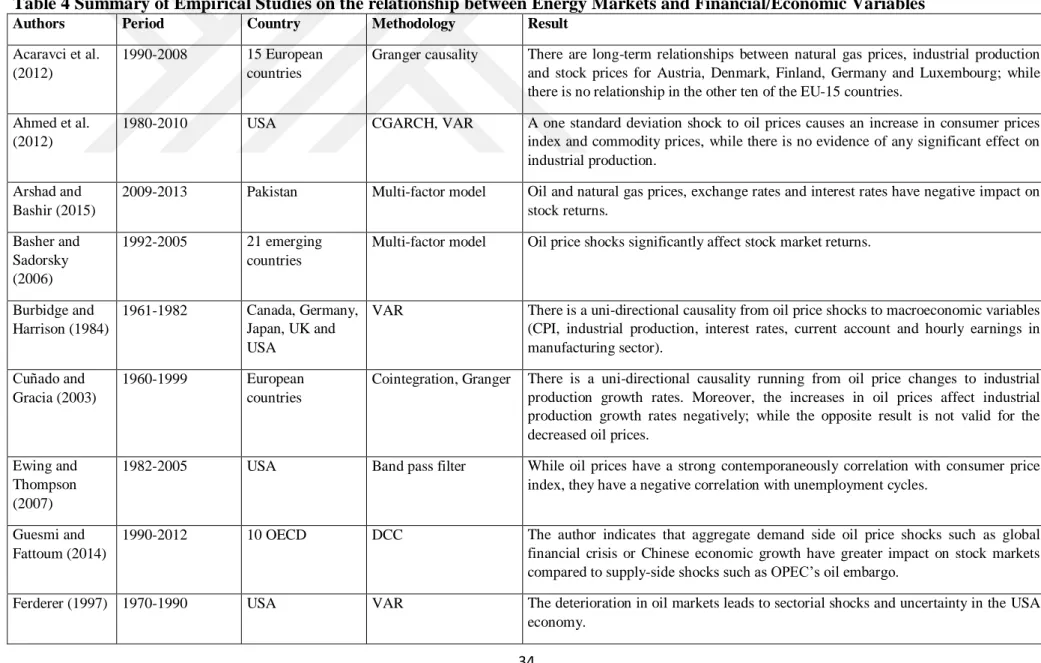
3.3 THEORETICAL APPROACHES TOWARDS ENERGY MARKETS AND THE FINANCIAL/ ECONOMIC VARIABLES
The sharp increases in oil prices have significant impact on both economic activities and macroeconomic policies. The rises in cost that occur in world oil markets create concerns about a possible slowdown that might happen in many developed countries. In this regard, the channels through which oil price shocks affect economic variables have been the subject of numerous studies.
Many economists have offered theoretical explanations for the inverse relationship between the changes in oil prices and the degree of economic activities. First, is the supply-side effect that states that rising oil prices reduce the input for production hence the potential output. Accordingly, while there is an increase in production costs, there is a slowdown in the growth of both productivity and output. The slowdown in productivity has a negative effect on real wages and employment. As high energy costs reduce the profitability of companies, the desire to purchase new capital goods will also decrease; however, if the energy price increases seem to be permanent, in order to balance the decline in capital spending firms might decide to invest more into the energy-efficient capital. As a result, in long term high energy costs may encourage firms to decrease their new capital investments or cause the existing capital stocks to become obsolescent economically and technically. For that reason, there might be a decline in the production capacity of industrialized countries. Additionally, if consumers expect a temporary rise in energy prices, their preferences will be to save less or borrow more which may result a decline in real balances and an increase in future price levels (Cologni & Manera, 2008; Kumar, 2005).
The second channel through which oil price shocks affect economic activities, also known as the demand-side effect, is the wealth transfer from oil importing countries to oil exporting countries since the decline in purchasing power of firms and households in oil importing countries is higher than the increase of oil exporting countries. Rising oil prices can be considered as a tax gain for the oil exporting countries from the oil importing countries. An increase in oil prices weakens the trade conditions of oil importing countries. In the long-term although some part of the decline in domestic demand is offset by the