ANKARA YILDIRIM BEYAZIT UNIVERSITY
THE INSTITUTE OF SOCIAL SCIENCES
THE DEPARTMENT OF ECONOMICS
AN EMPIRICAL ANALYSIS OF BUSINESS CYCLES IN TURKEY
PHD DISSERTATION
SADIK YILDIRIM
A THESIS IS SUBMITTED TO
THE INSTITUTE OF SOCIAL SCIENCES OF
ANKARA YILDIRIM BEYAZIT UNIVERSITY
BY
SADIK YILDIRIM
IN PARTIAL FULFILLMENT OF THE REQUIREMENTS FOR
THE DEGREE OF DOCTORATE IN
THE DEPARTMENT OF ECONOMICS
Approval of the Institute of Social Sciences
Manager of Institute Doç. Dr. Seyfullah YILDIRIM
I certify that this thesis satisfies all the requirements as a thesis for the degree of Doctor of Philosophy in the Department of Economics.
Head of Department Prof. Dr. Murat ASLAN
This is to certify that we have read this thesis and that in our opinion it is fully adequate, in scope and quality, as a thesis for the degree of Doctor of Philosophy in the Department of Economics.
Supervisor
Prof. Dr. Erdal Tanas KARAGÖL
Examining Committee Members
Prof. Dr. Erdal Tanas KARAGÖL (AYBÜ, Economics) _____________________
Prof. Dr. Muhsin KAR (AYBÜ, Economics) _____________________
Prof. Dr. Murat ATAN (AHBVÜ, Econometrics) _____________________
Prof. Dr. Metin Toprak (İ.Ü, Economics) _____________________
DECLARATION
I hereby declare that all information in this thesis has been obtained and presented in accordance with academic rules and ethical conduct. I also declare that, as required by these rules and conduct, I have fully cited and referenced all material and results that are not original to this work; otherwise I accept all legal responsibility.
Name, Last Name: Sadık YILDIRIM
ABSTRACT
AN EMPIRICAL ANALYSIS OF BUSINESS CYCLES IN TURKEY
YILDIRIM, SADIK
Ph.D., DEPARTMENT OF ECONOMICS
SUPERVISOR: PROF. DR. ERDAL TANAS KARAGÖL MAY 2019
Turkish economy had many ups and downs in its history. Fırst, Turkey had attempted to adopt a liberal economic model after the establishment of the Republic of Turkey, but Lausanne Treaty constrained the ability of the government to establish an independent economic strategy. While expecting the expiration of restrictions imposed by the Lausanne Treaty, then this time the world's economic crisis started. After the great depression, Turkey has started the planned industrialization economy to minimize the effects of the crisis. After that, the share of industry in national income increased while that of the agricultural sector decreased.
In 1950, Democrat Party (DP) came to power and attempted to follow a liberal economic model again. The government tried to transform the economy from etatism to market economy. The agricultural sector was supported and taxes on agriculture were abolished. On the other hand, the government gave importance to scale economies, efforts were made to facilitate the work of the private sector by taking steps in the fields of infrastructure investments, energy and transportation-communication.
During the DP period, Turkish economy experienced high growth level until 1953, but due to unhealthy economic structure; increased size of public enterprises, public deficits and inflation, growth started to slow down thereafter.
In 1961, planning became a constitutional rule and compulsory for the public sector. This, in somewhat, was the return to etatism, which was a development attempt in a closed economy with the state initiatives. Military government at this period started five-year development plans with import-substitution and high degree of protectionism policies. In 1973, with the oil shock, the current account deficit had been widened and external financing requirements had been increased. The main issue was that planners ignored scale economies and capacity utilization. They created artificial price structures and unrealistic exchange rates. In this period, Turkey had closed, but import oriented economy. Thus, each time, it encountered with balance of payment deficits, currency crises, and unemployment and inflation problems.
In order to overcome these problems, on January 24th, 1980 stabilization program was started with the support of the IMF. One of the important goals of this program was to transform the import-substitution economy to export-oriented economic structure. In this regard, one important step was the liberalization of financial market. Thus, the capital account was liberalized in 1989.
In later years, economic structure which is governed with political business cycles led increase in the budget deficit and money supply growth, and then high inflation rate. Due to short term opportunistic policies, currency crises and devaluations were never ended in the pre-2001 period.
The institutions established to regulate real and financial markets with stability programs have an important place in minimizing distortions. Some of these important institutions are the Capital Markets Board, the Banking Regulation and Supervision Board and the Independent Central Bank. In 2001, with the independence of the Central Bank, governments had been prevented from monetizing economy for populist purposes. Improvements in independent institutions through a strengthening of the legal and regulatory infrastructure have supported the proper functioning Turkish economy.
In this study, we employed the business cycle method to analyze aggregate economic activity and to examine whether any structural break take place in the post-2001
crisis, with looking at the volatility changes obtained from the business cycles model. To evaluate pre- and post-2001 crisis period, the data sets on real GDP and its components have been modified, rebased and extended to recent years. The results of business cycle facts show that the structural change took place in the post-2001 crisis period.
The econometric model has also been utilized for the indication of structural change. In this regard, Chow stability test have been used. Results of test show that the structural break took place in Turkish economy in the post-2001 period. These indicate that including EU accession, social, political, institutional and structural economic reforms had contributed to structural transformation of the economy in the post-2001 crisis period.
In addition, we investigated the business cycles facts of the Turkish economy using quarterly data from 1987:1 to 2016:2 with the methodology used by Kydland and Prescott (1990). We found that both the consumption and investment are procyclical and fluctuates more than output; exports and imports are procyclical; prices and inflation are countercyclical; and M1, M2 and M3 definitions of money give different results with different period of data. On the other hand, employment at the intensive and extensive definition, productivity, manufacturing indices, all are procyclical and consistent with the results of other studies in literature on developing economies.
ÖZET
TÜRKİYE’DE İŞ DÖNGÜLERİN AMPİRİK BİR ANALİZİ
YILDIRIM, SADIK
DOKTORA, İKTİSAT BÖLÜMÜ
TEZ DANIŞMANI: PROF. DR. ERDAL TANAS KARAGÖL MAYIS 2019
Türkiye’nin ekonomi tarihi yükseliş ve inişlerle doludur. Cumhuriyetin kuruluşuyla beraber Türkiye liberal ekonomi politikası benimsemiş, fakat Lozan Anlaşması ülkenin ekonomik alanda bağımsız kararlar almasını engellemiştir. Anlaşmaya bağımlı olarak gümrüklerle ilgili sınırlamaların 1929 bitmesiyle beraber, bu sefer de dünya ekonomik buhranı baş göstermiştir. Bundan sonra, Türkiye krizin etkilerini devletin öncülüğünde minimize etmek için planlı sanayileşme dönemini başlatmıştır. Bu vesileyle, sanayinin milli gelirdeki payı artarken tarım sektörünün payı düşüş göstermiştir.
1950’lere gelindiğinde Demokrat Parti (DP) liberal ekonomi politikalarını tekrar denemeye başladı. Hükümet ekonomiyi devlet öncülüğünden piyasa ekonomisine dönüştürmeye çalışmıştır. Tarım sektörüne destek verilmiş ve tarımın üzerindeki vergiler kaldırılmıştır. Bir taraftan da ölçek ekonomileriyle, alt yapı yatırımları, enerji ve ulaşım-haberleşme alanında adımlar atılarak özel sektörün işi kolaylaştırılmaya çalışılmıştır.
DP döneminde, 1953 yılına kadar başarılı bir şekilde büyüyen ekonomi daha sonra sağlıksız ekonomik yapıdan; kamu teşebbüslerindeki artış, kamu açıkları ve enflasyon artışından dolayı, büyüme yavaşlamaya başlamıştır.
1961 yılında planlama anayasal bir kural haline geldi ve kamu kesimi için zorunlu oldu. Bu, bir şekilde kapalı bir ekonomide devlet öncülüğünde kalkınmayı hedef alan devletçiliğe dönüştü. Askeri hükümet, bu dömemde ithal-ikameci ve yüksek derecede korumacı politikalara dayanan beş yıllık kalkınma planlarına başladı.. 1973 yılında petrol şoku ile cari açık genişlerken dış finansman gereksinimi artış gösterdi. Türkiye ekonomisinde planlamacılar tarafindan göz ardı edilen esas sorun kapalı bir ekonomide ölçek ekonomisi ve kapasite kullanım sorunu olmuştur. Gerçekçi olmayan döviz kurları ve suni fiyat yapıları oluşturulmuştur. Türkiye içe dönük ve fakat dışa bağımlı bir ekonomiye sahip olmuştur. Bu sebeple tarihinde, her seferinde ödeme dengesi açıkları, parasal krizler, işsizlik ve enflasyon sorunlarıyla karşılaşmıştır.
Bu sorunları ortadan kaldırmak için IMF’nin desteğiyle 24 Ocak 1980 istikrar programına başlandı. Bu programın en önemli amaçlarından biri, ekonomiyi ithal ikameci bir yapıdan ihracata dayalı bir yapıya kavuşturmaktı. Bu manada önemli adım, finansal piyasaların serbestleştirilmesiydi. Bu sebeple sermaye hesabı 1989 yılında serbestleştirildi.
Daha sonraki yıllarda, popülist politikalarla idare edilen ekonomik yapı bütçe açığı ve para arzının artışına ve dolayısıyla enflasyona sebep oldu. Kısa vadeli politik fırsatlara dayanan ekonomiden dolayı, döviz krizleri ve devalüasyonlar 2001 krizi öncesi dönemlerde Türkiye’de hiç bitmedi.
İstikrar programlarıyla beraber reel ve finansal piyasaları düzenlemek için ihdas edilen kurumlar ekonomideki aksaklıkları minimize etmede önemli yer tutmaktadır. Sermaye Piyasası Kurumu, Bankacılık Düzenleme ve Denetleme Kurumu, bağımsız Merkez Bankası bu önemli kurumlardan bazılarıdır. 2001’de Merkez Bankasının bağımsız olması, hükümetlerin popülist amaçlarla kaynaklarını kullanmasını engellemiştir. Yasal ve düzenleyici altyapıyla güçlendirilen bağımsız kurumlardaki gelişmeler Turkiye ekonomisinin kriz dönemi sonrası uygun bir şekilde çalışmasını sağlamıştır.
olmadığını, iş döngü modelindeki dalgalanma değişikliklerine bakarak öğrenmeye çalıştık. 2001 krizi öncesi ve sonrasını değerlendirmek için, reel GSYH ve bileşen verileri modifiye edildi, baz yılı değiştirildi ve son yılllara kadar uzatıldı. İş döngü model sonuçları, 2001 krizi sonrası Türkiye ekonomisinde yapısal değişimin olduğunu gösterdi.
Yapısal değişimin varlığı için ekonometrik modeller de çalıştırıldı. Bu manada Chow istikar testi kullanıldı. Test sonuçları, 2001 krizi sonrası dönemde yapısal kırılmanın Turkiye ekonomisinde varlığına işaret etti.
Bu da gösteriyorki kriz dönemi sonrası, Avrupa Birliğine katılım müzakereleri dâhil olmak üzere siyasal, sosyal, kurumsal ve yapısal ekonomik reformların ekonominin yapısal dönüşümüne katkı sağladığıdır.
İlaveten, Türkiye ekonomisi için iş döngü istatistiklerini 1987:1-2016:2 dönemde çeyrek verileri kullanarak, Kydland ve Prescott (1990) yılı araştırma metodu, çerçevesinde araştırdık. Tüketim ve yatırım harcamalarının GSYH ile beraber hareket ettiği ve reel GSYH’den daha fazla dalgalandığı, ihracat ve ithalat rakamlarının çıktıyla beraber hareket ettiği, fiyatların ve enflasyonun çıktıyla ters hareket ettiğini ve M1, M2, M3 parasal tanımların farklı dönem verileri için GSYH ile farklı sonuçlar verdiği bulgularını elde ettik. Diğer taraftan, istihdam verileri farklı tanımlamalarla, verimlilik ve imalat endeksleri, tümü ekonomik aktiviteyle beraber hareket etmekte ve gelişmekte olan ülkelerle ilgi literatürde yapılan çalışmalarla tutarlılık arz etmektedir.
ACKNOWLEDGEMENTS
First of all, I would like to express my special appreciation and thanks to my major advisor, Prof. Dr. Erdal Tanas Karagöl for his support and guidance throughout my research.
I would also like to thank my committee members Prof. Dr. Muhsin Kar, Prof. Dr. Murat Atan, Prof. Dr. Metin Toprak and Dr. Cem Korku for serving as my committee members even at hardship. I also want to thank all of you for your brilliant comments, criticism and suggestions.
My sincere thanks also go to Prof. Stephen M. Miller, Prof. Metin Cosgel, Prof. Susan Randolph, Prof. Dennis Heffley, Rosanne Fitzgerald and all other academic and administrative staff in the Department of Economics in University of Connecticut. Also, special thanks to Prof. Fatma Selampınar from University of Connecticut for her help in reviewing my thesis grammatically.
A special thanks to my family. Words cannot express how grateful I am to my wife Tuba, my daughters Rumeysa and Sumeyra, and my son Emre for all of the sacrifices that they have made on my behalf.
I would also like to thank my colleagues Dr. Aziz Turhan and Dr. Yakup Asarkaya for their encouragements and supports.
Finally, I would like to express my gratitude to all the academic and administrative staff in Ankara Yıldırım Beyazıt University.
TABLE OF CONTENTS DECLARATION………..………..…..iii ABSTRACT……….………..…...iv ÖZET………vii DEDICATION……….……..…x ACKNOWLEDGEMENTS… ……….…………...xi TABLE OF CONTENTS……….……….………..xii LIST OF TABLES………….………..……….…xv LIST OF FIGURES……….………xvi LIST OF ABBREVIATIONS………...xviii CHAPTER 1: INTRODUCTION 1.1 Introduction……….…….…1
1.2 Research Questions and Objective of the Study……….….…6
1.3 Extension………....……….……….…7
1.4 The Outline of the Study ………..………...8
CHAPTER 2: AN ASSESSMENT OF TURKISH ECONOMY(1923-2016) 2.1 Introduction……….……….9
2.2 The Economic Policies in Turkish Economy in the Period of 1923-2016 2.2.1 The Period of 1923-1950……….………..……….……12
2.2.2 The Period of 1950s ……….……..13
2.2.3 The Period of 1980-2000 and Export-Oriented Economy…………..18
2.2.4 The Period of 1990s ………...23
2.2.5 The Period of Post-2001 and Financial Crises…….………...25
2.2.5.1 Inflation Rate…….……….……....27
2.2.5.3 Economic Growth……….……….……..29
2.2.5.4 Employment……….….…31
2.2.5.5 The Banking Sector ……….……31
2.2.5.6 Capital Inflow and Current Account Deficit………... 32
2.3 Summary and Conclusion………... 35
CHAPTER 3: LITERATURE REVIEW 3.1 Introduction……….…….……38
3.2 Real Business Cycles ………..…….…………40
3.3 Business Cycle Accounting………..….……...45
3.4 Political Business Cycles……. ………..….….45
3.5 Business Cycles Literatures on Turkish Economy………...48
CHAPTER 4: METHODOLOGY AND DATA 4.1 Introduction ……….…….………..……….51
4.2 Data and Methodology……….…….………..…….51
4.2.1 Empirical Method of Business Cycles………...52
4.2.2 Econometric Models…….………..………...55
4.2.2.1 Granger Causality Test………..……55
4.2.2.2 Phillips-Perron (PP) Unit Root Tests………..………..56
4.2.2.3 Structural Break Models………....59
4.2.2.3.1 Chow Test………60
4.2.2.3.2 Dummy Variables………60
4.2.2.3.3 Intercept and Slope Dummies………..61
4.2.2.3.4 Recursive Least Square Tests ………...63
4.2.2.3.4.1 CUSUM (Cumulative Sum of the Recursive Residuals)..64
4.2.2.3.4.2 CUSUMSQ ………..64
CHAPTER 5: AN EMPIRICAL ANALYSIS OF BUSINESS CYCLES IN TURKEY
5.1 Introduction………..….67
5.2 Empirical Analysis………....68
5.2.1 Analysis of Business cycles………68
5.2.1.1 Summary of Business Cycle Facts ………..71
5.2.1.2 Business Cycle Facts of Real GDP and its Components………….74
5.2.1.3 Business Cycle Facts of Prices and Monetary Variables…………..80
5.2.1.4. Facts about Production and Labor Inputs………93
5.2.2 Econometric Analysis……….96
5.2.2.1 Facts about Prices……….96
5.2.2.1.1 Phillips-Perron Unit Root Test………...98
5.2.2.1.2 Granger Causality………..101
5.2.2.2 Structural Stability in Turkish Economy……….104
5.2.2.2.1 Chow Test for Consumption Function………..104
5.2.2.2.2 Chow Test for Real GDP Variable………106
5.2.2.2.3 Chow Test for Consumption Variable………...108
5.2.2.2.4 CUSUM and CUSUMSQ Tests………109
5.3 Summary and Conclusion………....114
CHAPTER 6. SUMMARY AND CONCLUSIONS 6.1 Introduction……….116
6.2 Summary and Conclusions of Chapters………...116
LİST OF TABLES
Table 5.1 Business Cycle Behavior of Real GDP and its Components (λ = 1600)..….76
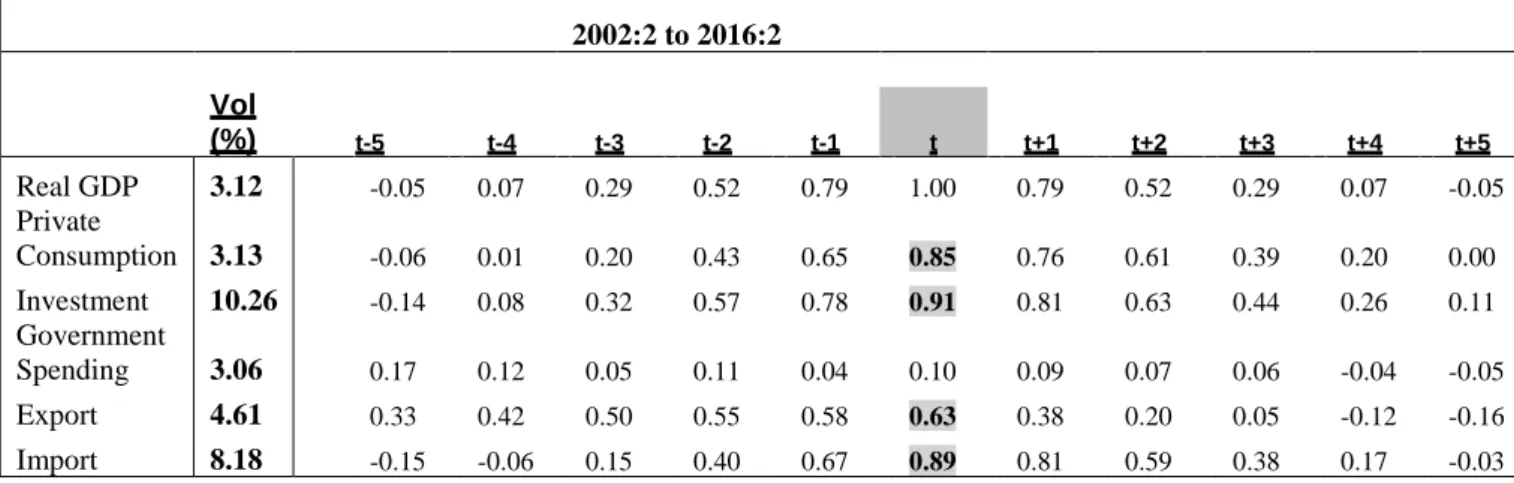
Period: 1987:1-2000:4 Table 5.2 Business Cycle Behavior of Real GDP and its Components (λ = 600) ..…..79
Period: 2002:2-2016:2 Table 5.3 Business Cycle Behavior of Real GDP and its Components (λ = 1600)…...80
Period: 1987:1-2016:2 Table 5.4 Business Cycle Behavior of Real GDP and Nominal Variables (λ = 1600)….86 Period: 1987:1-2000:4 Table 5.5 Business Cycle Behavior of Real GDP and Nominal Variables (λ = 1600) ....86
Period: 2002:2-2011:2 Table 5.6 Business Cycle Behavior of Real GDP and Nominal Variables (λ = 1600) ....87
Period: 1987:1-2011:2 Table 5.7 Business Cycle Behavior of Real GDP with Its Components (λ = 1600) …...92
Period: 1998:1-2011:2 Table 5.8 Business Cycle Behavior of Real GDP and Nominal Variables (λ = 1600) ...93
Period: 1998:1-2011:2 Table 5.9 Business Cycle Behavior of Real GDP and Production Variables (λ = 1600).94 Period: 1998:1-2011:2 Table 5.10 Lag Selection of Differenced Real GDP and CPI………100
Table 5.11 Philips-Perron (PP) Unit Root Test for log CPI………...100
Table 5.12 Philips-Perron (PP) Unit Root Test for log Real GDP……….…101
Table 5.13 Granger Causality Test between Real GDP and CPI ………..102
Table 5.14 Granger Causality Test between Real GDP and CPI………...102
Table 5.15 Lag Order of log Consumption and log Real GDP………..105
Table 5.16 Consumption Function ………105
Table 5.17: Lag Order of Real GDP………...………107
Table 5.18 Structural Stability in Real GDP ……….107
Table 5.19 Lag Order of Consumption………..109
Table 5.20 Structural Stability in Consumption Variable………..109
Table 5.21 Cumulated Sum of Scale Residuals………...111
LIST OF FIGURES
Figure 2.1 Exports of Goods and Services (% of GDP), 1960-1980 Period…….……..16
Figure 2.2 GDP Growth (Annual %), 1960-1980 Period ……….…..17
Figure 2.3 Inflation Rates (CPI), 1960-1980 Period………....18
Figure 2.4 Exports of goods and services (% of GDP), 1980-2000 Period….…………20
Figure 2.5 GDP Growth (Annual %), 1980-2000 Period……….……21
Figure 2.6 Inflation Rates (CPI), 1980-2000 Period………....22
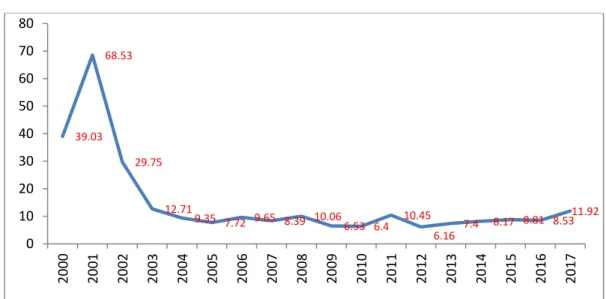
Figure 2.7 Inflation Rates (CPI), Post-2001 Period……….…28
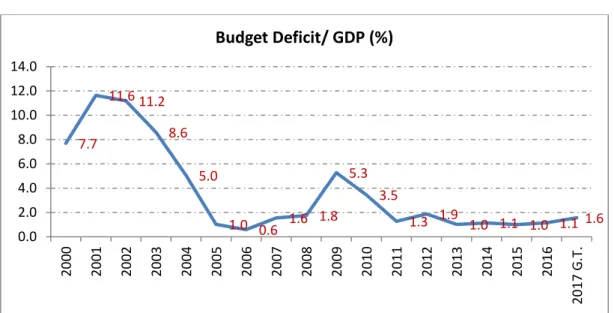
Figure 2.8 Budget Deficit / GDP………..29
Figure 2.9 GDP Growth (Annual %)………....30
Figure 2.10 GDP per capita (Constant 2010 US$)...30
Figure 2.11 Domestic Credits to Private Sector (% of GDP)………..….32
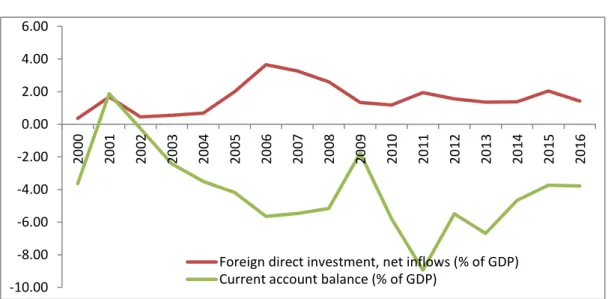
Figure 2.12 Current Account Deficits and Capital Inflow………..….….33
Figure 2.13 Export of Goods and Services (% of GDP)…..……….……...34
Figure 4.1 Sample Regression Lines for Structural Change ……….………...61
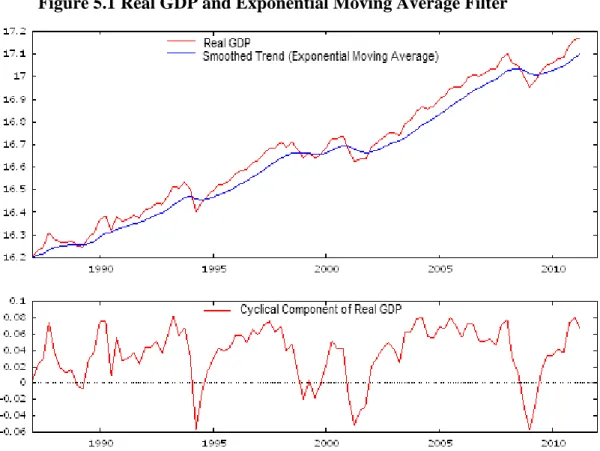
Figure 5.1 Real GDP and Exponential Moving Average Filter………69
Figure 5.2 Real GDP and HP-Filtered Trend………70
Figure 5.3 Percentage Deviations of Real GDP and Consumption Expenditures……….70
Figure 5.4 Real GDP and Consumption Growth………...71
Figure 5.5 De-trended Real GDP and Consumption……….…79
Figure 5.6 De-trended Real GDP and M1 and M2………82
Figure 5.7 De-trended Real GDP and M3………..82
Figure 5.8 De-trended Real Exchange Rates and Real GDP……….88
Figure 5.9 Trend of Real Exchange Rate for Post-Crisis Period………...88
Figure 5.10 Percentage Deviation of Real GDP, M1 andM2 from HP-Filtered………...90
Figure 5.11 Percentage Deviations of Real GDP and CPI from HP-Filtered Trend…….91
Figure 5.12 Real GDP and Productivity in Manufacturing (Working Hrs)………..95
Figure 5.13 Real GDP and Industrial Production……….….95
Figure 5.14 HP Filtered Real GDP and Nominal Exchange Rate……….….97
Figure 5.15 Gross Domestic Products (GDP) in Log Level……….….98
Figure 5.16 Log Consumer Price Index……….…98
Figure 5.17 Gross Domestic Products (GDP) in Log Difference (Growth)………….….99
Figure 5.18 Consumer Price Index in log Difference (Inflation)……….….99
Figure 5.20 Impulse Response Function of ∆lnGDP………...103 Figure 5.21 CUSUM Test………..…..110 Figure 5.22 CUSUM of Squares Test………..…111
LIST OF ABBREVIATIONS
AIC : Akaike criterion
ARDL : Auto Regressive Distributed Lag
ARIMA : Autoregressive integrated moving average
BIC : Schwarz Bayesian criterion
CIBCR : The Center for International Business Cycle Research
CMB : The Capital Markets Board
CPI : Consumer Price Index
DP : Democrat Party
EU : European Union
GSYH : Gayri Safi Yurtiçi Hasıla
GDP : Gross Domestic Products
GNP : Gross National Products
HQC : Hannan-Quinn criterion.
IMF : International Monetary Fund
NBER : The National Bureau of Economic Research
OECD : Organization for Economic Cooperation and Development
PP Test : Philips Perron Test
SEEs : State Economic Enterprises
SVAR : Structural Vector Autoregressive
TFP : Total Factor Productivity
US : United States
CHAPTER 1. INTRODUCTION 1.1 Introduction
Business cycle analysis and measurement have been one of the important areas in economics since 1990s. An important question regarding business cycles is the causes of fluctuation of economic activity and the role of government policy in it. In the history of business cycles, Wicksell (1901) stressed that the difference between natural rate of interest and bank rate of interest creates cycles in economy. Clark (1917) indicated that business cycles are the result of innovations, which generate a temporary demand for investment goods. Schumpeter (1939) noted that nothing is constant over the business cycle; the economy grows and changes with new products, new firms, and new consumers.
Lucas (1977) defines business cycle as deviation of gross national product from its trend. On the other hand, Fiorito and Kollintzas (1994) noted that business cycles are products of technology shocks and in a competitive environment, propagation mechanism is created by response of optimizing behavior of economic agents. Serletis and Krause (1996) indicate business cycle as deviation of the actual values of the variable from the smoothed trend.
Theory of modern business cycles in aggregate economic activity received more attention especially in 1980s and 1990s. The most prominent studies in these times are Kydland and Prescott (1982), King and Plosser (1984), Prescott (1986), Kydland and Prescott (1990), Kydland and Zarazaga (1997), King and Rebelo (1993). The research on economic fluctuations took importance with work of Kydland and Prescott (1982), and Long and Plessor (1983). The models that they worked on are attributed the cyclical behavior of real economic activity to serially correlated technology shocks.
The foundation of business cycles analysis is laid down by Mitchell (1913, 1927), Burns and Mitchell (1946). Their work published in 1946 formed the basis of methods of business cycles used at NBER (the National Bureau of Economic
Research) for business cycle chronology of the US. Measurement of economic activities is the core of business cycles analysis. They described business cycles as consisting of expansions, recessions, contractions and revivals which merge into the expansion phase of the next cycle; this sequence of changes is recurrent but not periodic; in duration business cycles vary from more than one year to twelve years. Later their methods of business cycles extended by Moore, Zarnowitz at the Center for International Business Cycle Research (Boehm, 2001).
The business cycles studies have been done under different approaches. They are named as real business cycles, business cycle accounting and political business cycles.
Real business cycle model developed by Kydland and Prescott (1982) is an analytical framework which modeled the economy quantitatively as a dynamic general equilibrium for the study of business cycles. It is based on the notion that fluctuations in economic variables are driven by unique, exogenous random shocks. They estimated several key macroeconomic variables using business cycle model. The result of study show that real business cycle theory cannot account for about 30 percent of postwar business cycle fluctuations.
On the other hand, business cycle accounting method developed by Chari, Kehoe and Mcgratten (2006) explains the sources of economic fluctuations by using a version of neoclassical growth model with the contributions of each friction separately and in combinations. In this procedure, the shocks considered are productivity shocks, government spending shock, labor wedge and capital wedge. Feeding each shock one at a time and in combinations assesses how much of the observed movements of output, labor, and investment attributed to each of them, separately and in combinations. By construction, all four wedges (shocks) accounts for all observed movements.
Considering political business cycles, in literature generally there are two types of political business cycle models: Opportunistic and partisan (ideological) business cycles. Opportunistic political business cycles depend on the notion of expansions in economic activities induced by an opportunistic incumbent before an election to
increase his probability of re-election. These models began to appear in the mid-1970s, the most influential of this type was that of Nordhaus (1975). The structure of the economy is represented by Phillips curve, giving a trade-off between unemployment and unexpected inflation. Voters have preferences for both low unemployment and low inflation, but in evaluating incumbents based on macroeconomic performance, they have short memories and no perfect foresight. According to Nordhaus, voters do not take averages of economic variables over the last electoral period, but they have decaying memory of past events. This creates an opportunity for politicians to use fiscal and monetary policies. That is why incumbent tries to stimulate the economy before the election in order to reduce unemployment, with the inflationary cost of such a policy coming only after.
On the other hand, partisan political business cycles based on notion of creating fluctuations in macroeconomic variables over or between electoral cycles resulting from leaders’ different ideology and economic goals. Hibbs (1977) examined postwar patterns in macroeconomic policies and outcome for left-and right-wing governments. His study covers 12 West European and North American nations. Hibbs stated that business cycles occur from different preferences over inflation and unemployment across parties. In his theory, each party can be identified by their unique ideologies. Left wing parties choose high inflation and low unemployment. Right wing parties, on the other hand, prefer low inflation and high unemployment. Voters make their decisions based on party’s ideologies they agree with the most. Politicians stick to the ideologies that are represented by the parties they are associated with.
Alesina (1987) considered the interaction of two parties with different objectives concerning inflation and unemployment and rational and forward-looking wage-setters. He introduced rational expectations in Hibb’s political business cycle model. Fluctuations in inflation and unemployment are driven by partisan differences combined with the uncertainty about election outcomes. Since expansionary monetary policy by a (left-wing) policymaker is not fully anticipated before an election and therefore will lead to a fall in unemployment after the election. A key difference from the Hibbs model is that any effect on unemployment will no longer
be present after inflation expectations are adjusted.
In this study, we focused only on real and nominal business cycle facts. Thus, business cycle accounting and political business cycle models are beyond the scope of our work.
In 1960s, the Keynesian model was the important paradigm and it has all necessary instructions for macroeconomic policies to control aggregate demand. Keynes considered the fluctuations arise in economy as a result of insufficient and excessive demand. According to Keynes, insufficient demand leads to unemployment and excessive demand leads to inflation. The return of business cycles model came after 1970s high rates of inflation. Friedman (1968) stated that long-run Phillips curve is vertical and shows no tradeoff between unemployment and inflation. Lucas (1976) indicated that Keynesian model has no macroeconomic foundations; individuals are rational and maximize their utility according to real demand, but not nominal.
For long time, till 1970s, it was believed that there was a stable negative relationship between unemployment and inflation. Belief was that an increase in demand for goods would drive up prices and encourage firms to expand and hire additional labor. Then this would lead additional demand throughout the economy. In 1970s, stagflation in the U.S. broke the belief of tradeoff between inflation and unemployment because there were unemployment, recession and inflation at the same time.
In analyzing business cycles, two approaches have been used for economic indicators. One is the classical cycles and the other is growth cycles. The classical cycles are recurring expansions and contractions in actual level of economic activity. The growth cycles, on the other hand are fluctuations in growth rate of aggregate economic activity relative to the long-run potential output growth rate (Boehm and Moore, 1984). In recent studies, business cycle has been commonly viewed as deviation of real aggregate output from its trend, and statistical properties of co-movement of deviations of certain macroeconomic series with those of deviation of real aggregate output.
After introduction of business cycles, it is important to specify how to measure economic activity. Therefore, economic indicator analysis would be necessary for measurement purposes. The construction and use of composite indices, which are combination of several time series, would be expected to give information about the state of economy.
Composite indices can be classified as composite coincident index, composite leading index and composite lagging index. Composite coincident index contains information about current state of economy. Key examples of such series are employment, unemployment, industrial production, real retail sales, real household income and real GDP. On the other hand, the composite leading index contains information about anticipating movements in the coincident index. Key examples to these series are hours worked, changes in producer prices, stock prices, building permits. Finally, composite lagging index follows coincident index. It contains series such as long-term unemployment, real capital expenditure and interest rates, level of inventories, labor costs per unit of output. Thus, the cyclical fluctuations are seen first in leading index, then in coincident index and finally it is confirmed by lagging index (Boehm and Summers, 2003).
In the past years, the continuance of business cycles has been prompted by the long classical expansions being experienced in Turkey. After 2001 crisis, the classical expansion in Turkey has completed its expansion in 2008. With about one and half year recession, the business cycle again experienced expansion until the second half of 2018. This is seen from the persistence of real GDP, which is 0.72 for 1987:1 to 2016:2 periods. This result indicates that if real GDP continues its trend, then it will stay there for a while. Expansions are longer than recessions in history of business cycles.
In literature, real GDP is the most appropriate data to provide a proxy for the business cycle. But it reveals on quarterly bases and most of the important data are monthly. Since no such monthly real GDP data available, then it diminishes the power of model to be used for forecasting purposes. Thus, in the absence of ideal measure of monthly real GDP, composite economic indices may be used as a proxy for aggregate economic activity.
In the last part of our work, we tried to find whether any structural break before and after 2001 economic crises exists in Turkey. Structural break occurs when a sudden change in time series or a relation between two times series are happen. In economics, in general, a structural break might occur when there is a war, or a major change in government policy or regime change. Structural break is an important issue in econometrics because of the break in data; one single regression model could lead forecasting errors and unreliability of the model in general.
Considering the Turkish economy, during the post crises period many changes took place. The most important one is the independence of the Central Bank with the establishment of other instructions. Reforms and accession talk with EU changed the negative image of Turkish economy and led high capital inflow, growth and disinflation.
1.2 Research Questions and Objective of the Study
The main research question is about the instability of Turkish economy during pre-2001 crisis period. In this period, Turkish economy is occupied with many ups and downs since 1950s, such as high inflation, high exchange rate volatilities, public debt, fiscal deficits and political uncertainties.
The objective of our empirical business cycles analysis for Turkey is to investigate business cycles facts of Turkish economy for pre-and post-crisis period and evaluate post-2001 crisis economic reforms. Thus, the study will investigate business cycles facts of Turkish economy, by extending and calculating the data set from 1987 to 2016 and evaluate pre- and post-2001 crisis economic reforms in aiding policy-making decisions.
Undertaken structural economic reforms in post-2001 crisis period and accession to European Union (EU) in this period for the stability of Turkish economy will be considered.
Compared to other studies in the literature, this study use owner calculated longer data set with business cycles and econometric model on Turkey with different base year consideration.
In order to analyse and explain the business cycle characteristics of the HP-filtered variables for Turkey, we will estimate their volatility and cross-correlations with real economic activity. In designing economic policies to reduce uncertainty and create steady economic growth, it is necessary to examine the properties of business cycles. As the economy developed in Turkey, increasing political competition made government bypass stabilization program and follow populist economic policies. This by and large was a period of increased discretion at the expense of rules. In 1994, instability in economy once more showed itself as result of fiscal deficit, inflation, deterioration in current account and downgrading of credit rating. On April 5, 1994, the government had to launch an IMF backed economic stabilization program to overcome the problems.
A similar stabilization program was also followed in 1999 as well. But economic problems were newer lasted until 2002. In post-crisis period, government put in effect many structural reforms to stabilize economy. Study of business cycles facts and structural break is expected to give information regarding these issues.
1.3 Extension
Future research could concentrate on lagging, coincident and leading indices for early warning system in Turkish economy. This could be done with constructing composite indices with more frequencies as proxy for economic activity.
1.4 The Outline of the Study The outline is as follows:
Chapter 1: The definition and use of business cycles is given in historic perspective. The type and method used for business cycles is explained. Chapter 2: This chapter presents the assessment of Turkish economy. It assesses the
economy from foundation of Republic of Turkey with giving more weight to recent years.
Chapter 3: Business cycles, real business cycles, political business cycles and business cycle accounting literature are reviewed in this chapter.
Chapter 4: The data and methodologies that used in business cycles and econometric modeling are given in this chapter.
Chapter 5: Business cycles facts, prices and real GDP relationship, structural change in post-2001 crisis is presented.
CHAPTER 2. AN ASSESSMENT OF TURKISH ECONOMY (1923-2016)
2.1. Introduction
Since the foundation of the Republic of Turkey, the promotion and development of the industry has taken place in all development plans. Industrialization strategy was all the times in forefront.
During 1923-29 periods Turkey followed liberal economy experience, but Lausanne Treaty constrained the government ability to establish an independent economic strategy. Therefore, government was able to play a minor role for political economy. In 1930s with the expiration of restrictions imposed by Lausanne Treaty and The Great Depression in 1929, government left liberal economic approach and switched to statism (etatism).
In this period, Turkey planned industrialization and the strengthening of the SEEs in the industrial sector. Following the industrialization strategy, while the share of the industry has been risen in national income, that of agriculture has been declined steadily (Barutcugil, 1989).
In 1950s, Democrat Party (DP) transformed statist economy into a market economy. Government gave support to agricultural sector. Taxes on agriculture were removed. Infrastructural developments, especially development of transportation, energy and communication providing the scale economies had increased. At the same time private sector was supported, but the lack of capital market, shortage of entrepreneurs and the political advantages forced the DP to carry on using SEEs as means of investment and economic development (Akalın, 1995).
An important side of this period was liberal ideas such as free enterprise, market economy, and private property. Import-substitution and protectionism were the policies towards the industrialization. Increase in government spending could not be
satisfied with regular state revenues but met with monetization. Hence it created inflation tax, which eventually ruined market and price system (Akalın, 1995).
In 1960s, Turkey followed import-substitution economic model with five-year developed plans. In this period initially Turkey caught substantial economic growth, but in later years existence of foreign exchange bottleneck led to decline in growth rate.
In 1980s, Turkish economy has become much more open and market oriented. Starting from stabilization program on January 24, 1980, economy was liberalized from an inward-oriented economy to export-led market economy. The market mechanism has played a more prominent role in the allocation of resources. With stabilization program fixed exchange rate was replaced with crawling peg exchange rate, import regime was liberalized and price controls were removed (Bayar, 1996). As the economy developed, increasing political competition made government bypass stabilization program and follow fiscally damaging populist economic policies. This by and large was a period of increased discretion at the expense of rules. In 1994, instability in economy once more showed itself as result of fiscal deficit, inflation, deterioration in current account and downgrading of credit rating. On April 5, 1994, government had to launch an IMF backed new economic stabilization program to tackle the problems (Durgut, 2002).
As the economy flourished and stability improved, towards the end of the 1990s, various off-budget expenditures took place. State owned banks carried much of the burden by supporting agriculture and small enterprises. By the end of year 2000, excessive risk in the banking system, which is driven by high public deficits and hidden public debt in state bank, was a risk for new crisis. In addition, resulting from delay of structural reforms, aim of benefitting from short term policies and the lack of fiscal discipline created unsustainable economic situation (Ozatay and Sak, 2003). In December 1999, the government launched another stabilization program in order to bring inflation and public debt accumulation down. The program appeared to be successful in subsequent nine months, but at the end of year 2000, it started running
into problems. Massive attack took place on the currency and capital outflowed. Government abandoned crawling peg exchange rate and replaced with free floating regime that supported by IMF (Akyuz and Boratav, 2003). The situation again paved the way for another economic crisis. The worsening economic situation eventually resulted in another major economic crisis in 2001.
This showed that sole economic measures are not enough to solve the problem. Institutional measures that contain the discretionary power of politicians and protect the system from short term populist policies are needed. In this regards, economic transformation has been accompanied by many new institutions.
In the decade after the crisis of 2001, important institutional changes took place, decision-making power has been given to independent agencies, and the establishment of rules that constrain the discretion of the executive was enacted. These agencies played important roles in shaping the economic situation. Independent Central Bank, Banking regulation and Supervision Institution are some of them. In considering monetary policy, the important step was the independence of central bank. The Central Bank determines the rules in which governments can rely on usual revenues, not on monetization of resources as contrast to previous periods. With the Emergency Action Plan in 2002, tax and government spending reforms were made to control fiscal deficit and reduce the share of budget deficit in GDP. Privatization was accelerated and export encouraged. Despite all the political impediments, great improvements were made in macro economy; inflation has declined, growth in GDP and trade have been achieved.
After the 2001 crises, the focus of stabilization program was mainly the exchange rate, fiscal deficit and the Central Bank independence. Sound public finance policy was necessary condition to eliminate the source of inflationary pressures. Wider ranging of structural reforms helps to liberalize and modernize the economy. In 2001-2005, monetary policy was reformed to inflation target approach and implicit inflation target was carried out. Formal inflation targeting approach was implemented in 2006. Transparency and accountability of government were
improved; thereby consumer confidence was restored mostly.
Thus, it could be said that the structural reforms and other macro prudential policies help Turkish economy to bypass the global financial crisis in 2008-2009 with less damage to economy. The success of inflation stabilization was also depended on government implementation of sound policies and independence of the central bank in the face of many adversities. Despite the all aforementioned, unemployment, external debt and current account deficit are important issues for future economic stabilization programs.
2.2 The Economic Policies in Turkish Economy in the Period of 1923-2016 2.2.1 The Period of 1923-1950
After the establishment of Republic of Turkey, The Republican People’s Party ruled country for almost thirty years. During the first years of republic, government was mostly preoccupied by political and cultural reforms to create a western style country (Bayar, 1996).
The externally imposed tax and tariffs such as Lausanne Treaty constrained the government ability to establish an economic strategy. Thus, government played a minor role in political economy. Turkey held responsible for Ottoman debt and tariff schedule until 1929. The ability of adopting economic and trade policies in needs of the country was almost impossible.
The initial strategy of government was to follow liberal economic strategy in 1920. The aim was to rely on the private sector and avoided taxing peasantry to finance industrial growth. But private sector was financially weak and not able to undertake big industrial project. Thus, initially government spent much of its effort on political and social policies and then with some constraint focused on the economy.
In 1929, The Great Depression took place in worldwide. In Turkey, the prices of agricultural products declined sharply. It was the main source of foreign exchange. There should have been a way to escape from the crisis. In that period, Union of
With the expiration of restrictions imposed by Lausanne Treaty and The Great Depression in 1929, government left liberal economic approach and switched to etatism.
With the removal of external restrictions, Turkey began to correct disappointing economic performance of the 1920s and offset the adverse effects of economic depression. Hence in the 1930s, Turkey placed a heavy emphasis on import-substituting industrialization and government-led industrial drive to create structural change and generate economic growth (Ismihan, Metin and Ozcan, 2006).
This statist approach started with five-year plan in 1933. The first five-year plan provided for the establishment of state-owned enterprises (SEEs). SEEs were active in iron, steel, textiles, chemicals, papers, ceramics and glass products. Industrialization via import-substitution was for the basic needs of nation. Comparative advantages of the economy were not strategy. To finance public enterprises, two banks, Sumerbank and Etibank, were established (Barutcugil, 1989). The former was responsible for industrialization and the latter for mining.
The second five-year plan was adopted in 1938. Many new enterprises in industrialization were planned. A major effort was power generation, engineering, chemicals and marine transport. But the Second World War interrupted the second five-year plan.
The incomplete aspect of etatism was the sole concentration on the creation of industrial base. Agricultural sector was totally ignored. In later years, the ruling party paid the price for neglecting this sector, where 80 percent of population was involved in agricultural sector.
2.2.2 The period of 1950s
The initial years of Democrat Party were characterized with high growth. DP government emphasized the development of agriculture. Taxes on agriculture were removed. Public investments were expanded. Infrastructural developments, especially development of transportation, energy and communication providing the scale economies had increased the demand for industrial goods and investment. This
resulted in the establishment of Turkish Industrial and Development Bank in 1950. The task of bank was to help private industry and encourage industrial cooperation of domestic and foreign industries and distribute loans (Kepenek and Yenturk, 1994). GDP growth exceeded 10 percent per annum from 1950 to 1953.
From the end of the Second World War to 1953, Turkey followed liberal foreign trade and industrialization policy. With the depletion of exchange reserves in 1953, the government started to implement import ban, quota and high customs tariffs on foreign trade. So, the import-substitution and protectionism were the policies towards the industrialization in this period.
In this period, the share of public sector in manufacturing decreased, but share of private sector increased. At the same time, the number of state owned enterprises rose between large industries. Profitable areas had been left to private sector and manufacturing sector had been relatively privatized (Barutcugil, 1989).
Because of absence of external competition, inefficiencies were the case for public and private sector firms. With the advantage of fixed exchange rate, domestic market became more attractive than foreign markets. Productivity, quality and standards of production were mostly ignored. Instead of exporting and producing, selling in domestic market were much profitable (Sonmez, 1986).
In 1950s, government supported private sector, but public sector undertook the important projects. Especially public sector tried to satisfy important projects which were not met by private sector. But, the problem for the state was the use of inefficient SEEs. They led to fiscal deficits which were covered in part by the Central Bank funding. Thus, after 1953 inflation accelerated because of public deficits which were mainly financed by the Central Bank resources (Barutcugil, 1989).
Import substitution strategy of previous periods was left in 1950 and liberaleconomic policies were followed. The implementation of this strategy continued until 1953. Due to an unhealthy economic structure; the industrialization and the fixed exchange rate policy, the demand for foreign currency increased and led to foreign currency bottleneck. The fixed exchange rate policy made domestic market more profitable
than the foreign market. Foreign exchange demand was fueled by attractive fixed exchange rate. These made importing of good difficult and led to low capacity of production and current account deficit (Barutcugil, 1989).
By 1958, the state was not able to borrow funds from abroad to finance imports and debt services. Thus, economy experienced the crisis. It started to adopt stabilization program. Stabilization program started with inefficient and low-priced SEEs, exchange rate and fiscal deficits. SEEs prices were increased, devaluation took place, import regime was liberalized relatively, government expenditures were restrained, and the Central Bank credit was ceiled (Barutcugil, 1989).
In the First Five-Year Development Plan the necessity of the import substitution (inward-oriented) strategy was emphasized. The aim was to reduce import dependency and do industrialization with import substitution. Initially the strategy predominantly was for durable consumer goods, investment and intermediate goods industries. The protective measures, incentives and subsidies were intensively used as instruments for the import substitution in the four plan periods. While the share of the industry in total employment was 7.53% in 1960, as a result of planned strategy, it rose to 11.10 in 1975 and the share of agriculture was decreased from 74.95% in 1960 to 62.34% in 1975 (Barutcugil, 1989).
Import substitution policy helped to raise the share of the industry in total exports from 13.1% in 1968 to 38.4% in 1977. On the other hand, while the ratio of investment goods was declined in import components, the ratio of intermediate goods increased relatively (Barutcugil, 1989).
The planning became a constitutional rule in 1961 and mandatory for the public sector which produced half of the industrial output. Planning strategy was a kind of return to etatism, i.e a development attempt in a closed economy with state initiative. It restored the fundamental concept of the 1930s and followed inward oriented (import substitution) policies, the high degree of protectionism. In addition, due to the absence of scales, artificial price structures, unrealistic exchange rate and low productivity, Turkey was not able to compete with the rest of the world (Figure 2.1). Thus, in foreign trade during 1960 to 1980, the export of goods and services only
increased to about 7 % of GDP in 1973, which was initially about 2 % of GDP. In this period, as usual, the lack of comparative advantages of Turkish economy was again an important issue for exports.
After the devaluation of Turkish lira by about 66% in 1970, export and emigrant worker’s remittances increased. Current account rose from deficit to surplus in 1971 and 1972. Industry grew 14%, which was remarkable in third five-year plan. But, the reliance on foreign borrowing was important issue and the size of external debt led foreigners to be worried about the size of foreign debt (Bayar, 1996).
Figure 2.1 Exports of goods and services (% of GDP), 1960-1980 Period
Source: OECD
Between 1960 and 1970, Turkish economy passed through different phases. An imported good once produced domestically, during this period, it had started to be restricted to import. Important point in this period was inflation and interest rate as important cost in production. Another characteristic of this period was the cheaper products of state led enterprises, which was important source of incentive for industries (Kruger and Tuncer, 1980).
In this period, as a natural consequence of the import substitution policy, export revenues were far behind import requirements. In addition to this, 1973 oil crisis overturned balance of payments. Thus, external borrowing became more important.
2.06 5.12 5.60 4.184.47 4.564.09 4.11 3.68 3.60 4.43 5.32 6.02 7.03 5.73 4.424.86 3.824.15 3.22 5.16 0.00 1.00 2.00 3.00 4.00 5.00 6.00 7.00 8.00 19 60 19 61 19 62 19 63 19 64 19 65 19 66 19 67 19 68 19 69 19 70 19 71 19 72 19 73 19 74 19 75 19 76 19 77 19 78 19 79 19 80
Indeed, in 1976 the ratio of external debt to GDP reached 5%. The period of 1972-1976 was defined as inward-oriented, but outward dependent expansion period (Boratav, 1988).
Turkey experienced high growth rate (Figure 2.2) during the first two five-year plans (1963-1972). The share of industry in GDP rose, the capital-intensive industry expanded, the role of SEEs led to salary increase. Then, it caused rise in SEEs deficit, which later was financed by external borrowing and government transfers. External debt and money supply grew rapidly, and the currency became overvalued (Barutcugil, 1989).
Figure 2.2 GDP Growth (Annual %), 1960-1980 Period
Source: OECD
The growth in 1962-1977 period was about 6.7%, with agriculture 3.3%, industry 10% and service sector 7.8%. In 1979, economic growth declined to about -1% and – 2.5% in 1980 (Figure 2.2). Especially industrial growth until 1977 was about 10%, but declined -3% in 1979 (Barutcugil, 1989). At the same time, the foreign exchange bottleneck was an important issue for growth, because of intermediate and capital goods (Sonmez, 1986).
During 1973-77 the economy grew about 6% (Figure 2.2) and inflation rate about 25%. Inflation rate on average was almost 4 times higher than that of the 1960s.
1.16 5.57 9.07 5.46 2.82 11.21 4.73 6.78 4.08 3.23 5.57 7.43 3.26 5.59 7.17 10.46 3.41 1.50 -0.62 -2.45 -4.00 -2.00 0.00 2.00 4.00 6.00 8.00 10.00 12.00 19 61 19 62 19 63 19 64 19 65 19 66 19 67 19 68 19 69 19 70 19 71 19 72 19 73 19 74 19 75 19 76 19 77 19 78 19 79 19 80
After 1970s, it continued to rise and accelerated to 82 % in 1979 (Figure 2.3). This was during the fourth-five-year plan (1978-1983). The problem of price increase was not only a result of economic policy, but also a result of external and internal shocks, such as oil prices and political unrest. In this period, while the public expenditures had increased rapidly, public revenues were not at the same level. Budget deficits had risen. In order to finance budget deficit, the Central Bank resources were utilized. Thus, high growth of money led acceleration of inflation rate (Barutcugil, 1989).
Figure 2.3 Inflation Rates (CPI), 1960-1980 Period
Source: OECD
During 1977-80 periods, political unrest was an important obstacle for the economy as well. The rising of income inequality and high inflation contributed to civil disorder. These created economic and political instability and pave the way for the military takeover in 1980.
2.2.3 The Period of 1980-2000 and Export-Oriented Economy
During DP in 1953-1960 periods, the import substitution strategy was unplanned, but in 1960s and 1970s economic strategy was with planning development. In the first five-year development plan the import substitution defended as a necessary for appropriate industrialization and foreign trade strategy (Barutcugil, 1989). Until
6.92 13.67 25.32 17.17 -2.59 6.195 4.371.525.62 10.9912.46 5.565.949.28 23.4 10.99 19.7624.62 16.2619.33 46.77 53.97 81.84 75.07 -10 0 10 20 30 40 50 60 70 80 90 19 56 19 57 19 58 19 59 19 60 19 61 19 62 19 63 19 64 19 65 19 66 19 67 19 68 19 69 19 70 19 71 19 72 19 73 19 74 19 75 19 76 19 77 19 78 19 79 19 80
1980, Inward oriented strategy was considered as a necessity for the infant private sector in terms of industrial development.
During the planning period of the 1960s and 70s, the high protectionist policy created costly industries. As a natural consequence of the import substitution strategy, the export revenues remained behind the import spending. With the world oil crisis, Turkish balance of payment deficit widened, and external debt became important issue. In 1976, the external debt was 5 percent of GNP. Boratav (1988) stated 1972-76 as inward oriented, but foreign depended expansion period.
By the end of 1970s, it was clear that Turkey needed a new strategy to dismantle the import substitution policy and transform inward-led (inward-oriented) economic policy into export-driven model. Thus, on January 24th, 1980, the government announced the new economic stabilization program (Bayer, 1996).
The stabilization program was a recipe for the problems experienced in earlier periods. The government transformed the economy from an import substitution industrialization to a more open economy. Trade regime was the core of the policy change. The important steps in program were devaluation of currency, the replacement of fixed exchange rate with the crawling peg nominal exchange rate, liberalization of import regulations, foreign capital inflow and incentives for export; such as tax rebates, export credits. Quantitative restrictions and tariffs on imported goods were either removed or lowered. The import liberalization led any item other than those specifically banned to be imported freely. In addition, control on prices was removed, the interest rate freed and the price of SEEs products increased repeatedly to reduce the public deficits.
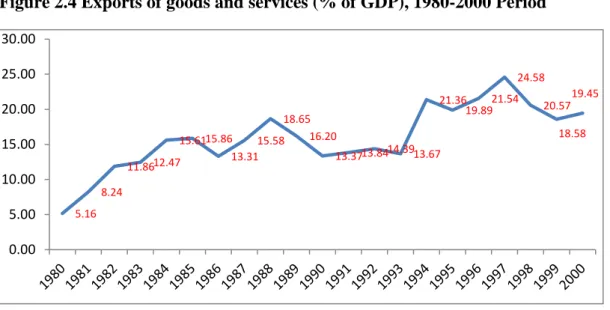
Figure 2.4 Exports of goods and services (% of GDP), 1980-2000 Period
Source: OECD
The developments of economic indicators after the 24th January stabilization program were satisfactory. Exports of goods and services increased substantially from about 5 percent of GDP in 1980 to about 19 percent of GDP in 1988 (Figure 2.4). At the same time GDP growth increased substantially in this period (Figure 2.5).
The stabilization program partially solved the problems experienced in earlier periods. The import substitution plans without competition and the existence of comparative advantages was not enough to export without imports. Especially for Turkey, it is important to have a liberal import trade policy because most of the investment and intermediate goods used in export goods is needed to be imported. But foreign exchange rate is unrealistically priced in previous decades and for competing in world market it was necessary to be depreciated. The steps taken to replace the fixed exchange rate with the crawling peg nominal exchange rate, liberalization of import regulations, foreign capital inflow and incentives for export and removal of quantitative restrictions and tariffs on imported goods were created a synergy for economic growth.
5.16 8.24 11.8612.47 15.6115.86 13.31 15.58 18.65 16.20 13.3713.8414.3913.67 21.36 19.8921.54 24.58 20.57 18.58 19.45 0.00 5.00 10.00 15.00 20.00 25.00 30.00
Figure 2.5 GDP Growth (Annual %), 1980-2000 Period
Source: OECD
In this period, devaluation and trade reforms had caused both export and import to rise. As a positive consequence of outward-led policy, the share of manufacturing in total exports was also increased.
Because of monetization for public debts, inflation was the problem since 1970s. In the first two years of stabilization program, inflation rate declined, but in later years with high public deficits, it continued to rise again.
The problem of external debt and inflation rate continued to be issue after the military seized control of government. Besides these, the lack of significant progress towards privatization was another important issue. Inefficacy of SEEs was the burden on public budget.
To bring the inflation under control, tight monetary policy was utilized, and interest rates were increased. Depressed domestic demand and increased inventories put the pressure on the private sector to export. Despite the support from foreign creditors and the private sector, the program could not survive for a longer time due to the political instability. 4.86 3.56 4.97 6.71 4.24 7.01 9.49 2.32 0.29 9.27 0.72 5.04 7.65 -4.67 7.88 7.38 7.58 2.31 -3.39 6.64 -5.96 -8.00 -6.00 -4.00 -2.00 0.00 2.00 4.00 6.00 8.00 10.00 12.00 19 81 19 82 19 83 19 84 19 85 19 86 19 87 19 88 19 89 19 90 19 91 19 92 19 93 19 94 19 95 19 96 19 97 19 98 19 99 20 00 20 01
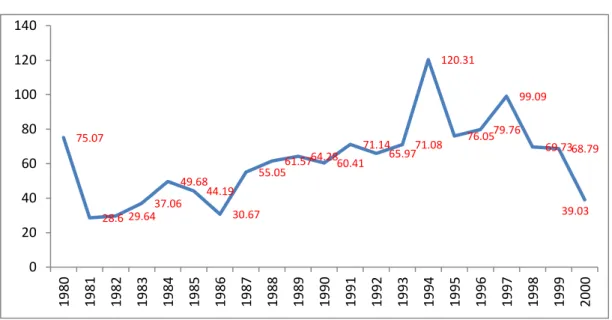
Figure 2.6 Inflation Rates (CPI),1980-2000 Period
Source: OECD
With some problems, the fundamental changes had taken place in 1980s. Turkey transformed economic model from closed to open economic model. International trade and finance became free of barriers, domestic markets were liberalized, prices and interest rates were freed and many restrictions on banking system were removed (Atiyas, 2012).
In order to regulate financial market, the Capital Markets Board (CMB) was established in 1982. Its task was to develop and regulate security market. The CMB was the first independent regulatory authority. This authority was essential for regulating uncontrolled growth of non-banking financial institutions, such as banker’s crisis in 1982. In 1985, a banking law was enacted, which made Treasury and the Central Bank responsible for the supervision and regulation of banks (Atiyas, 2012).
Parallel to these changes, with centralization of policy making authority, discretionary instruments of policy were reduced. Despite the resistance of bureaucracy, which was in favor of state control over economic activity and against market-oriented reforms, Ozal’s government sidestepped normal procedures and centralized policy making authority (Atiyas, 2012).
75.07 28.6 29.64 37.06 49.68 44.19 30.67 55.0561.5764.2860.41 71.14 65.9771.08 120.31 76.0579.76 99.09 69.7368.79 39.03 0 20 40 60 80 100 120 140 19 80 19 81 19 82 19 83 19 84 19 85 19 86 19 87 19 88 19 89 19 90 19 91 19 92 19 93 19 94 19 95 19 96 19 97 19 98 19 99 20 00
The excessive political discretion weakened the aim of banking regulation. The liberalization of the capital account was carried out in liberalizing international finance. Starting from 1950s, the use of public resources was the central strategy of political parties for political advantage. The ban imposed on leaders of political parties throughout the Ozal period contained this tendency. But later in 1987, once this ban was removed, a deterioration in public finance started (Atiyas, 2012).
The secretariat of Treasury and Foreign Trade was established under the Prime Ministry, to be responsible for public debt and cash management, and leaving the Ministry of Finance with the task of revenue collection and procedural management of the public budget. Another important instrument was the extra budgetary funds, which allowed circumventing parliamentary oversight and allocating public funds for important projects (Atiyas, 2012).
One other important institution established in this period was the Competition Authority (CA). The enactment of the competition law passed in 1994 and three years later in 1997, the Competition Authority was established. It was a part of commitment of Turkey under Customs Union with the EU in 1996. The Competition Authority as a public institution was established with the mission of providing, developing and protecting the competitive environment (Atiyas, 2012).
2.2.4 The Period of 1990s
Economic performance in 1991 was influenced by Gulf war, parliamentary election and government change. Due to electoral business cycle, fiscal deficit widened, public deficit climbed to 17% of GDP and inflation rose to 71% for the year.
In 1993 growth of public deficit accompanied by a loosening of monetary supply, in turn led surge in domestic demand and deterioration in current account. Unsustainability of economic policy coupled with downgrading of credit rating and resulted in depreciation of country’s currency by more than 50% against the US dollar in 1994.
The crisis of 1994 was a result of accumulated problems came from previous years. During this period, many macroeconomic problems such as current account deficits,