Investigation of Clay-Organic Complexes of Montmorillonite
Formed by Adsorption of Methylamine and Methylamine
Hydrochloride
Hayrettin KÜÇÜKÇELEBİ1, Mehmet TAŞER1 Nizamettin ARMAĞAN2 ,Çetin GÜLER3
Abstract: Methylamine and methylamine hydrochloride were adsorbed from aqueous solutions on
Ca-montmorillonite and the adsorption isotherms were determined. Orientations of methylamine molecule and methylammonium cation between the layers of montmorillonite were determined by comparing the basal spacings
d (001)
of XRD patterns of the pure clay sample and clay-organic complexes. The binding mechanisms of methylamine molecule and methylammonium cation on the clay surface were discussed by comparing the IR spectra. In addition, the changes caused by the organic matter in the DTA-TGA curves of the clay were analyzed.Key Words: adsorption isotherms, clay-organic complexes, DTA-TGA curves, infrared spectroscopy, x-ray
diffraction.
Montmorillonitin Metilamin ve Metilamin Hidroklorür Adsorpsiyonu
ile Elde Edilen Kil-Organik Komplekslerinin İncelenmesi
Özet: Bu çalışmada, sulu çözelti formundaki metilamin ve metilamin hidroklorit organik bileşikleri,Ca-montmorillonit kiline adsorplanarak adsorpsiyon izotermleri belirlenmiştir. Saf kil örneği ile kil-organik komplekslerinin XRD desenlerindeki bazal aralıklar karşılaştırılarak, metilamin molekülü ile metilamonyum katyonunun, montmorillonitin katmanları arasındaki yönelimleri saptanmıştır. Örneklerin IR spektrumları karşılaştırılarak, organik molekül ve katyonların kil yüzeyi üzerindeki bağlanma mekanizmaları tartışılmıştır. Ayrıca, organik maddenin, kilin DTA-TGA eğrilerinde oluşturduğu değişmeler analiz edilmiştir.
Anahtar Kelimeler: adsorpsiyon izotermleri, kil-organik kompleksleri, infrared spektroskopisi, DTA-TGA
eğrileri, x-ray kırınımı.
Introduction
The nature of clay-organic complexes has long been a subject for research [1]. Until the 1960s, x-ray diffractometry (XRD) was used almost exclusively to study the structure of the complexes formed between expanding 2:1 type layer silicates and organic compounds. While this method has yielded much useful information on the arrangement and conformation of the organic molecule in the interlayer space of such minerals, its usefulness in investigating those changes that may be take place in the structure of the adsorbed compound is limited. The development of infrared spectroscopy (IR), together with improved methods of sample preparation, has provided the means to observe structural changes on a molecular scale and give insight into the nature of the clay-
1
University of Selçuk, Faculty of Arts and Sciences,Department of Physics[42031] Konya/TURKEY 2
University of Ege, Faculty of Sciences, Department of Physics[35100] İzmir/TURKEY 3
organic bond [2]. In conjuction with XRD, DTA (differential thermal analysis) and TGA (thermogravimetric analysis), its application to the study of clay-organic reactions has shed much light on the bonding to and arrangement at the clay surface of organic species.
Two different approaches have been made in studying clay-organic complexes [3]. On the one hand, various extracts and derivatives of organic matter were allowed to react with clays, and the properties of the resulting complex were studied. The other approach has been to utilize organic compounds of known constitution, and to deduce the nature of their interaction with clays from their known properties. The latter direction has resulted in considerable fundamental knowledge about the binding mechanisms involved between various functional groups of organic molecules and the clay mineral surfaces.
Materials and Method
The clay sample used in this work was obtained from Enez (Edirne), Turkey. The smaller than 2 μm fraction of the clay was seperated by sedimentation and subsequently treated by a 30 % hydrogen peroxide solution at 70 °C to remove the organic materials coating the clay. Carbonates were removed by treating the clay sample with 0.5 N acetic acid, and stirring there was no carbon dioxide production. In order to remove amorphous iron oxides, oxalic acid was added to the clay sample, then the solution was boiled for half an hour with cylindirical Al shells placed within.
Short-chain alkylamine and alkylamine salt were obtained from Fluka Chemicals Co. As the company has a good reputation, it was assumed that these organic samples were sufficiently pure and no purification process was applied.
The clay and the clay-organic complexes were analyzed by a Philips PW3710 X-Ray powder diffractometer equipped with a Ni-filtered CuKα radiation source operated at 40 kV and 55 mA. The infrared spectra were obtained with KBr pellets and recorded with Mattson 1000 FTIR Spectrometer. The DTA-TGA curves were obtained by Rigaku Thermal Analyzer-Ver 2.22E2. In order to determine the amount of adsorbed methylamine and methylamine hydrochloride, kjeldahl and titration techniques were used.
Results and Discussion
Calculation Of Structural Formula Of The Clay
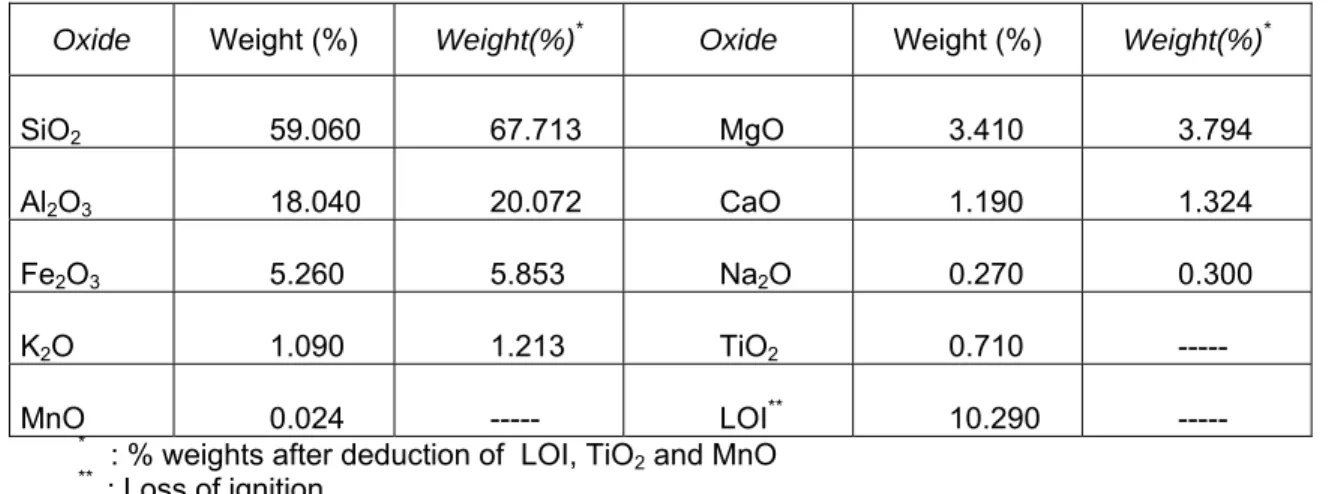
The structural formula of the clay had been calculated from the chemical analysis (Table 1). Small amount of MnO (0.024%) was deducted from the analysis, on the assumption that it was present in unidentified impurity [4]. Since TiO2 (0.71%) can occur in clays in x-ray-amorphous form of anatase, it was also deducted from the analysis [4]. The structural formula of the clay is:
Ca0.172 Na0.0704 K0.187 (Si7.9592 Al0.0408) (Al2.8239 Fe0.533 Mg0.6845) O20 (OH)4. Calculation Of Layer Charge Of The Clay
In the 2:1 type layer silicates, the tetrahedral charge is (7.9592x4) + (0.0408x3) =31.9592, and so the tetrahedral sheet has a net negative charge of (32-31.9592)= 0.0408. The octahedral charge is (2.8239x3) + (0.533x3) + (0.6845x2)= 11.4397 and the octahedral sheet has a net negative charge of (12-11.4397)= 0.5603. Consequently, the total charge deficit on the unit cell (tetrahedral+octahedral sheets) is (0.0408+0.5603)= 0.6011.
Table 1. The chemical analysis results of the clay.
Oxide Weight (%) Weight(%)* Oxide Weight (%) Weight(%)*
SiO2 59.060 67.713 MgO 3.410 3.794
Al2O3 18.040 20.072 CaO 1.190 1.324
Fe2O3 5.260 5.853 Na2O 0.270 0.300
K2O 1.090 1.213 TiO2 0.710 ---
MnO 0.024 --- LOI** 10.290 ---
* : % weights after deduction of LOI, TiO
2 and MnO ** : Loss of ignition
This negative charge is balanced by the interlayer and exchangeable cations in the 2:1 type layer silicates this is (0.172x2) + (0.187x1) + (0.0704x1)=0.6014. Having a value close to 0.6, the layer charge indicates that the clay is of smectite type [5].
Adsorption Process
Methylamine Adsorption and the Determination of Adsorption Isotherm.
Methylamine solutions at seven different concentrations were prepared (Table 2) and approximately 3x10⁻² g clay were added into these solutions. These combinations were kept in a circulated thermostat system for 3 hours. At the end of this period, the clay-solution combination was centrifuged for 15 minutes, thus separating the clay.
Table 2. The results of methylamine adsorption.
M (mass of the clay) x10-2 g C1 (concentration before the addition of the clay)
x10-3 molar
C2
(concentration after the addition of the clay)
x10-3 molar
A
(the change in
concentration due to the adsorption by the clay) x10-3 molar y=A/m (concentration adsorbed by the clay) molar/g 2.52 8.6958 6.1382 3.9719 0.1576 2.64 10.7419 6.9055 5.9579 0.2256 2.58 13.0437 8.4400 7.1495 0.2771 2.87 18.4147 13.1972 8.1027 0.2823 2.72 26.0875 19.1820 10.7242 0.3942 2.75 41.4331 35.2948 9.5326 0.3466 2.68 49.1059 43.2746 9.0560 0.3379
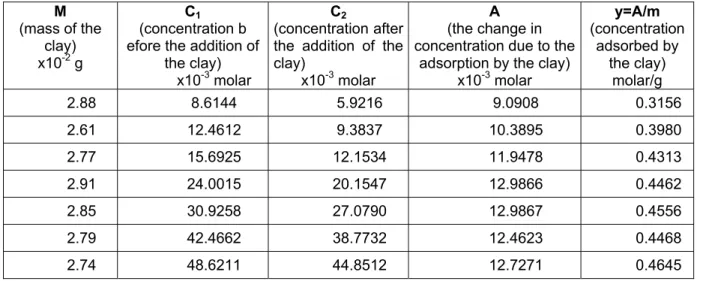
Table 3. The results of methylamine hydrochloride adsorption. M (mass of the clay) x10-2 g C1 (concentration b efore the addition of
the clay) x10-3 molar
C2
(concentration after the addition of the clay)
x10-3 molar
A (the change in concentration due to the
adsorption by the clay) x10-3 molar y=A/m (concentration adsorbed by the clay) molar/g 2.88 8.6144 5.9216 9.0908 0.3156 2.61 12.4612 9.3837 10.3895 0.3980 2.77 15.6925 12.1534 11.9478 0.4313 2.91 24.0015 20.1547 12.9866 0.4462 2.85 30.9258 27.0790 12.9867 0.4556 2.79 42.4662 38.7732 12.4623 0.4468 2.74 48.6211 44.8512 12.7271 0.4645 Results are given in Table 2, where C1 are the concentrations before the addition of clay and
C2 are the concentrations after the addition. The amount of methylamine adsorbed by the clay (the column indicated by A in Table 2) is proportional to (C1 - C2). Since the boiling point of methylamine is low (48 °C), adsorbed samples were dried by keeping them in a vacuumed system at room temperature for one month.
Langmuir and Freundlich isotherms (Figure 1 and Figure 2) were obtained. Having compared the standard errors and the correlation coefficients for these isotherms it was deduced that methylamine adsorption process agrees with Langmuir isotherm. It was observed that adsorbed methylamine amount saturates at 0.025 M concentration of methylamine solution and the adsorption does not increase above this concentration.
Figure 2. Freundlich isotherm for methylamine adsorption.
Methylamine Hydrochloride Adsorption and the Determination of Adsorption Isotherm. The same procedure described in the previous section was followed for methylamine hydrochloride adsorption, except that the adsorbed samples were dried at 100 °C for six hours since the melting point of methylamine hydrochloride is high. Results are shown in Table 3.
Having obtained Langmuir and Freundlich isotherms (Figure 3 and Figure 4) it was concluded on the basis of correlation coefficients and standard errors that methylamine hydrochloride adsorption also obeys Langmuir isotherm. Again the adsorption process saturates at the concentration value of 0.025 M.
XRD Patterns of Clay and Clay-Organic Complexes
It is clear, from the positions of the peaks in the XRD pattern of nonadsorbed clay sample (Figure 5a), that the clay is Ca-montmorillonite [6]. In adsorption studies of clays, the most important evidence of the occurence of adsorption is obtained by comparing basal spacings. The basal spacing for nonadsorbed clay is 14.98 Å, while the basal spacing of methylamine adsorbed clay is 12.56 Å (Figure 5b) and of methylamine hydrochloride adsorbed clay is 12.62 Å (Figure 5c). These results indicate that adsorption had occured. Bradley [7] found a basal spacing of 12.7 Å for methylamine-montmorillonite complex. Rowland and Weiss [8] reported a basal spacing of 12.7 Å for methylammonium-montmorillonite complex, while Theng et al. [9] reported the values of 12.7 Å for moist sample and 12.5 Å for oven-dried one.
Figure 3. Langmuir isotherm for methylamine hydrochloride adsorption.
Figure 5. XRD patterns of (a) Ca-montmorillonite, (b) methylamine-montmorillonite, and (c) methylammonium-montmorillonite.
Since methylamine molecule
(
is neutral, in the adsorption process it is exchanged by the water between clay layers [2]. Adsorbed polar organics, at least short-chain compounds, interact with the exchangeable inorganic cations rather than with the silicate surface. Polar organic compounds succesfully compete with water for essentially the same ligand positions or sites around the exchangeable cation for adsorption to occur. Then methylamine molecule, having a basic character, may become a cation by receiving a proton from the water hydrolized by metal cations. As the basal spacings in the XRD patterns of both methylamine-montmorillonite and methylammonium-montmorillonite are approximately the same (12,6 Å), one may conclude that methylamine molecule can also form methylammonium cation. In other words, it may be speculated that both organic compounds have approximately the same positions between the clay layers and they have similar bindings. However, some authors [2] report that there is no protonation in Ca- and Na-montmorillonite.)
)
CH NH
3 2Methylamine hydrochloride
(CH NH
3 2⋅
HCl
becomes methylammonium cationby receiving the proton of HCl. This organic cation is adsorbed by exchanging with inorganic cations. Ca
(CH NH
3 3 +)
+2 cation forms
CaCl
compound with Cl and this compound removed from the structure by washing [9]. Because Ca atom is more electronegative, the exchanging of organic cation with Ca is more probable. However, there are K2
+1 and Na+1 cations in our clay sample, and organic cation can also exchange with these cations. XRD analysis has shown that organic and inorganic cations are not distrubuted regularly on all surfaces of montmorillonite [3]. In other words, montmorillonite can form interstratified structures containing partly organic and partly inorganic
cations. In this formation, every layer contains only one of these cations. The preferation of one or other of these cations is related to the geometric fit between the charges on the cation and the charges on the clay.
If the thickness of methyl group is taken approximately 4 Å [8], it can be seen that organic cations in the interlayer space may form only one-layer, which is the assumption of Langmuir model. Brindley and Hoffmann [10] have concluded that neutral organic compounds having strong polar groups prefer an orientation in which the carbon zig-zag plane is parallel to silicate surface (
α
orientation). Fripiat et al.[11] limited this orientation to neutral amines which includes less than five carbon atoms and has short-chain structure . Since the basal spacings of short-chain alkylammonium ion complexes are approximately the same, it is clear that these complexes also have the sameα
orientation [2]. Rowland and Weiss [8] have shown that a basal spacing of 12.7 Å is compatible with an orientation in which the organic ion is positioned over a ditrigonal hole of the silicate layer with each hydrogen touching to adjacent oxygen ions.II
II
Adding the thickness of methyl group (4 Å) onto silicate layer thickness (9.6 Å) of 2:1 layered clay gives a basal spacing of 13.6 Å for
α
II orientation. There is approximately 1 Å difference as our clay-organic complexes have a basal spacing of 12.6 Å. This means that methylamine molecule or cation penetrates into the silicate surface. Along withα
II orientation,α
I orientation should also be considered where the carbon zig-zag plane is perpendicular to silicate surface. Rowland and Weiss [8] have suggested that amine end of the cation can penetrate into silicate surface 0.7 Å deep and methyl end penetrate 0.6 Å deep when two hydrogens of organic cation slips into the hole between two oxygens. Assuming the height of methylammonium cation to be 4.3 Å, they have obtained a basal spacing of 12.65 Å. This value is very close to the basal spacings of our complexes. Even though many authors report that alkylamines of short-chain structure haveα
orientation, above discussion suggests that these complexes can also haveII
α
I orientation.Organic matter adsorption of clays changes not only the basal spacings but also other reflections. There are two weak peaks in the 3.3-3.0 Å range of the XRD pattern of nonadsorbed clay, while there is one strong peak at 3.15 Å (Figure 5c) in that of methylammonium-montmorillonite complex. This peak consists of 3.22 and 3.01 Å (121 and 005 reflections) peaks of nonadsorbed clay and, 3.27 and 3.04 Å (111 and 200 reflections) peaks of methylamine hydrochloride [6]. In the spectra of Ca-montmorillonite, 002 reflection is not observed and 003 reflection is very weak, however it is more pronounced in dehydrated form [12]. The peak obtained at 4.99 Å (003 reflection) for nonadsorbed clay and the peak at 5.07 Å (001 reflection) for methylamine hydrochloride are absent in XRD pattern of methylammonium-montmorillonite and there is a new peak at 6.32 Å. Being located approximately at half of the basal spacing, this new peak should correspond to the 002 reflection of methylammonium-montmorillonite complex.
In the XRD pattern of methylamine-montmorillonite (Figure 5b), the peaks at 3.04 and 3.16 Å are seperated. This result may indicate that sharpness of 200 reflection of methylamine is higher than that of methylamine hydrochloride. The peak at 4.99 Å is also absent in XRD pattern of methylamine-montmorillonite and again there is a new peak at 6.27 Å corresponding to the 002 reflection of methylamine-montmorillonite complex.
IR Spectra of Clay and Clay-Organic Complexes.
IR spectra of clay and clay-organic complexes in the range 4000-2500 cm-1 are given Figure 6 and those in the range 1750-400 cm-1 are given in Figure 7. There is not an important change in the spectra between pure and adsorbed samples in the range 4000-2500 cm-1.
Figure 6. IR spectra between 4000 and 2500 cm-1 of (a) Ca-montmorillonite, (b) methylamine-montmorillonite, and (c) methylammonium-montmorillonite.
Figure 7. IR spectra between 1750 and 400 cm-1 of (a) Ca-montmorillonite, (b) methylamine- montmorillonite, and (c) methylammonium-montmorillonite.
In this region, the bands due to montmorillonite are dominant. These bands are: a sharp band at 3630 cm-1 resulting from asymmetric mode of OH stretching vibration; a combined band with medium sharp at 3420 cm-1 resulting from stretching of water OH and structural OH; and a very weak band at 3225 cm-1, which may be a harmonic of HOH angle deformation band of water at 1630 cm-1 [13]. NH stretching bands of methylamine at 3398-3381 cm-1 (asymmetric mode) and at 3344-3324 cm-1 (symmetric mode), and those of methylamine hydrochloride at 2972 cm-1 (asymmetric mode) and at 3075 cm-1 (symmetric mode) are not seen in our spectra [14]. The NH stretching band of methylamine hydrochloride at 3075 cm-1 have been observed by Fripiat et al. [15] as a very sharp band at 3105 cm-1. However, this band is also not observed in our spectra.
The effect of organic matters on the spectra of the clay in the range 1750-400 cm-1 is more pronounced. The deformation band of the water content of the clay at 1630 cm-1, NH2 deformation band of methylamine between 1550-1590 cm-1 and
NH
3 deformation band of methylamine hydrochloride at 1617 cm+
-1 overlap in the range 1630-1615 cm-1. This band is particularly distinct in the spectrum of methylammonium -montmorillonite.
The sharp asymmetric deformation band at 1466 cm-1 and the symmetric
NH
3 deformation band at 1515 cm+
-1 were observed by Fripiat et al. [15], are not observed in our spectra. The band around 1400 cm-1 becomes more distinct in the spectra of clay-organic complexes. This band may result from the overlap of
CH
3−
N
deformation band of methylamine at 1420 cm-1 [14], wagging band ofNH
3+methylammonium -montmorillonite at 1428 cm-1 [15] and the band resulting from calcite content of Ca-montmorillonite [13]. However, it is more probable that this band may result from symmetric deformation band of
CH
3 at 1404 cm-1 which was not observed in methylammonium -montmorillonite but was observed in dimethylammonium-montmorillonite by Fripiat et al. [15]. They have attributed the absence of this band in methylammonium-montmorillonite to the binding of hydrogens ofCH
groups to oxygens of the silicate surface (the keying effect). In other words, they have suggested that there could be hydrogen bonding (3
C
− L
H
O
) betweenCH
groups and oxygens of the silicate surface. However, many authors point that hydrogen bonding (including ) has very little importance in clay-organic complexes and ion-dipole interactions between organic molecule or cation and the silicate surface is more important [2]. One may conclude that observation of the symmetric deformation band ofCH
in spectra of our clay-organic complexes agrees with these studies.3
N
− L
H
O
3
The weak band at 1120 cm-1 and the sharp band at 1035 cm-1 are due to Si-O stretching in the structure of montmorillonite. The sharp band at 1035 cm-1 may have dominated the C-N stretching band of methylamine in the range 1220-1020 cm-1 [13]. The weak band at 915 cm-1 results from M-O-H bending (M represents inorganic cation), the weak band at 877 cm-1 from the calcite content, the weak band at 795 cm-1 from the quartz content, the band at 626 cm-1 from
vibration and the very sharp bands at 522 and 467 cm
M
+3−
OH
-1 fromSi
and[13,16].
NH
rocking band of methylamine hydrochloride at 800 cmO
M
− −
+3M
+3−
OH
3
+ -1 overlaps with the
band at 795 cm-1 and becomes more distinct in spectrum of methylammonium-montmorillonite.
DTA-TGA Curves of Clay and Clay-Organic Complexes
DTA curves of clay and clay-organic complexes are given in Figure 8 and TGA curves in Figure 9. Two endothermic peaks related to the loss of adsorbed moisture are at 70.6 and 159.7 °C in DTA curve of montmorillonite (Figure 8a).
Figure 8. DTA curves for (a) Ca-montmorillonite, (b) methylamine- montmorillonite, and (c) methylammonium-montmorillonite.
Figure 9. TGA curves for (a) Ca-montmorillonite, (b) methylamine- montmorillonite, and (c) methylammonium-montmorillonite.
This peak with two stages indicates that there is a cation with +2 charge in the interlayer space of our clay sample [17]. Very small exothermic peaks observed at 308.3 and 431.4 °C may result from the impurities in the structure like calcite and organic matter. The endothermic dehydroxilation peak related to the removal of the structural OH groups is at 634.4 °C. S-shaped endothermic-exothermic peak between 887.1 and 904.4 °C corresponds to the destruction of the structure.
Heating up the clay-organic complexes results in oxidation of organic matter and an exothermic reaction occurs [18]. The burning of the organic matter due to heating causes oxidation and and
H
are created as the final product after breaking down of all bonds. The first endothermic peak related to the loss of adsorbed moisture shifts to 75.8 °C and is shallower in DTA curve (Figure 8b) of methylamine-montmorillonite. The second endothermic peak shifts by only a few degrees (163.1 °C) and becomes less distinct. The exothermic peak related to the oxidation of methylamine molecule is a two-stage peak whose maxima are at 332 and 355 °C. This peak is much larger than exothermic peak (Figure 8c) of methylammonium cation. There are two peaks at 637.8 and 677.2 °C in the dehydroxilation region. The peak at 677.2 °C may have resulted from the removal of some products which may be produced by the interaction of C and N atoms with the structural OH during the oxidation of adsorbed methylamine. S-shaped endothermic-exothermic peak corresponding to the structural deformation is between 889.2 and 904.8 °C, and both of the endothermic and exothermic parts are much sharper than that of nonadsorbed clay.CO
2 2O
The endothermic peak related to the loss of adsorbed moisture is at 78.8 °C and is shallower in DTA curve of methylammonium-montmorillonite (Figure 8c). Loss of moisture continues up to 170 °C. The smaller endothermic peak is almost absent and is at 219 °C. The large exothermic peak related to the oxidation of methylammonium cation is at 321.9 °C. The endothermic peak in the dehydroxilation range is now at 624.9 °C. The S-shaped peak is between 897.9 and 911.5 °C.
Since the peaks in DTA curves correspond to loss of mass, they are also observed in TGA curves [19]. In the TGA curve of montmorillonite (Figure 9a), there are two regions indicating a loss of mass associated with the endothermic peaks due to loss of adsorbed moisture and OH groups. In TGA curves of methylamine- and methylammonium-montmorillonite (Figure 9b and Figure 9c), there is a third region in addition to those mentioned above. This third region is due to the loss of methylamine molecule or methylammonium cation.
As it is clear from the discussion of XRD patterns and IR spectra there are two important indications of this study. Firstly, adsorbed methylamine molecule or methylammonium cation may have
α
Iorientation as well asα
orientation. However, only after a determination of z-positions of C and N atoms, one can arrive to a decision on which of these two orientations prefered by the organic molecule. If these z-positions are very close to each other, then the orientation isα
and if there is a difference of approximately 1.5 Å (C-N=1.5 Å) between them, then the orientation isα
I. In a follow up study, we are planning to determine the z-positions of C and N atoms by fitting a theoretical model to the experimental pattern. The other important point is that the adsorbed methylamine molecule might have become a methylammonium cation by protonation.II
II
References
1. C. R. Smith, Base Exchange Reactions of Bentonite and Salts of Organic Bases, J. Am. Chem. Soc. Vol. 50,
pp.1561-1563 (1934).
2. B. K. G. Theng, The Chemistry of Clay-Organic Reactions, John Wiley and Sons, New York (1974). 3. M. M. Mortland, Clay-Organic Complexes and Interactions, Advan Agron., Vol. 22, pp.75-117 (1970).
4. D. C. Bain and B. F. L. Smith , Chemical Analysis, ed. M. J. Wilson, A Handbook of Determinative Methods in Clay Mineralogy, pp.248-27, Chapman and Hall, New York (1987).
5. S. W. Bailey, Structures of Layer Silicates, eds. G. W. Brindley, G. Brown, Crystal Structures of Clay Minerals and Their X-Ray Identification, pp.1-42, Mineral Soc., London (1980).
6. JCPDS, International Centre for Diffraction Data (1988).
7. W. F. Bradley, Moleculer Associations Between Montmorillonite and Some Polyfunctional Organic Liquids, J. Am.
Chem. Soc., Vol. 67, pp.975-981 (1945).
8. R. M. Rowland and E. J. Weiss, Bentonite-Methylamine Complexes. Clays Clay Miner., Vol. 10, pp.460-468 (1963). 9. B. K. G. Theng, D. J. Greenland and J. P.Quirk, Adsorption of Alkylammonium Cations by Montmorillonite, Clay
Miner., Vol. 7, pp.1-17 (1967).
10. G. W. Brindley and R. W. Hoffmann, Orientation and Packing of Aliphatic Chain Molecules on Montmorillonite,
Clays Clay Miner., Vol. 9, pp.546-556 (1962).
11. J. J. Fripiat, A. Servais and A. Leonard, Étude de l’adsorption des amines par les montmorillonites:III. La nature de la liaison amine-montmorillonite. Bull. Soc. Chim., France, pp.635-644 (1962).
12. Wood and G. Brown, Least-Squares Profile Refinement of Randomly Interstratified Clay Mineral Structures, J.
Appl. Cryst., Vol. 21, pp.154-168 (1988).
13. H. W. Van der Marel and H. Beutelspacher, Atlas of Infrared Spectroscopy of Clay Minerals and Their Admixtures,
Elsevier, Amsterdam (1976).
14. L. J. Bellamy, The Infrared Spectra of Complex Molecules, Vol.1, Chapman and Hall, London (1975).
15. J. J. Fripiat, M. Pennequin, G. Poncelet and P. Cloos, Influence of the van der Waals Force on the Infrared Spectra of Short Aliphatic Alkylammonium Cations Held on Montmorillonite, Clay Miner., Vol. 8, pp.119-134 (1969). 16. V. C. Farmer and J. D. Russell, The Infrared Spectra of Layer Silicates, Spectro-chimica Acta, Vol. 20, pp.1149-1173
(1964).
17. E. Patterson and R. Swaffield, Thermal Analysis, ed. M. J. Wilson, A Handbook of Determinative Methods in Clay Mineralogy, pp.99-132, Chapman and Hall, New York (1987).
18. R. E. Grim, Clay Mineralogy, Mc Graw-Hill Book Co., New York (1968).
19. R. Greene-Kelly, The Montmorillonite Minerals(Smectites), ed. R. C. Mackenzie, The Differential Thermal Investigations of Clays, pp.140-164, Mineral Soc., London (1957).