See discussions, stats, and author profiles for this publication at: https://www.researchgate.net/publication/321246970
Prediction of dry matter accumulation in bitter vetch
Article in Legume Research · November 2017DOI: 10.18805/LR-356 CITATION 1 READS 53 5 authors, including:
Some of the authors of this publication are also working on these related projects: applied statsitics View project
Features of Red and White Meat Consuption in Some Provinces in Turkey(Istanbul,Samsun,Hatay and Kayseri) View project Ufuk Karadavut
Ahi Evran Üniversitesi
140PUBLICATIONS 318CITATIONS SEE PROFILE Halit Tutar Bingöl University 9PUBLICATIONS 5CITATIONS SEE PROFILE Kagan Kokten Bingöl University 129PUBLICATIONS 236CITATIONS SEE PROFILE
All content following this page was uploaded by Ufuk Karadavut on 01 March 2018. The user has requested enhancement of the downloaded file.
www.arccjournals.com/www.legumeresearch.in
*Corresponding author’s e-mail: [email protected]
1Department of Animal Science, Faculty of Agriculture, University of Ahi Evran, Kirsehir, Turkey.
2Department of Crop and Animal Production, Vocational School of Pazar, University of Recep Tayyýp Erdogan Rize, Turkey. 3Department of Field Crops, Faculty of Agriculture, University of Bingol, Turkey.
4Department of Horticulture, Faculty of Agriculture, University of Sutcu Imam, Kahramanmaras, Turkey. Print ISSN:0250-5371 / Online ISSN:0976-0571
Prediction of dry matter accumulation in bitter vetch
Ufuk Karadavut1, Adil Bakoglu2, Halit Tutar*3, Kagan Kokten3 and Hava Seyma Yilmaz4
Department of Field Crops,
Faculty of Agriculture, University of Bingol, Turkey.
Received: 09-03-2017 Accepted: 07-10-2017 DOI: 10.18805/LR-356
ABSTRACT
This study was carried out in Bingol province on eastern Anatolian Region between 2013 and 2015. In this study, we obtained 14 bitter vetch genotypes from different sources. The experiment was carried our in three replications in randomized block design. Each plant was weekly measured for 6 weeks starting from germination. For each plant, plant height, fresh and dry stem weight, fresh and dry leaf weights were determined. Logistic, Richards and Weibull growth models were fitted to describe the growth pattern of the genotypes. The best fitting model criteria used were coefficient of determination and mean squared. Richards’s growth model was found to best fit the data for most of the genotypes. Logistic model was the worst fit. In Turkey, climate and soil properties have very large variations. For this, local genotypes showed large variation according to plating areas. YEREL LICE genotype showed more stable and it is the height identified all growth models than other local genotypes. However, IFVE 2923 SEL and IFVE 2977 SEL 2802 these genotypes gave positive results in different environmental conditions.
Key words: Bingol province, Bitter vetch, Comparison criteria, Growth models, Local genotypes. INTRODUCTION
Bitter vetch farming has been grown in Turkey since very old times. Some sources claim that bitter vetch farming in our country date back 7000 BC (Ekiz, 1988). Since bitter vetch is resistant to drought and cold climate conditions, it is successfully grown in the different parts of Anatolia. Grain production is important because bitter vetch grains are used as feeding stuff of animals. However, there has been a decrease in production day by day. The main reasons in cultivation area and production are not giving enough importance and not being able to produce registered types that can compete with other grain forage crops. In Aegean, Mediterranean, Central Anatolia and South-eastern Anatolia regions, farmers use landrace populations and they are engaged in agriculture in completely traditional ways (Serin
et al. 1997). The shortness of plant length is an advantage in
terms of adaptation to drought (Keatinge et al. 1991). Bitter vetch, as a short plant, gives good amounts of grain crops even though its mass yield is not much and increases its value as forage crop (Ekiz and Ozkaynak, 1984).
Growth is one of the most important features of living beings. The growth of a living beings is expressed with the increases related to time in terms of height, weight and cell number. Growth rate and amount shows significant differences compared to living things. Bitter vetch has significant differences on both. These differences affect the
growth and development of plants. Especially, the growth that is under the influence of environmental factors can show big and sudden changes (Villegas et al. 2001).
Being able to estimate the growth and development of bitter vetch in advance is important with regards to cultivation. For this reason, the stages of the growth and development of plants can be guessed by using various mathematical models and it is possible to get ready to agronomic interventions (Schepers et al. 2000). In growth studies, the predicted growth needs to have biologically interpretable parameters (Fekeduleng et al. 1999). If growth cannot be defined with the acquired parameters, it will become meaningless. However, it is possible to explain the biological process of growth and identify the factors affecting growth by using the data acquired in different periods (Brown
et al. 1976; Behr et al. 2001).
Growth in plants may be different in different areas. Leaf and trunk growth can vary considerably depending on environmental conditions. For this reason, evaluation of both stem and leaf growth together with whole plant growth is necessary for a good result. In this study, a distinction was made in this direction and the accumulations of dry matter in plants, leaves and plants grown were examined. The purpose of this study is to estimate the dry matter accumulations with the help of some mathematical models
Volume 40 Issue 6 (December 2017) 1039 Logistic model
Richards Weibull
Where, a; the value of asymptote, b; value of plants growth beginning stage, ê; net growth ratio, m; parameter at inflexion point, t; time.
The coefficient of determination (R2) was
determined by the following equation;
Mean squared error (MSE) was determined by the following equation;
STATISTICA 6.0V statistical program was used to evaluate the data obtained in the study. In the analysis, statistics, nonlinear models and nonlinear estimation method were followed.
RESULTS AND DISCUSSION
In this study, we are fitting three models and selecting best for individual genotypes. However, comparing the models will give to us in fitting the best model for identification of growth in all the genotypes. If you are fitting three models and selecting best for individual genotypes, then comparing the models overall does not serve any purpose as there is no point in fitting the same model for all the genotypes. In this case choose that model which fits best for that genotype. The comparison of estimation successes according to the plant height models is shown in Table 1. The average of the coefficient of determination, it is seen by evaluating the measurement made at different times in
bitter vetch.
MATERIALS AND METHODS
This study was carried out in Bingol province with 14 bitter vetch genotypes obtained from different sources. The genotypes forming the material of the work carried out for two years were obtained from the GAP International Agricultural Research and Training Center Directorate. The supplied materials are; IFVE 248-SEL 2785, IFVE 973-SEL 2795, IFVE 2698-SEL 2798, IFVE 2920-SEL 2801, IFVE 3977-2920-SEL 2802, IFVE 3351-2920-SEL 2804, D-357, YEREL LICE, HAT-3, HAT-9, HAT-13, HAT-14 and HAT-19. The field experiment was set up in three replications in a trial design of random blocks in cultivator and harrowed land after the deep release in the 2014 and 2015 raising season. In the experiment, the parcel sizes were determined as 1.2 m x 5 m = 6 m2 and the seeds of each of the examined
biter vetch genotypes opened by 30 cm intervals with the help of a hand marker were planted in 4 rows of 5 m long. Before sowing, DAP fertilizer was given as 3.6 kg nitrogen (N) and 9.2 kg phosphor (P2O5). After the planting, sprinkler irrigation was carried out in trial parcels to ensure the sprouting. Weed struggle were made during the growing season in the parcels.
In the trial, height of each plant, green stem and leaf weights, dry stem and leaf weights of bitter vetch genotypes were measured every week for 6 weeks starting from 1 week after the plants emerged onto the soil. The following models were used for the comparison of the dry matter accumulations that were examined in the study depending on the time. In addition, the coefficient of determination (R2) and mean squared error (MSE) values
were used as comparison criteria to compare models’ forecasting success.
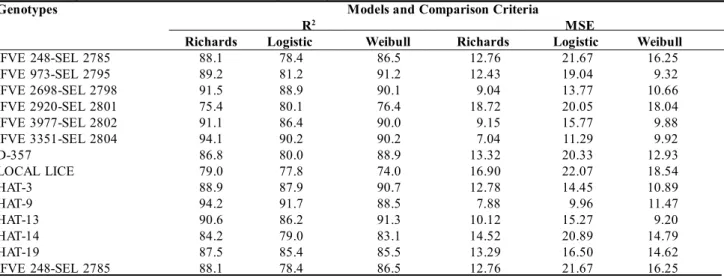
Table 1: Comparison of different models fitted on plant height.
Genotypes Models and Comparison Criteria
R2 MSE
Richards Logistic Weibull Richards Logistic Weibull
IFVE 248-SEL 2785 88.1 78.4 86.5 12.76 21.67 16.25 IFVE 973-SEL 2795 89.2 81.2 91.2 12.43 19.04 9.32 IFVE 2698-SEL 2798 91.5 88.9 90.1 9.04 13.77 10.66 IFVE 2920-SEL 2801 75.4 80.1 76.4 18.72 20.05 18.04 IFVE 3977-SEL 2802 91.1 86.4 90.0 9.15 15.77 9.88 IFVE 3351-SEL 2804 94.1 90.2 90.2 7.04 11.29 9.92 D-357 86.8 80.0 88.9 13.32 20.33 12.93 LOCAL LICE 79.0 77.8 74.0 16.90 22.07 18.54 HAT-3 88.9 87.9 90.7 12.78 14.45 10.89 HAT-9 94.2 91.7 88.5 7.88 9.96 11.47 HAT-13 90.6 86.2 91.3 10.12 15.27 9.20 HAT-14 84.2 79.0 83.1 14.52 20.89 14.79 HAT-19 87.5 85.4 85.5 13.29 16.50 14.62 IFVE 248-SEL 2785 88.1 78.4 86.5 12.76 21.67 16.25
HKO = i-1
Y Observed - Y Pr edicted )2
n
n Yt = a (1 - be -kt) m Yt = a-be-ctd Yt = [1+ exp(-b*(t-c))] +e aR2 = Sum of squared error
that the explanation rate of the models are as follows: 87.7% of Richard model, 86.6 of Weibull model and 84.1% of Logistic model. When examined from the point of view of error squares, it is seen that Richards model has the lowest error with 12.15 values. This was followed by the Weibull model with 12.81 and the Logistics model with a value of 17.00. According to these results, it can be said that the Richards model is more successful than the other models in defining the plant length in the bitter vetch plants.
Karadavut et al. (2010) stated that Richards model was much more successful in ter ms of th e identification of dry matter accumulation which was the best determinant of plant length. The fact that the logistic growth model is symmetrical with respect to the bending point is considered as a sign that the environmental resistance against growth is the same in every period of plant height extension (Yildizbakan, 2005). This is not biologically explicable (Sandland and Mc Gilchrist, 1979). For this reason, explaining the actual change is insufficient. It can also be said that this fact is revealed by having a lower explanation rate than the Richards and Weibull models.
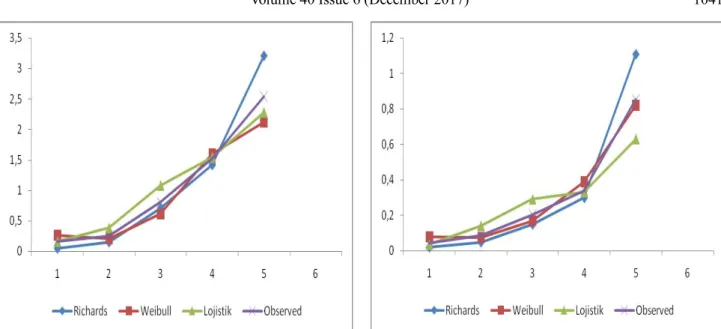
Model comparison results for fresh stem weight are shown in Table 2 and model estimates are shown in Figure 2. The highest mean value was observed in the Richards model with (R2) 86.4, followed by the Weibull model with
85.9. Logistic model was identified at the lowest rate with 84.9. In terms of errors, the average error amount of the Richards model was the lowest at 7.23, while the logistic model was the highest at 8.06. The Hat-13 genotype has been the best-defined genotype in terms of fresh stem weight by all models. The identification rates of this genotype were 94.2 in the Richards model, 92.3 in the Weibull model and 90.2 in the Logistic model. The lowest definition was obtained in the genotype IFVE 3351-SEL 2804 with 74.6 in the Richards model, 75.0 in the logistic model and 74.4 in
the Weibull model. Estimated and observed values of plants according to plant height are shown in Fig 1.
Model comparison results for dry stem weight are shown in Table 3 and model estimates are shown in Figure 3. As shown in the chart, the Richards model has the highest value with 85.53 in terms of the determination coefficient, while the Weibull model with the value of 84.34 has the lowest value. However, the logistic model has been evaluated as the most unsuccessful model since it has the highest error rate average value. The Local Lice genotype with 94.6 detection coefficient and 1.58 HKO value in the Weibull model was the best identified genotype while the Richards model followed the Weibull model with 94.1 detection coefficient value and 1.63 HKO value. In the logistic model, this genotype is defined at a quite high rate with 90.0 R2 and
1.92 HKO values. In contrast, the IFVE 2920-SEL 2801
Figure 1: The best predictive graphs of plant height patterns of LICE genotype
Table 2: Comparison of estimated fresh stem weight with different models.
Genotypes Models and Comparison Criteria
R2 MSE
Richards Logistic Weibull Richards Logistic Weibull
IFVE 248-SEL 2785 91.2 78.4 86.5 12.76 21.67 16.25 IFVE 973-SEL 2795 85.3 81.2 91.2 12.43 19.04 9.32 IFVE 2698-SEL 2798 88.2 88.9 90.1 9.04 13.77 10.66 IFVE 2920-SEL 2801 78.0 80.1 76.4 18.72 20.05 18.04 IFVE 3977-SEL 2802 79.3 86.4 90.0 9.15 15.77 9.88 IFVE 3351-SEL 2804 74.6 90.2 90.2 7.04 11.29 9.92 D-357 84.9 80.0 88.9 13.32 20.33 12.93 LOCAL LICE 92.5 77.8 74.0 16.90 22.07 18.54 HAT-3 90.3 87.9 90.7 12.78 14.45 10.89 HAT-9 89.8 91.7 88.5 7.88 9.96 11.47 HAT-13 94.2 86.2 91.3 10.12 15.27 9.20 HAT-14 87.1 79.0 83.1 14.52 20.89 14.79 HAT-19 88.0 85.4 85.5 13.29 16.50 14.62 IFVE 248-SEL 2785
Volume 40 Issue 6 (December 2017) 1041
Figure 2: The best predictive graphs of plant height patterns of LICE genotype
genotype can be identified at least by Richards and Logistics Models while the IFVE 3977-SEL 2802 genotype is defined at least in the Weibull model.
Since planting, plants are constantly under the influence of genetic and environmental factors (Willan, 1985). As a result, there are differences in plant height and other organs. These differences directly affect all the characteristics of the plant after germination and germination (Toon et al. 1990). Depending on this difference, the growth rates in the plant body also change. The difference in defining the growth models indicates that the factors that the plants are exposed to are also changes in the amount of expression depending on the amount of effect (Hunt, 1982). Some of the nutrients needed by the plant are taken from the outside, while others are created in the plant by photosynthesis. If these requirements are not met adequately, there may be difficulties in growth and development. Trying to explain biological life or predicting is through determining the
cause-Figure 3: The best predictive graphs of plant height patterns of LICE genotype
Table 3: Comparison of estimated dry stem weights with different Models.
Genotypes Models and Comparison Criteria
R2 MSE
Richards Logistic Weibull Richards Logistic Weibull
IFVE 248-SEL 2785 88.3 83.2 84,7 2.54 3.92 3.77 IFVE 973-SEL 2795 83.5 80.1 83,0 3.87 4.60 4.54 IFVE 2698-SEL 2798 78.8 84.7 82,1 4.13 3.78 3.52 IFVE 2920-SEL 2801 75.4 75.0 78,8 4.52 4.71 4.12 IFVE 3977-SEL 2802 77.3 76.3 77,6 4.28 4.56 4.11 IFVE 3351-SEL 2804 87.6 90.4 84,4 2.69 2.14 2.36 D-357 90.2 89.4 91,8 2.01 2.05 1.75 LOCAL LICE 94.1 90.0 94,6 1.63 1.92 1.58 HAT-3 90.2 87.6 81,7 2.04 3.12 2.17 HAT-9 88.9 85.2 85,1 2.45 3.07 2.88 HAT-13 87.5 86.3 85,6 2.59 2.71 2.74 HAT-14 84.6 83.9 83,4 3.56 3.90 2.85 HAT-19 85.5 85.3 83,8 3.91 3.95 3.78
and-effect relationship. The main feature that distinguishes biological development from other developments is that a new part, at least a part of it, is capable of growing by living things. The growth model is a set of equations predicting the development of different time and situations. The variations observed in the fresh body and dry weights of the plan ts clear ly sh ow th at gen otypes h ave differen t characteristics.
Model comparison values that were made according to fresh leaf weights are shown in Table 4 and the model estimates are shown in Figure 4. When the table was examined, the body varied according to the fresh and dry weight and the highest determination coefficient (84.7) was determined in the Weibull model. The logistics model also had the lowest explanation value with 82.8. We also see that Weibull model has the lowest value with 2.21 HKO in terms of error squared averages. With 2.50 HKO, the logistic model has the highest value. It is seen that the local Lice genotype
Table 4: Comparison of estimated fresh leaf weights with different models
Genotypes Models and Comparison Criteria
Richards Logistic Weibull
R2 HKO R2 HKO R2 HKO
IFVE 248-SEL 2785 86.2 1.92 82.0 2.34 83.6 2.21 IFVE 973-SEL 2795 84.8 2.01 81.5 2.18 84.0 2.02 IFVE 2698-SEL 2798 80.4 2.76 85.5 1.97 88.2 1.85 IFVE 2920-SEL 2801 76.3 4.13 74.9 4.51 80.0 2.45 IFVE 3977-SEL 2802 75.1 4.18 76.3 4.28 74.7 4.57 IFVE 3351-SEL 2804 82.8 2.34 80.2 2.78 85.3 1.96 D-357 90.2 1.30 88.1 1.56 92.3 1.18 LOCAL LICE 93.1 1.03 90.4 1.37 94.5 1.09 HAT-3 78.3 3.89 76.9 3.98 75.6 4.16 HAT-9 84.8 1.97 82.7 2.26 83.0 2.21 HAT-13 86.0 1.79 85.0 1.90 87.3 1.69 HAT-14 87.9 1.72 85.8 1.79 85.1 1.82 HAT-19 88.3 1.56 86.7 1.66 86.8 1.59
Figure 4: The best predictive graphs of plant height patterns of LICE genotype
is the best explained genotype in fresh leaf weight. All models explained this genotype with the highest value and got the lowest HKO value.
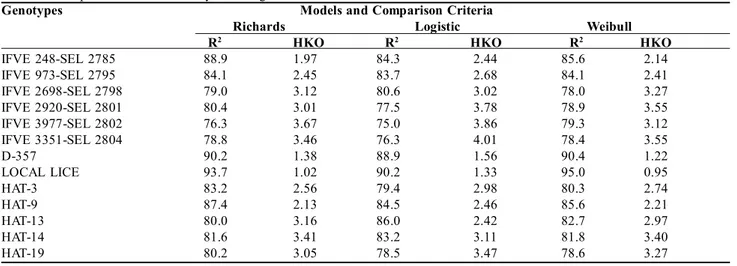
The model comparison results for dry leaf weights are shown in Table 5 and the model predictions are shown in Fig. When the table was examined, the body varied according to the fresh and dry weight and the highest determination coefficient (83.37) was determined in the Richards model. The Weibull model is in the second place (82.68). The logistic model also had the lowest explanation value with 82.16. However, judging by the explanation ratios, it seems that there are not very big differences.
In terms of error squared averages, we also see that the Richards model has the lowest value with 2.65 HKO. 2.86 With the HKO, the logistics model has the highest value. Similar to the determination coefficient, it is striking that the HKO values of all three models are very close to each other. It is also seen that the local Lice genotype is the best explained genotype in dry leaf weight. All the models
Table 5: Comparison of estimated dry leaf weights with different models
Genotypes Models and Comparison Criteria
Richards Logistic Weibull
R2 HKO R2 HKO R2 HKO IFVE 248-SEL 2785 88.9 1.97 84.3 2.44 85.6 2.14 IFVE 973-SEL 2795 84.1 2.45 83.7 2.68 84.1 2.41 IFVE 2698-SEL 2798 79.0 3.12 80.6 3.02 78.0 3.27 IFVE 2920-SEL 2801 80.4 3.01 77.5 3.78 78.9 3.55 IFVE 3977-SEL 2802 76.3 3.67 75.0 3.86 79.3 3.12 IFVE 3351-SEL 2804 78.8 3.46 76.3 4.01 78.4 3.55 D-357 90.2 1.38 88.9 1.56 90.4 1.22 LOCAL LICE 93.7 1.02 90.2 1.33 95.0 0.95 HAT-3 83.2 2.56 79.4 2.98 80.3 2.74 HAT-9 87.4 2.13 84.5 2.46 85.6 2.21 HAT-13 80.0 3.16 86.0 2.42 82.7 2.97 HAT-14 81.6 3.41 83.2 3.11 81.8 3.40 HAT-19 80.2 3.05 78.5 3.47 78.6 3.27
Volume 40 Issue 6 (December 2017) 1043 described this genotype with the highest value and had the
lowest HKO value.
The effect of environmental factors on plant growth is known. Time and amount of activity are more important. In particular, factors such as impaired enzyme activation, nutrient imbalance, decreased membrane permeability, defects in th e over all metabolic pr ocess, osmotic incompatibility and imbalance in water intake, oxidative stress, and overall developmental failure are the most important factors (Orcutt and Nilsen, 1996). Yakit and Tuna (2006) found that stress factors significantly reduce fresh and dry leaf weights in corn plants. Dolarslan and Gul (2012) reported that environmental stress factors were more likely to affect greener ground subsurface rather than subterranean soil. Especially, it has been stated that the fresh and dry weight of the leaves should be expected to be affected. In our study, it is seen that the local genotypes collected from different regions have serious differences in adaptation to the soil and climate characteristics of the area where the aquaculture is made.
Some of the plants may have been stressed by experiencing difficulty in adapting to the environment, which may have reduced the success of identifying growth and development fluctuations. It is reported that environmental stress factors cause closure of stomata in the leaves, decrease the structure of chloroplasts and reduce CO2 fixation, and they affect photosynthesis negatively (Zhu, 2001). In our study, it is seen that some genotypes especially experienced these troubles.
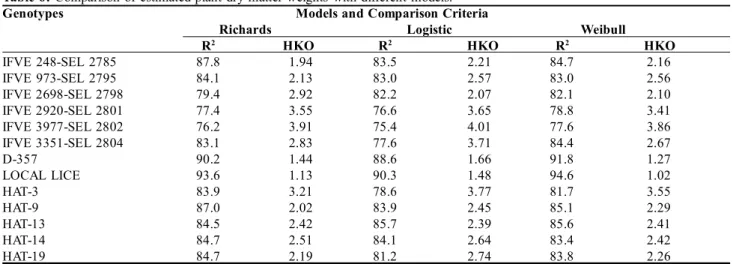
When comparing the model according to total dry plant weights, it is seen that Richards and Logistic models have the same determination coefficient as 84.35. For the HKO average, the Weibull model was somewhat low (Table 6). In the Richards model, the HKO was 2.48, while in the Weibull model it was 2.46. It can be said that a very serious difference does not appear and the identification is the same in both models. The logistic model was followed by these models
Table 6: Comparison of estimated plant dry matter weights with different models.
Genotypes Models and Comparison Criteria
Richards Logistic Weibull
R2 HKO R2 HKO R2 HKO
IFVE 248-SEL 2785 87.8 1.94 83.5 2.21 84.7 2.16 IFVE 973-SEL 2795 84.1 2.13 83.0 2.57 83.0 2.56 IFVE 2698-SEL 2798 79.4 2.92 82.2 2.07 82.1 2.10 IFVE 2920-SEL 2801 77.4 3.55 76.6 3.65 78.8 3.41 IFVE 3977-SEL 2802 76.2 3.91 75.4 4.01 77.6 3.86 IFVE 3351-SEL 2804 83.1 2.83 77.6 3.71 84.4 2.67 D-357 90.2 1.44 88.6 1.66 91.8 1.27 LOCAL LICE 93.6 1.13 90.3 1.48 94.6 1.02 HAT-3 83.9 3.21 78.6 3.77 81.7 3.55 HAT-9 87.0 2.02 83.9 2.45 85.1 2.29 HAT-13 84.5 2.42 85.7 2.39 85.6 2.41 HAT-14 84.7 2.51 84.1 2.64 83.4 2.42 HAT-19 84.7 2.19 81.2 2.74 83.8 2.26
Figure 6: The best predictive graphs of plant height patterns of LICE genotype
Figure 5: The best predictive graphs of plant height patterns of LICE genotype
with a coefficient of determination of 82.36 and a value of 2.72 HKO. When all the models are evaluated, the most successful description is in the other features, while in the local Lice genotype, the lowest definition is the IFVE 3977-SEL 2802 genotype.
Serious differences can be seen in the land of arid and semi-arid climates even in very small areas. This problem is often felt deeper in areas where it is dominated by degraded soil structure, hard soil layers, unsuitable irrigation pattern, over fertilization, inadequate drainage system and excessive evaporation in closed basins (Rabie and Almadini, 2005).
Karakullukçu and Adak (2008) stated that abiotic factors cause germination retardation in plants, inhibition of the development of root and supernumerary organs, and decrease of stem and stem dry weights. It is highly variable in ecological conditions and has a characteristic that can affect plant growth and development negatively. For this reason, the development of plants has made differences in the different organs of the plant as well as the effect of the plant as a whole. The difference in the definition of plant dry weight also causes differences to be seen.
CONCLUSION
Growth is a very complex and multi-factor phenomenon. It is important that the measurements used in estimating the parameters included in the growth equations
are obtained at equal time intervals. Thus, it is possible to predict the factors such as the size, dry weight and yield that plants can reach in the coming years. However, for reliable estimates, both the number of samples should be sufficient and the data must be obtained in a balanced manner over the longest period of time at which the organism can naturally experience its onset of growth. The adequacy of the models can be demonstrated by checking with experiments and real situations. However, the suitability of models to the data is not always evidence of the success of the models. It does not show the correctness of the model to fit into a single entity. The model should be tested in different situations to try to prove its correctness. In addition, two demands must be balanced in a successful growth model. First; the model can fully represent the real system, and the second is that the model is as simple as possible.
Given the climate and soil requirements, Turkey, which has a very large variation, has to develop genotypes or varieties suited to these differences. For this reason, local genotypes should be given priority. Local Lice genotype shows a more stable structure in this study where local genotypes were collected. It has the highest identification success in the important parts of the properties. It will be useful to work on this genotype. It is also understood that IFVE 2920-SEL 2801 and IFVE 3977-SEL 2802 are generally not stable and stressed.
REFERENCES
Behr, V., Hornick, J.L., Cabaraux, J.F., Alvarez, A., and Istasse, L., (2001). Growth patterns of Belgian Blue replacement heifers and growing males in commercial farms. Livestock Production Science, 71(2-3): 121-130.
Brown, J.E., Fitzhung, H.A., and Cartwright, T.C., (1976). A comparison of nonlinear models for describing weight-age relationships in cattle. Journal of Animal Science, 42(4): 810-818.
Dölarslan, M., Gül, E., (2012). Salinity in terms of Soil Plant Relationships. Turkish Scientific Review Magazine, 5(2): 56-59. Ekiz, H., (1988). Comparison of some agronomic traits in Bitter vetch (Vicia ervilia (L.) Willd.) lines. Ankara Univ. Agri. Fac. Pub.
No: 1098. Scientific research and reviews: 196.
Ekiz, H., Özkaynak, Ý., (1984). Research on important morphological, biological and agricultural characters of some bitter vetch (Vicia ervilia (L.) Willd.) cultivated in Turkey. Ankara University Institute of Science and Technology Publication No: TB. 5, Ankara.
Fekeduleng, D., Mac Siurtain, M.P., Colbert, J.J., (1999). Parameter estimation of nonlinear growth models in forestry. Silva Fennica, 33(4): 327-336.
Hunt, R., (1982). Plant Growth Curves. The functional Approach to Plant Growth Analysis. Edward Arnold Ltd., London.
Karadavut, U., Palta, Ç., Kökten, K., Bakoðlu, A., (2010). Comparative study on some non-linear growth models for describing leaf growth of maize. International Journal of Agriculture and Biology, 12(2): 227-230.
Karakullukçu, E., and Adak, M.S., (2008). Determination of Salt Tolerances of Some Chickpea (Cicer arietinum L.) Varieties. Journal of Agricultural Sciences, 14(4): 313-319.
Keatinge, J.D.H., Asghar, A., Khan, B.R., Abd El Moneim, A.M., and Ahmad, S., 1991. Germoplasm evaluation of annual sown forage legumes under environmental conditions marginal for crop growth in the highlands of West Asia. Journal of Agronomy and Crop Science, 166(1): 48-57.
Orcutt, D.M. and Nilsen, E.T., (1996). The physiology of Plants Under Stress: Soil and Biotic Factors. John Wiley & Sons, Inc., pp: 177-237, New York.
Rabie, G.H., and Almadini, A.M., (2005). Role of bioinoculants in development of salt tolerance of Vicia faba plants under salinity stress. African Journal of Biotechnology, 4(3): 210-222.
Sandland, R.L. and Mc Gilchrist, C.A., (1979). Stochastic Growth Curve Analysis. Biometrics, 35: 255-271.
Schepers, A.W., Thibault, J., Lacroix, C., (2000). Comparison of simple neural network and nonlinear regression models for description modelling of Lactobacillus helveticus growth in pH-controlled batch cultures. Enzyme and Microbial Technology, 26(5-6): 431-445.
Volume 40 Issue 6 (December 2017) 1045
Serin, Y., Tan, M., Çelebi, H.B., (1997). Identification of the appropriate bitter vetch (Vicia ervilia (L.) Willd.) lines to Erzurum region. Field Crops Central Research Institute Magazine, 6(2): 13-22.
Toon, P.G., Haines, R.J., Dieters, M.J., (1990). Relationship between seed weight, germination and seedling height growth in Pinus caribae Morele. var. hondurensis Barre and Golfri. Seed Science and Technology, 19: 389-402.
Villegas, D., Aparicio, N., Blanco, R., Royo, C., (2001). Biomass accumulation and main stem elongation of durum wheat grown under Mediterranean conditions. Annals of Botany, 88(4): 617-627.
Willan, R.L., (1985). A guide to forest seed handling with special reference to the Tropics. FAO Forestry Paper, 20-2. FAO, Rome. Yakit, S., and Tuna, L., (2006). The effects of Ca, Mg and K on stress parameters in corn plant (Zea mays L.) under salt stress. Mugla
University Institute of Science Biology, Mugla.
Yildizbakan, A., (2005). Mathematical models of growth in trees and comparison of these models. Çukurova University, Institute of Science, Department of Animal Science, Master Thesis, Adana.
Zhu, J.K., (2001). Plant Salt Tolerance. Trends in Plant Science 6(2): 66-71.
View publication stats View publication stats