Commun.Fac.Sci.Univ.Ank.Series A2-A3 Volume 59, Number 2, Pages 29-40 (2017) DOI: 10.1501/commua1-2_0000000102 ISSN 1303-6009
http://communications.science.ankara.edu.tr/index.php?series=A2
Received by the editors: October 27, 2017; Accepted: December 18, 2017.
Key word and phrases: Ground Penetrating Radar (GPR), GPR Data, Underground Structure, Anomalies, Profile, Trace, Sampling Value, Preprocessing, Interpolation, 3D Visualization.
© 2017 Ankara University Communications Faculty of Sciences University of Ankara Series A2-A3: Physical Sciences and Engineering Communications de la Faculté des Sciences de l'Université d'Ankara-Séries A2-A3: Physical Sciences and Engineering
3D VISUALIZATION APPROACH TO GPR DATA
MERVE ÖZKAN OKAY and REFIK SAMET
Abstract.Ground Penetrating Radar (GPR) is used to acquire data from near-surface depth for archeological, infrastructural, etc. researches and applications. Acquired data allow users to visualize and interpret the underground structures with high accuracy. The 3D visualization of the underground structures is one of the most problem for GPR research and applications. Usage of the suitable approach for 3D visualization will increase the accuracy of visualization and interpretation of underground structures. In order to contribute to this problem, an approach is proposed. Firstly, GPR data are acquired from the search area and data preprocessing steps are applied to GPR data. Secondly, the incomplete or missing data are recovered using interpolation techniques. Thirdly, the GPR data corresponding to the underground structures or anomalies are extracted and placed in a 3D cube. Finally, the extracted GPR data are visualized in 3D environment. The proposed approach was implemented on the real GPR data acquired from the test area. The results showed that created 3D models of the underground structures are very close to real model.
1. Introduction
In general, in GPR research and applications, the search area is squared and scanned to acquire the raw data [3], [6]. The acquired raw data are preprocessed for interpreting the underground structures. One of the most important problems GPR research and applications is 3 dimensional (3D) visualization of hidden structures (anomalies) in GPR data [2]. This study proposes a method for contributing the mentioned problem. The proposed method consists of four steps. In the first step of proposed method, raw data is acquired from search area. This acquired raw data were previously processed using standard data processing techniques (trace editing, spectral analysis and band-pass filtering, highpass filtering, background removal, gain and migration etc.). In the second step, interpolation techniques are used to recover the missing data [11-13]. After completing the missing data, filter is applied without disturbing the resolution of the profiles to remove meaningless spots or the noises caused by electromagnetic waves. In the third step, the underground structures are extracted from GPR data and placed in a 3D cube. In the final step, the extracted
part of underground structure (anomaly) are visualized in 3D environment by adding volume obtained 2D model. The 3D model of underground structures viewed from different angles.
This study is organized as follows. In Section 2, the proposed approach to 3D visualization and interpretation of the GPR data is described. The implementation results using real GPR data are discussed in Section 3. The obtained results are summarized in final section.
2. PROPOSED APPROACH
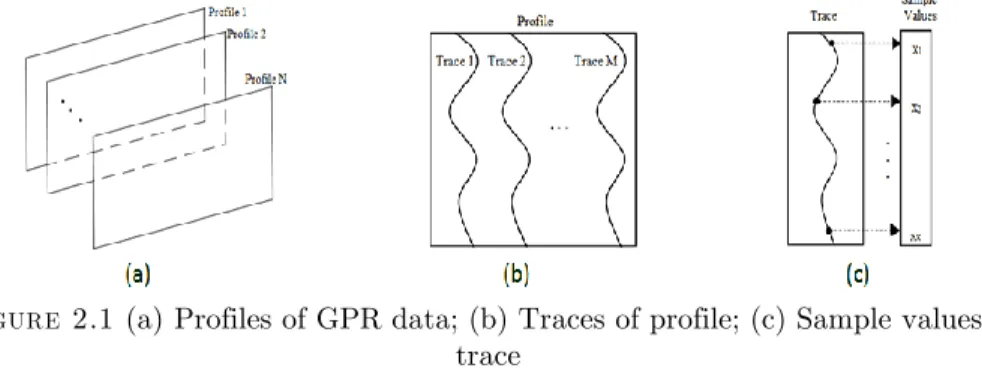
GPR data consist of 𝑁 parallel profiles. Each profile consists of 𝑀 traces. Each trace consists of 𝐾 sample values (Fig.2.1).
Figure 2.1 (a) Profiles of GPR data; (b) Traces of profile; (c) Sample values of trace
The proposed approach for visualizing and interpreting the underground structures (anomalies) in the 3D environment consists of four steps:
1. Obtaining GPR data and data processing; 2. Recovering the missing GPR data;
3. Extraction of underground structures (anomalies); 4. 3D Visualization of underground structures.
2.1. Obtaining GPR data and Data Processing
It is necessary to use data sets obtained from the search area where the underground structure is well known for testing and verification of proposed technique [15]. The test area is created for obtaining this type of data set. The various sizes materials
(such as, pipes and stone walls, metal and plastic drums) were placed in this test area and obtained data from there.
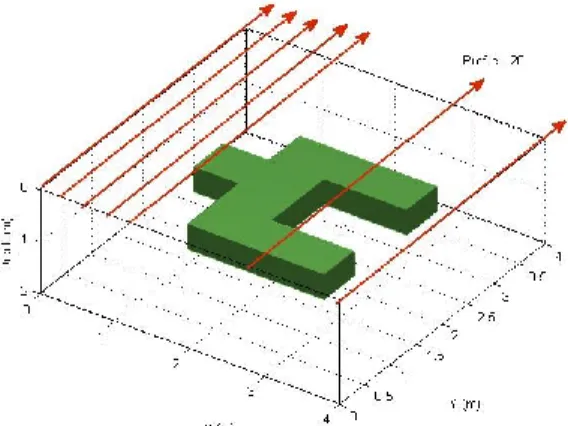
Generally, wall structures are investigated in GPR research, especially in archeological applications. The wall structure used in this study was placed to lie within an area of 4x4 square meters. A wall structure with dimensions of 2x2 square meters is included. The depths of the upper and lower surfaces of the object are defined to be 0.7 meters and 1.2 meters, respectively. A 3D view of the model is provided below (Fig. 2.2). The wall structure was scanned parallel lines for obtaining raw data.
Figure 2.2. 3D view of the wall structure model used in this study
Software such as GPRMax 2D/3D and MatGPR [1], [5] can be used for the processing of data. In this study, the GPRMax 2D/3D software package was used to obtain the appropriate data from raw data. During data collection, the main concern should be to select the profile orientation such that the profiles will intersect the structure perpendicularly. Different users will apply different data processing stages. Generally, certain data processing steps, such as “dewow”, “gain”, “filters”, and “background removal”, are applied to all data. If hyperbolas appear in the radargrams, then “migration” processing should be applied. In this study, the MatGPR software package was used for data processing, and “gain”, “background removal” and “migration” procedures were applied to the profiles.
2.2. Recovering the Missing GPR Data
According to the size of the search area and the data acquisition parameters, different numbers of profiles are acquired. The acquired GPR data may be incomplete and insufficient, due to the some properties of the search area (rugged surface, obstacles, characteristics of underground structures, etc.). The search area properties are outside of the control of users and it is affected by any physical or chemical change in search area. In order to visualize underground structures (anomalies) more clearly, either data should be acquired at small intervals or interpolation methods are applied [7], [9], [11-13]. The advantage of collecting data with a small profile interval is that doing so allows the geometry of underground structures to be visualized at high resolution. However, this benefit comes with the disadvantage of increasing the cost and processing time. Because of mentioned problem, interpolation methods are applied for producing or recovering missing data.
2.3. Extraction of Underground Structures (Anomalies)
After data processing and recovering, in regions without anomalies, the sampling values in the profiles consist of values close to each other according to the properties of the environment. The anomalies are extracted from the profiles by using sampling value feature. The sampling value in GPR data very close to each other without anomalies, otherwise, these values are quite different [10]. The averages and standard deviations of the sampling values of the profiles are calculated to extract anomalies. The threshold value is calculated by using these average and standard deviation values (Eq. (2.1)).
𝑡𝑛= 𝑚𝑒𝑎𝑛(𝑃𝑛) + 𝑠𝑡𝑑(𝑃𝑛), 𝑛 = 1,2, … , 𝑁 (2.1)
where,
t
is threshold value for extracting anomalies,N
is the total number of obtained profiles from the search area and 𝑃 is the examining profile to extract anomalies. Sampling values above or under the threshold value are extracted and placed in a 3D cube.2.4. Visualization of Underground Structures in 3D Environment
The sampling values representing the anomalies extracted from the profiles by using sampling values properties (Eq. #1) are placed in a 3D cube. Thus, 2D visualization of underground structure is obtained. During the extraction operation, some meaningless points can be extracted from profiles and because of this the geometry of underground structures is affected negatively. In order to solve mentioned problem meaningless points are removed from image. After that, smoothing is applied to soften sharp edges and regions. The 3D image is created by adding the volume to
the whole 2D image [8], [10], [14]. After the 3D image is created, the colors of isosurface are calculated using the color values and the image is colored.
3. IMPLEMENTATION OF PROPOSED APPROACH
3.1. Used Data Set
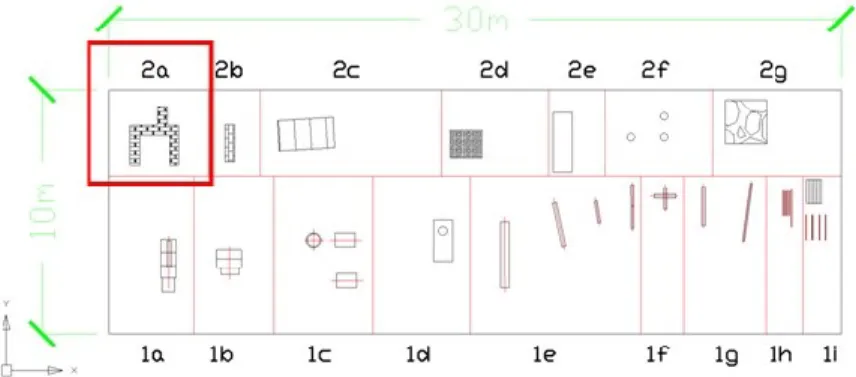
In this section, the results of applying the proposed methodology to real data are presented. For this purpose, the data acquired from a test area specifically designed and created. The test area is located on the Golbasi Campus of Ankara University. The layout plan for the objects embedded in the test area is illustrated in Fig. 3.
Figure 3.1.Object layout plan in the test area
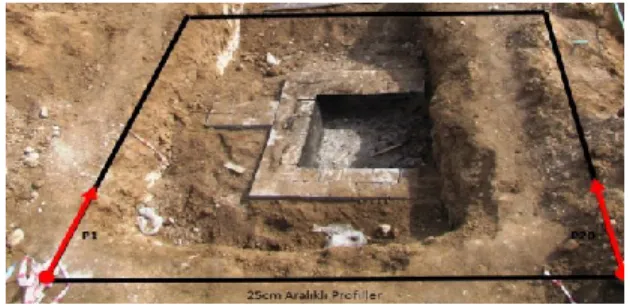
A real image of the wall structure represented by the object numbered 2a in Fig. 3.1 is shown below (Fig. 3.2). 20 parallel profiles of the wall structure were acquired from the test area. The profile length was about 5 m. The distance between the profiles was taken as 0.25 m. The direction of the recorded profiles is shown in Fig. 3.2.
Figure 3.2. The wall structure and directions of profiles The wall structure has the following properties:
- Width: 200 cm - Length: 200 cm - Thickness: 60 cm
- Embedded base depth: 120 cm - Embedded ceiling depth: 70 cm.
First, marker alignment and direction editing operations were applied to the acquired data. The remaining data processing operations such as DC shift, static correction, linear gain, band-pass filter, background removal, were performed.
3.2. Implementation Results
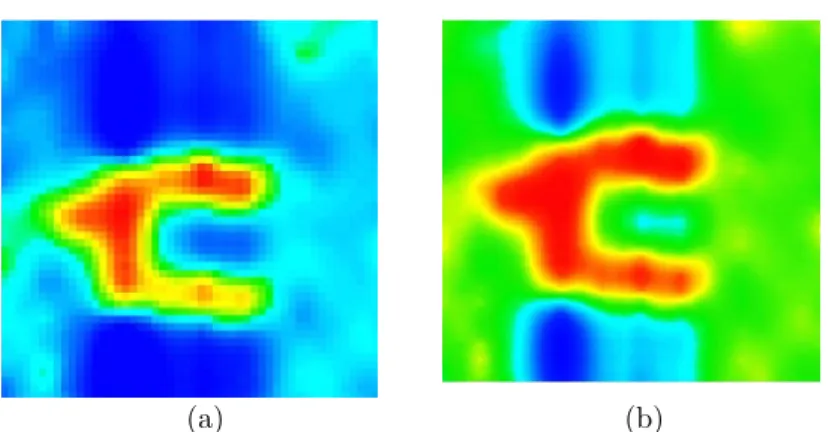
According to the proposed approach in this study, firstly, data preprocessing steps and interpolation were applied to recovering the missing data. The sharp regions on the anomaly were softened and gaps due to data loss were filled. After recovering the data, filter is applied to remove outliers and noises. Figure 3.3 (a) and (b) show the wall structure slice before and after preprocessing and interpolation, accordingly.
(a) (b)
Figure 3.3
.
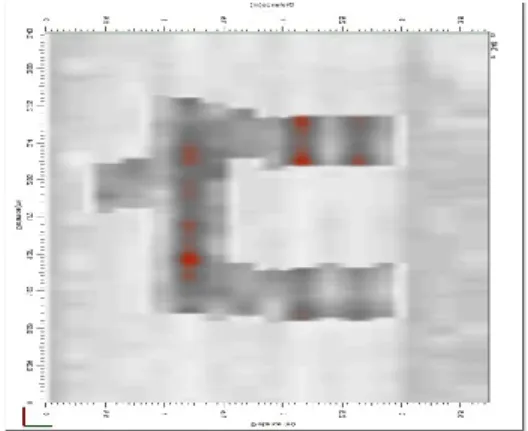
a) The wall structure slice before preprocessing and interpolation; b) The wall structure slice after preprocessing and interpolation.Secondly, regions with anomalies extracted from the profiles by using the calculated threshold value according to Eq. #1. The extracted regions were placed in 3D cube. After this process, it can be understood that the 2D view is the wall structure (Fig. 3.4).
Figure 3.4.Anomalies in the cube
The 2D wall regions obtained from each profile were placed in a 3D cube. The obtained 2D image was combined as a whole by patch graphics. A patch graphics object is composed of one or more polygons that may or may not be connected. Patches are useful for modeling objects and for drawing 2- or 3-D polygons of arbitrary shape.
The wall structure was created, by specifying the coordinates of anomalies vertices/edges and some form of color data. After patching operation, wall image was completed as a whole. The obtained patched image is shown in Fig. 3.5.
Figure 3.5. The patched wall structure image
After the patching operation, image resolution was affected negatively. In order to solve this problem, filter and smoothing is applied to obtained wall structure image. Finally, by adding volume and colored to the image processed, 3D image of underground structure was created. Different views of the created wall structure are given in Fig. 3.6.
4. RESULTS
GPR is a widely used method to investigate the underground structures in near surface depth. The use of GPR method has been increasing in recent years as it has detected underground structures quickly and accurately. In GPR studies, 3D visualization of GPR data play a vital role in the identification of underground structures accurately. GPR data are used to investigate underground structures (anomalies). Thanks to this data, different underground structures (anomalies) are detected, examined and visualized. In the considered context, 3D visualization approach is proposed and the obtained results are summarized below.
One of the most important problems in GPR research and applications is visualization and interpretation of the underground structures with high accuracy. In order to contribute to this problem, four-step approach is proposed to visualize and interpret the underground structures. Firstly, the real data acquired from created test area and preprocessing operations are applied. Secondly, the missing data in the GPR profiles, traces and sampling values were recovered and the anomalies were clarified with interpolation techniques. Subsequently, the anomalies were extracted from the profiles and placed 3D cube. Finally, the anomalies were visualized in 3D environment with added volume. In summary, 3D visualization was performed to visually investigate and interpret the information of anomalies such as type of structure and its depth. By inspecting the 3D model of underground structures from different angles users can interpret anomalies with high accuracy. The obtained results have showed that visualized 3D model of the underground structures are very close to real model.
Acknowledgement
This work has been funded by The Scientific and Technological Research Council of Turkey - TÜBİTAK under grant 5130012 project and 2211-E research fellowship
program.
REFERENCES
[1] Arkedani, M.R., Neyt, X., Benedetto, D.,Slob, E.,Wesemael, B., Bogaert, P., Craeye, C., Lambot, S., 2014. Soil moisture variability effect on GPR data. 15th International Conference on Ground Penetrating Radar, Brussels, Belgium, p. 214-217.
[2] Conroy, J.P. and Radzeviciu, S.J. 2003. Compact MATLAB code for displaying 3D GPR data with translucence. Computers & Geosciences 29, 679–681.
[3] Conyers, L.B. 2004. Ground-Penetrating Radar for Archaeology. AltaMira Press, Lanham
[4] Dojack, L. 2012. Ground Penetrating Radar Theory, Data Collection, Processing and Interpretation: A Guide for Archaeologists, 7-9.
[5] Giannopoulos, A., 2005. Modelling ground penetrating radar by GprMax. Construction and Building Materials 19, 755–762.
[6] Goodman, D., Piro, S., Nishimura, Y., Schneider, K., Hongo, H., Higashi, N., Steinberg, J., Damiata, B., 2009. GPR archaeometry, In: Jol, H.M. (Ed.), Ground Penetrating Radar: Theory and Applications. Elsevier, Amsterdam, pp. 479-508.
[7] Intyas, I., Suksmono, A.B., Munir, A. 2016. Image Quality Improvement for GPR Acquisition Using Interpolation Method. In: The 22nd Asia-Pacific Conference on Communications, Yogyakarta, Indonesia.
[8] Kadioglu, S. and Ulugergerlic E.U. 2012. Imaging karstic cavities in transparent 3D volume of the GPR data set in Akkopru dam, Mugla, Turkey. Nondestructive Testing and Evaluation, 27(3), 263–271.
[9] Maeland, E., 1988. On the comparison of interpolation methods. IEEE Transactions on Medical İmaging. 7, 213-217.
[10] Nuzzo, L., Leucci, G., Negri, S., Carrozzo, M.T. and Quarta,T. 2002. Application of 3D visualization techniques in the analysis of GPR data for archaeology. Annals Of Geophysıcs, 45(2), 231-337.
[11] Ozkan, M. and Samet, R., 2017. “Interpolation Techniques to Recover the Incomplete GPR Data”. In: The 16th International Conference Geoinformatics, Kiev, Ukraine.
[12] Samet, R. and Özkan, M. 2016. Incomplete Data Production Techniques in GPR Research and Applications. In: The 15th International Conference Geoinformatics, Kiev, Ukraine.
[13] Samet, R., Çelik, E., Tural, S., Şengönül, E., Özkan, M., E., Damcı, “Determining the optimal profile interval by using interpolation techniques in GPR applications”, J.Appl. Geophysics, 2017.
[14] Sun, W., Xu, Q., Zhang, H., Yao, Z. 2012. Research on Detection and Visualization of Underground Pipelines. In: The 2nd International Conference on Remote Sensing, Environment and Transportation
Engineering (RSETE), Nanjing, Jiangsu, China.
[15] Zhao, W., Tian, G., Forte, E., Pipan, M., Wang, Y., Li, X., Shi, Z., Liu, H., 2015. Advances in GPR data acquisition and analysis for archeology. Geophysical Journal International 202, 62-71.