Technique of fuzzy tuned stochastic scanpaths for robot vision
Tam metin
Şekil
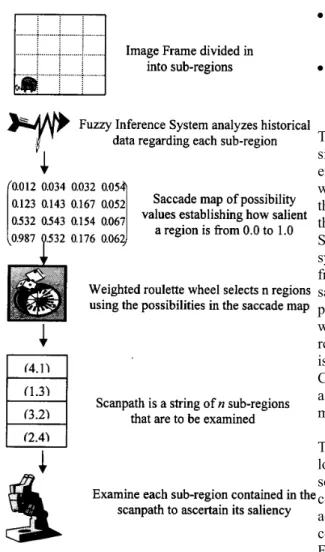
![Fig. 2. Images 3, 19, and 36 from a frame sequence which contains a yellow ball on a blue background [5]](https://thumb-eu.123doks.com/thumbv2/9libnet/4078839.58313/5.892.132.435.423.517/fig-images-frame-sequence-contains-yellow-ball-background.webp)
Benzer Belgeler
In this regard, introducing Mashhad as the second religious metropolis of the world by UNESCO and announcing it as the spiritual capital of the country, in addition to
Dünyadaki uzay üsleri aras›nda en ünlü olanlar›ndan biri de Avrupa Birli¤i ülkelerinin uzay çal›flmalar›n› yürüttü¤ü Avrupa Uzay Ajans› ESA’ya ait olan Frans›z
Carroll (1979), “kurumların sosyal sorumluluğu, belli bir zamanda toplumun kurumdan ekonomik, yasal, etik ve hayırsever beklentilerini kapsar” tanımından hareketle
frequently found to be significantly higher in the overweight + obesity group and this relationship con- tinued after evaluation using logistic regression
The turning range of the indicator to be selected must include the vertical region of the titration curve, not the horizontal region.. Thus, the color change
Previous selections were towards picturesque and neo-classic examples. Afterwards a trend towards modern architecture was seen up until previous year. Yet this modern examples
In this work, detection of abrupt changes in continuous-time linear stochastic systems and selection of the sampling interval to improve the detection performance are considered..
Dünyadaki odun hammaddesi üretiminde, kabuksuz yuvarlak odun üretimi 3.5 milyar m 3 olup endüstriyel odun ürünlerinden birinci sırada tomruk, ikinci sırada lif
