PAPER
A model based investigation of the period doubling behavior in
human steady-state visual evoked potentials
Yiğit Tuncel , Toygun Başaklar and Yusuf Ziya Ider1
Electrical and Electronics Engineering Department, Bilkent University, Ankara, Turkey
1 Author to whom any correspondence should be addressed.
E-mail:[email protected],[email protected]@ee.bilkent.edu.tr
Keywords: EEG, steady state visual evoked potential, SSVEP, cortex models, corticothalamic model, subharmonic, period doubling
Abstract
Objective. This study aims at investigating the potential mechanism of period doubling
(PD)
(subharmonic generation) in human steady-state visual evoked potentials (SSVEPs) by using a
mathematical model. Approach. Robinson’s Corticothalamic Model, which includes three main
neuronal populations
(cortical, thalamic reticular, and thalamic relay neurons) was employed. SSVEP
experiments were simulated using this model and dependence of PD behavior in relation to the values of
model parameters was investigated. The feedback loop in the model that is responsible for the generation
of subharmonic components was thus identified, and this loop was isolated from the rest of the model
and analyzed with a describing function approach. Main Results. It has been found in general, for a wide
range of parameter values, that if the excitation frequency or half of it is close to the native oscillation
frequency of the system, the native oscillation ceases to exist and oscillations at either the excitation
frequency or half of it are observed. This observation is in line with the experimental
findings except for
some discrepancies which are also discussed. The intrathalamic feedback loop is identified to be the
potential source of subharmonic oscillations. When isolated from the rest of the model and simulated by
itself, it has been found that this feedback loop can show a resonance phenomenon at the subharmonic
frequency. By deriving a set of equations based on the necessary conditions for a resonance
phenomenon, a semi-analytical method was developed by which one can predict the existence of
subharmonic generation for a given set of parameters and stimulus frequency. Significance. This study is
the
first model-based investigation of the mechanism of subharmonic oscillations. The proposed
semi-analytical method can replace extensive time and memory consuming parameter sweep studies.
1. Introduction
Steady-State Visual Evoked Potentials (SSVEPs) are oscillatory brain potentials elicited in the electroence-phalogram(EEG) in response to periodic light stimu-lation [1–5]. These responses are characterized as
oscillations at the stimulus frequency as well as its harmonics and subharmonics [2, 6, 7]. Particular
interest has been shown to understanding some of the nonlinear dynamics of the SSVEP responses, including harmonics generation, alpha entrainment to stimulus frequency and frequency mixing [2, 6, 8–12]. The
generation of subharmonics, on the other hand, has not received much attention.
We refer to the generation of thefirst subharmonic component as Period Doubling(PD) Phenomenon,
i.e. given aflickering stimulus with a frequency of f, we observe a strong and distinct component at f/2 in the EEG spectrum. This phenomenon has been observed in several experimental SSVEP studies for different frequency ranges. Herrmann’s findings indicated that subharmonic generation may occur for stimulation frequencies in 15–30 Hz range [6]. Crevier and
Meis-ter reported subharmonic components for stimulus frequencies between 30–70 Hz [13]. Tsoneva et al have
observed subharmonic generation in the 40–60 Hz sti-mulus frequency range[14]. In addition to these
stu-dies, in our previous work, our results showed subharmonic generation for the stimulus range of 15–42 Hz [15].
Despite many years of research in this field, mechanisms that explain the nonlinear characteristics RECEIVED
11 April 2019
REVISED
18 June 2019
ACCEPTED FOR PUBLICATION
26 June 2019
PUBLISHED
11 July 2019
of the SSVEP responses are still unresolved [8]. In
more recent years, modelling studies have started to emerge[16–18], that aim to explore and analyze such
mechanisms.
Spiegler et al have investigated[18] the photic
driv-ing effect (i.e. frequency entrainment) of a periodic light stimulus through a modified Zetterberg-Jansen model[19]. They drove the model with a rhythmic
input consisting of a train of pulses where each pulse is similar to that used by Jansen and Rit [19]. They
demonstrated many different nonlinear dynamics the model can produce, including chaos. Particularly, they investigated the effect of stimulus amplitude on the entrainment phenomenon and came up with various predictions. In this work, however, authors did not mention any subharmonics generated by the cortical model.
Robinson’s Corticothalamic Model, which has been shown to successfully predict various phenom-ena in the EEG, has been driven by Roberts and Robin-son with periodic input[17,20–22]. They tested the
model against Herrmann’s experimental findings [6]
and observed subharmonic components at the model output for stimulus frequencies in the 15–24 Hz inter-val which coincides with the experimental results. They have stated that alpha oscillations entrain to the stimulation frequency or itsfirst subharmonic if either of these fall in the alpha range. However, they have not discussed how and where in the model such behavior is generated.
Labecki et al have driven the neural mass model of Lopes da Silva et al[23] also with periodic input [16].
They observed subharmonic responses in the model output for stimulus frequencies(for sine wave input) between 17–21.5 Hz. They also showed that for sub-harmonic oscillations to occur, a feedback loop with at
least one nonlinear element is necessary in the mathe-matical model.
Considering all the previous work, one might argue that subharmonic components in SSVEP responses could be a focus of new experimental and theoretical studies. In this work, we aim to understand using a mathematical model where and how in the visual system such subharmonic components emerge. For this purpose, we employ Robinson’s Corticotha-lamic Model, analyze its PD behavior in response to a sinusoidal drive under different parameter configura-tions and also compare its predicconfigura-tions with our exper-imental findings [15]. We have identified the
intrathalamic feedback loop of the model as the possi-ble source of subharmonic components. Additionally, we have investigated, by nonlinear feedback theory, the possible generation mechanism of subharmonic oscillations in this feedback loop.
2. Materials and methods
2.1. Experimental data
The experimental data which is referred to and discussed in this study has been published in[15]. A
brief explanation of the experimental procedure is given in appendixAandfigure1shows the experimen-tally obtained power spectral density (PSD) versus stimulation frequency plots.
2.2. Computational model
In this work, we use a neuralfield model that had been proposed by Robinson et al to model cortico-thalamic dynamics [20–22]. This model includes three main
neuronal populations, cortical neurons(excitatory (e) and inhibitory i( )interneurons and implicitly pyrami-dal cells), thalamic reticular r( )neurons and thalamic Figure 1. Averaged two dimensional plots across all subjects(Channel Oz) for the experiments in [15]. In these plots, the stimulation
frequencies are placed on the horizontal axis and the PSD estimate of the response to each stimulus frequency is grayscale coded on the vertical axis. The left plot covers the stimulus frequencies from 15 Hz to 32 Hz and the right plot covers the stimulus frequencies from 28 Hz to 42 Hz. Horizontal dashed red lines visualize the alpha band(8–12 Hz interval). The dotted red lines are put for better demonstration of the trends in data. The lower limit of the colorbar is set to 0.1 to eliminate confusion due to background noise in spectrums. The upper limit is saturated at 0.5 for clear observation of subharmonic peaks.
relay ( )s neurons. In our experiments[15], we have
used a full visual field stimulus. This allows us to assume spatially uniform stimulation of the visual cortex, hence allowing us to model the entire visual cortex with a single neuronal population. With such assumption, we also omit the spatial dependence of the model and thus reduce it to a neural mass model. The explanation and formulation of model differential equations are given in appendixB.
For the sake of easier analysis and modification of the model equations, we also implemented the model in Simulink(The MathWorks, Inc., Natick, MA, USA) environment. For this purpose, differential operators
D ,a Dsrand Dg (see App. B) are converted to transfer
functions of the following forms:
D H s s s D H s s s D H s s 2 s 1 sr sr sr sr sr sr sr sr 2 2 2 2 2 ab a b ab a b a b a b g g g = + + + = + + + = + + a a g g ( ) ( ) ( ) ( ) ( ) ( )
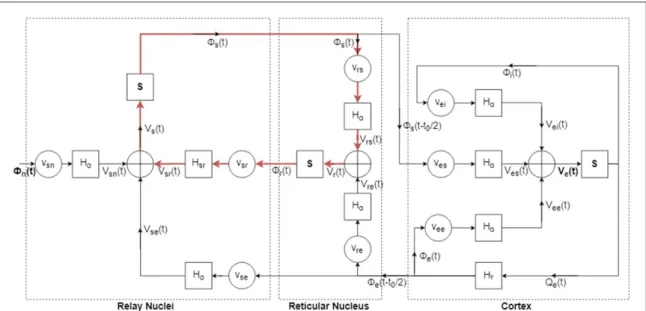
The model can be expressed as a block diagram as in figure2. Here, when the cortical circuit is examined, one can interpret that pyramidal cell population is in fact explicitly modeled and the interneuron popula-tions are implicitly modeled through synaptic strengths vei and v .ee That is to say, output of the
pyramidal cell populationS V t[ e( )]is scaled by gainsvei
andveeand then converted to contributions to mean
soma potential of the pyramidal cell population (Vei
andVee). Hence, we adopt Veas the main source of the
recorded scalp EEG which is thought to correspond to the mean membrane potential of the pyramidal cell population [24]. Simulink is set to solve the
model with a forward Euler integration scheme with dt=10-4s.
Since lateral geniculate nucleus of the thalamus acts as the relay station for sensory inputs coming to the brain[21] (hence the name relay nucleus in the
model), input to the model(fn)is given via the relay
nucleus. We model the input as background activity and stimulus superimposed:
t n n BG n stim f ( )=f +f
Here,fnBGdenotes the background activity. Generally, this activity is modeled as a DC plus a zero-mean Gaussian white noise. However, we believe the stimu-lus in our experiments would dominate the amount of noise in the background activity, so we only consider
n BG
f as a constant value.fnstimis simply a cosine at the
stimulation frequency with amplitude F In doingn. this, we make the assumption of ignoring the potential role of retinal dynamics in the experimentally observed PD phenomenon.
In earlier studies of this model, different values(or ranges) for model parameters were discussed [17,21,25,26]. In this study, these ranges were taken
into consideration during parameter assignments. In their 2012 study[17], Roberts and Robinson drove this
model with a sinusoidal input and shared a parameter set that would better resemble the features and trends in the experimental data of Herrmann [6]. In this
work, we took their parameter set as the starting point in our model analysis(i.e. as the default parameter set). We also undertook rather limited parameter sweep studies in which we considered the parameter ranges mentioned in the literature. We refrained from doing an extensive parameter sweep study, because with such a high order model(17 parameters) doing such a Figure 2. Representation of Robinson’s Corticothalamic Model as a block diagram. There are three main populations in the model: (i) Relay Nuclei (ii) Reticular Nucleus (iii) Cortex. Their contents are marked with dashed boxes. There are three types of blocks in the whole model:(i) gain blocks denoted withvab(ii) second order transfer functions denoted with H (iii) sigmoidal type nonlinear blocks denoted with S. Input to the model is given viafnwhile the output is taken from V .e Notice the red highlighted intrathalamic loop from which subharmonic oscillations seem to arise.
work requires substantial amount of computational power and time.
2.3. Describing function
A conventional way of analyzing the transfer char-acteristics of nonlinear components in nonlinear feed-back systems is describing function(DF) analysis. The DF in this context, relates the amplitudes and phases of the components in the output of the nonlinearity to those of the components in its input. For polynomial type nonlinearities, describing functions can be analy-tically found[27,28] but in our case the nonlinearity is
a shifted sigmoid. Also, utilizing describing function analysis requires the linear part of the system to behave as a sharp low pass filter that completely filters out higher order components. However, for many values of the reciprocal time constantsβ and α (and others), this may not be the case in the model. Therefore, we have adopted Fourier Transform method tofind the DFs. In this method, DFs are numerically computed by finding the Fourier coefficients in its output in relation to the input [28]. Calculating DFs for the
nonlinearities allows us to write loop equations and solve these for amplitudes and phases of the oscilla-tions in the system output by utilizing a numerical nonlinear system solver(fsolve in Matlab).
3. Results
3.1. Period doubling behavior in robinson’s corticothalamic model with default parameters We first reproduced the results of Roberts and Robinson’s study [17]. The default parameters used
are given in table1:
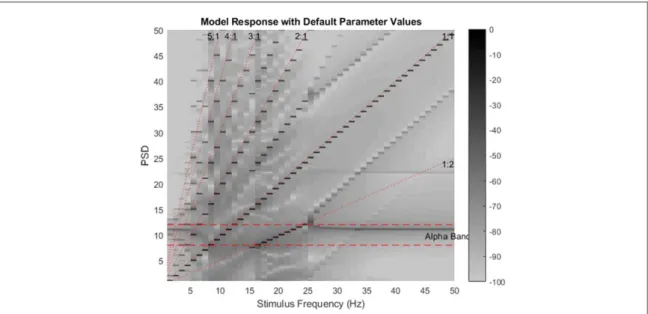
A two dimensional plot similar to which was used to visualize experimental results was formed from the model responses to stimulation frequencies in the 1–50 Hz interval (figure3). It can be seen that alpha
band power is concentrated at fa= ~11 Hz(model’s native oscillation frequency). Here it is obvious that, when driven with a sinusoidal input with an ampl-itude fnstim=2.8and biasfnBG=18,the model can generate subharmonics in the 15–25 Hz stimulus fre-quency region. We have also made the following observations (as also conjectured by Roberts and Robinson[17] regarding entrainment): from 0–5 Hz
we observe the natural oscillation of the system(alpha
oscillation) which is around fa = 11 Hz. Between 6–14 Hz, it appears that the native oscillation entrains to the excitation frequency. Between 15–25 Hz, the native oscillation entrains to half of the excitation fre-quency. Therefore, roughly speaking, 6–14 Hz range is the entrainment range in the sense that the native oscillation shifts to the excitation frequency or half of it whichever falls in this range.
3.2. Identification of the source of PD generation within the Robinson’s corticothalamic model We modified the gains of some feedback loops as follows:(i) we cut off cortical feedback connection by setting vre and vse (both separately and together) to
zero, or(ii) we cut off intrathalamic feedback connec-tion by setting vrsand vsr(both separately and together)
to zero, and observed thalamic and cortical outputsfs andf respectively. We found out that regardless ofe whether the cortical feedback connections(vreandvse)
are cut off or not, there is subharmonic generation at both outputs as long as the intrathalamic loop is maintained. This loop is highlighted in red infigure2. Therefore, we argued that these subharmonic oscilla-tions are generated in the intrathalamic feedback loop. As we experimented with the gains of the feedback loops, we also observed how the native oscillatory behavior of the system(alpha rhythm) is affected. By settingv ,sr v ,re vse to zero, the alpha oscillation is not
observed indicating that the cortex is by itself not sufficient to generate the alpha rhythm. Interestingly, in the absence of an intrathalamic feedback loop (vrs=0 and/or vsr=0), the alpha rhythm at the
system output vanishes. Furthermore, when vreandvse
are taken as zero, alpha oscillation is still observed. All these suggest that the alpha oscillation is also generated in the aforesaid intrathalamic loop.
3.3. Determination of the parameters that affect PD behavior
We then focused on the effects of different parameters of the intrathalamic feedback loop to subharmonic generation. The parameters in this loop are vsr, vrs,vsn,a b a, , sr, bsr, Qmax, s q f, , BGn and
.
n stim
f We neglected vsn as the same effect would be
observable whenfnstim andfnBGare varied instead, so we are left with 11 parameters. We used a coarse grid (4 to 10 values per parameter) for the parameter spaces for the sake of simplicity. While values for a parameter is being swept, other remaining parameters are set to default values(table1).
In figure 4, effects of four parameters , , , n stim sr nBG f a a f ( ) on subharmonic generation is
shown. The effects of the remaining 7 parameters are given in appendix C. From these four parameters,
n stim
f had been previously investigated in [17]. Same
results are again visible infigure4. In this case,fnstimis increased from 1 to 5. When it is set to 1, the sub-harmonic generation seems to occur at stimulation Table 1. The parameter set that we used to run the model and
initially make our observations from. These values are taken from [17] where the authors drove this model with a sinusoidal input and
shared a parameter set that would better resemble the features and trends in the experimental data of Herrmann[6].
vse=2.9,vsr= -0.57,vre=0.67,vrs=2.9,vsn=1,vee=1.3, vei= -2.9,ves=0.13 s s s s 80 1, 800 1, sr 10 1, sr 60 1, a= - b= - a = - b = - 100 e g = Qmax=250, s=3.3, q=15 18, 2.8 n BG n stim f = f =
Figure 3. The two dimensional plot of the model responses to stimulation frequencies from 1 to 50 Hz with parameter values chosen as in table1. In this plot, the stimulation frequencies are placed on the horizontal axis and the PSD estimate of the response to each stimulus frequency is grayscale coded on the vertical axis. Notice that unlike the experimental plots(figure1), this plot is in logarithmic
scale. It can be seen that the alpha band component is being entrained to fundamental components(1:1 line) in frequencies between 6–14 Hz, and then to subharmonic components (1:2 line) in frequencies between 15–25 Hz. At other frequencies (0–5 Hz and 25–50 Hz) the power at alpha frequency (∼11 Hz) can be seen as a horizontal gray line.
Figure 4. Effects of four parameters , sr, n , stim
n BG
a a f f
( )on subharmonic generation. In these plots, the stimulation frequencies are placed on the horizontal axis and the PSD estimate of the response to each stimulus frequency is grayscale coded on the vertical axis. Topmost row shows model responses forfnstim=1, 2, 3, 4, 5,second row fora =50, 80, 120, 150, 200,third row for
5, 10, 15, 20, sr
a = and bottommost row forfnBG=2.8, 10, 18, 25, 32.While these values are swept for the relevant parameter, the values for other parameters are selected as in table1.
frequencies between 20–25 Hz. As the value is increased to 5, the lower limit of this subharmonic generation interval decreases to 10, making the inter-val wider as 10–25 Hz. It is important to note thatfnstim
does not affect the alpha oscillation. Similar observa-tions can be made for the parametera.As a is varied from 50 to 200, the upper limit of the subharmonic frequency interval increases. However, with default values for other parameters alpha oscillation seems to cease as a is increased. With increasingasr,it can be
deduced that the subharmonic region shifts upwards while its width stays unaffected. However, at higher values(e.g. 15 or 20), it seems that many complex non-linear interactions occur, yielding a very crowded and unrealistic spectra. For fnBG, lower values affect the presence of both alpha oscillation and subharmonic components while higher values yield complicated spectra with little effect on the subharmonic interval.
The observations we made from the effects of chan-ging the 11 parameters individually, suggested us that the model is able to show very different subharmonic gen-eration intervals for different parameter sets. We then proceeded to change the values of parameters simulta-neously. Taking into consideration the individual effects of the parameters, we concluded not to include the input parametersfnstim and fnBG in this analysis because we believe that they do not reflect inherent properties of the visual system. Since we had observed that the effects of
vsr, vrsand Qmaxare weaker compared to the effects of
other parameters, we neglected these parameters as well. Thus, we decided to only consider the six parameters ( , ,a b asr, bsr, s and q) and keepv ,sr v ,rs Qmax,fnstim
and fnBG unchanged from their values in table 1. In short, we searched for different subharmonic generation intervals by changing the values of the parameters
, , sr, sr,
a b a b s and q simultaneously.
Three examples of very different subharmonic generation intervals obtained after such analysis are given infigure5. In thefirst plot, compared to the case with default parameter values, the subharmonic gen-eration interval broadens to 15–30 Hz. We have also observed an entrainment behavior similar to the case with default parameter values(figure3) except that the
entrainment range seems to be 8–15 Hz and the native oscillation frequency is 13 Hz. In the second and third plots also, different ranges of subharmonic generation are observed with different parameter sets. However, the second and third plots also have some dis-crepancies conflicting with the entrainment theory as we discuss in the Discussion section.
3.4. Mechanism of PD generation within the intrathalamic loop
To further investigate the mechanism of subharmonic generation in the model, we isolated the intrathalamic Figure 5. Model responses with very different subharmonic generation intervals for different parameter sets. In these plots, the
stimulation frequencies are placed on the horizontal axis and the PSD estimate of the response to each stimulus frequency is grayscale coded on the vertical axis. Parameters are set as follows(values for the remaining parameters are selected as in table1): In the leftmost
plota =150,b =450,a =sr 15,b =sr 50,q =15,s =3.3,in the middle plota =120,b =300,a =sr 20,b =sr 200, 15,
q = s =3.3and in the rightmost plota =150,b =800,a =sr 10,b =sr 200,q =15,s =2.5.
Figure 6. The isolated intrathalamic loop consists of two nonlinear elements(S), two gain elements (vrsand vsr) and two second order
low passfilters (Haand Hsr). The loop is driven with a signal of the form DC+Bcos(wt+f).The bold numbers 1 to 7 are the
loop from the rest of the circuit (figure 6). The
‘isolated’ intrathalamic loop consists of two nonlinear elements(both of the shifted sigmoidal type), two gain elements and two second order low passfilters. For such feedback systems, it is known that constant amplitude oscillations occur if two conditions are satisfied at the frequency of interest: (i) loop gain should be unity(ii) total phase change across the loop should be 0 radians (or 2 p radians wherek k=0, 1, 2,¼). Given that the system is driven with a signal of the form DC+Bcos(wt+f),we may assume the following signal at location 1 (see bold numbers onfigure6) in the loop:
DC B t A t 1: cos cos 2 2 B A 1 1 w f 1 1 1 w f + + + ⎜⎛ + ⎟ ⎝ ⎞⎠ ( ) ( )
Here, the presence of A1cos
(
w2t+fA1)
assumes that a subharmonic oscillation is obtained through the loop. We then need to relate the signal at location 1 to the one at location 2. This is where describing function theory comes in handy, as it helps us to continue forming the loop equations as follows(also here we translate the signal to phasor representation, knowing that each component is at a different frequency). Below, each row of the vector corresponds to compo-nents at different frequencies (DC, stimulation fre-quency and subharmonic frefre-quency from top to bottom): DC N B e N A e N 2: 0 2 3 j j 1 1 1 1 1 1 B A 1 1 w w f f ⎜ ⎟ ⎡ ⎣ ⎢ ⎢ ⎢ ⎢ ⎛⎝ ⎞⎠ ⎤ ⎦ ⎥ ⎥ ⎥ ⎥ ( ) ( ) ( )Here N1stands for the describing function of thefirst
nonlinear block in the loop. We then proceed with writing the signals at each location:
DC N v B e N v A e N v 3: 0 2 4 rs j rs j rs 1 1 1 1 1 1 B A 1 1 w w f f ⎜ ⎟ ⎡ ⎣ ⎢ ⎢ ⎢ ⎢ ⎛⎝ ⎞⎠ ⎤ ⎦ ⎥ ⎥ ⎥ ⎥ ( ) ( ) ( ) DC N v H B e N v H A e N w v H 4: 0 0 2 2 5 rs j rs j rs 1 1 1 1 1 1 B A 1 1 w w w a f a f a ⎜ ⎟ ⎜ ⎟ ⎡ ⎣ ⎢ ⎢ ⎢ ⎢ ⎛⎝ ⎞⎠ ⎛⎝ ⎞⎠ ⎤ ⎦ ⎥ ⎥ ⎥ ⎥ ( ) ( ) ( ) ( ) ( ) DC N v H N B e N v H N A e N w v H N 5: 0 0 0 2 2 2 6 rs j rs j rs 1 1 2 1 1 2 1 1 2 B A 1 1 w w w w w a f a f a ⎜ ⎟ ⎜ ⎟ ⎜ ⎟ ⎡ ⎣ ⎢ ⎢ ⎢ ⎢ ⎛⎝ ⎞⎠ ⎛⎝ ⎞⎠ ⎛⎝ ⎞⎠ ⎤ ⎦ ⎥ ⎥ ⎥ ⎥ ( ) ( ) ( ) ( ) ( ) ( ) ( ) DC N v H N v B e N v H N v A e N v H N v 6: 0 0 0 2 2 2 7 rs sr j rs sr j rs sr 1 1 2 1 1 2 1 1 2 B A 1 1 w w w w w w a f a f a ⎜ ⎟ ⎜ ⎟ ⎜ ⎟ ⎡ ⎣ ⎢ ⎢ ⎢ ⎢ ⎛⎝ ⎞⎠ ⎛⎝ ⎞⎠ ⎛⎝ ⎞⎠ ⎤ ⎦ ⎥ ⎥ ⎥ ⎥ ( ) ( ) ( ) ( ) ( ) ( ) ( ) DC N v H N v H B e N v H N v H A e N v H N v H 7: 0 0 0 0 2 2 2 2 8 rs sr sr j rs sr sr j rs sr sr 1 1 2 1 1 2 1 1 2 B A 1 1 w w w w w w w w a f a f a ⎜ ⎟ ⎜ ⎟ ⎜ ⎟ ⎜ ⎟ ⎡ ⎣ ⎢ ⎢ ⎢ ⎢ ⎛⎝ ⎞⎠ ⎛⎝ ⎠⎞ ⎛⎝ ⎞⎠ ⎛⎝ ⎞⎠ ⎤ ⎦ ⎥ ⎥ ⎥ ⎥ ( ) ( ) ( ) ( ) ( ) ( ) ( ) ( ) ( ) Then we complete the loop(location 7 → location 1) and obtain 3 equation(2 are complex):
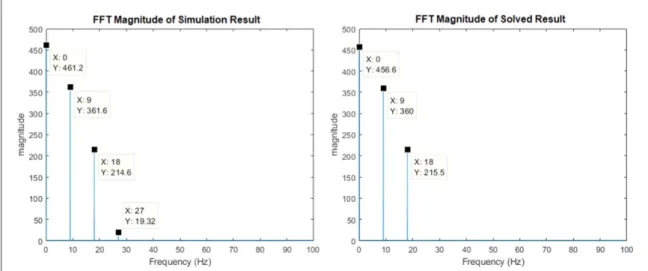
DC N 0 v H 0 N 0 v H 0 DC DC 9 rs sr sr 1 1( ) a( ) 2( ) ( )+ = 1 ( ) B e N v H N v H Be B e 10 j rs sr sr j j 1 1 2 1 B B 1 1 w w w w + = f a f f ( ) ( ) ( ) ( ) ( ) A e N v H N v H A e 2 2 2 2 11 j rs sr sr j 1 1 2 1 A A 1 1 w w w w = f a f ⎜ ⎟ ⎜ ⎟ ⎜ ⎟ ⎜ ⎟ ⎛ ⎝ ⎞⎠ ⎛⎝ ⎞⎠ ⎛⎝ ⎞⎠ ⎛⎝ ⎞⎠ ( ) For given DC, B, f andw,the above equation(5 real equations when the complex ones are separated as real and imaginary) can be solved for DC A B1, 1, 1, fA1 and fB1. The phase component f can be selected arbitrarily as it only depends on the selection of the time origin. As shown in the second plot offigure7for a parameter set of DC=30, B=2.8, f = 0 and
18 Hz,
w = we obtained DC1=456.6, A1=360, B1=215.5. The significantly non-zero value of A1
demonstrates that for the given input parameter set, a first subharmonic occurs. The first plot in figure 7
shows the results of simulation of the model shown in figure 6 for the same input parameter set. It is observed that using simulation, very close values for DC1, A1, B1were obtained. This means that, we are
able to judge, without simulating the model, if a parameter set will generate subharmonic oscillations or not.
4. Discussion and conclusion
Period doubling in SSVEP experiments have been consistently observed across different studies [2, 6,
13–15]. The occurrence of period doubling has been
speculated to be by‘entrainment’ of intrinsic brain oscillations to half of the external stimulation fre-quency[14,16,17,29]. Tsoneva et al define the term
entrainment as the synchronization of naturally ongoing oscillations to an external force[14]. They
have stated that the subharmonic components observed in their experiments, where they have used 40–60 Hz stimulation, are due to beta band (20–30 Hz) synchronization [14]. Similarly, Labecki
et al describe entrainment as‘synchronization of two or more independent oscillators with differing natural frequencies, due to their coupling’ [16]. In their study,
they have applied periodic input to the neural mass model of Lopes da Silva et al [23] and have related
subharmonic components to the entrainment of the resonant frequency of the model to half of the excitation frequency [16]. Roberts and Robinson
define this term as ‘reduction of ongoing activity in favor of activity phase-locked to the drive, at frequen-cies harmonically related to the drive frequency’ in their study where they have driven Robinson’s corti-cothalamic model with periodic input[17]. They have
stated that the alpha rhythm(the native oscillation of the model) is entrained to the drive frequency and its subharmonics[17]. However, these studies have not
discussed the mechanism of entrainment. The closest mechanistic explanation of entrainment is given in the study of Notbohm et al [29]. They have devised a
method to differentiate between whether an SSVEP is a superposition of event related potentials(i.e. super-position of the responses to each of theflashes of a square wave stimulation) or whether it is the entrain-ment of an intrinsic oscillator to the extrinsic driving stimulation. Comparing the phase synchrony between output and input for the cases of periodic stimulation and jittered periodic stimulation they have shown that SSVEPs are entrained-intrinsic oscillations if the driv-ing source is strong and close in frequency. They have also shown that for relatively weak and relatively off-intrinsic-frequency excitation, the internal oscillator may slip at times and entrainment is not fully onset.
In this study, we have investigated the possible generation mechanism of the subharmonic oscilla-tions using a corticothalamic model by Robinson [17,20–22]. By scrutinizing the model, we have shown
that the observed PD behavior has its origins at the intrathalamic feedback loop. Furthermore, we have determined, by nonlinear feedback theory, the condi-tions necessary for the occurrence of subharmonic oscillations, and thus have shed light to the mech-anism of subharmonic generation. It may be asked if this mechanism is an explanation for a possible entrainment phenomenon. Although we do not refer to entrainment in explaining the mechanism of
subharmonic generation, nevertheless we do not con-tradict with it when the end results are considered.
We have also observed that the model is able to show very different subharmonic generation intervals for dif-ferent parameter sets(figures3 and5). However, this
sometimes results in a different native oscillation fre-quency of the model. We predict that this shift is due to similar generation mechanisms between alpha and sub-harmonic oscillations, possibly in the intrathalamic loop. Given our previous experimental results [15]
shown infigure1and also Herrmann’s experimental
results [6], it is observed that if subharmonic
fre-quency is near 8–15 Hz (i.e. when the stimulus fre-quency range is 15–30 Hz), alpha oscillation in the brain is facilitated towards this subharmonic fre-quency. When the stimulus frequency is outside the 15–30 Hz region, in our experimental studies, both alpha and subharmonic oscillations are observed which suggest that alpha entrainment does not occur and thus subharmonic generation has a different mechanism than alpha entrainment. However, in the simulations of the corticothalamic model, it is observed that when the subharmonic frequency is out-side the alpha range, subharmonic oscillations cease to exist, and only alpha oscillations are observed. Thus, the model generates subharmonic oscillations only through the alleged‘alpha entrainment’.
We have also observed other discrepancies between model predictions and experimental results. As seen in the second plot offigure5, as mentioned above, for a given parameter set, native oscillation fre-quency is increased together with the increase in the subharmonic oscillation range. However, in this case, the observed native oscillation frequency(18 Hz) is no longer in the human alpha rhythm range. In the third plot of figure 5, for a specific parameter set, we
observed that the system showed PD behavior even Figure 7. Plots showing compliance between simulation results and results from the equations. For any given DC,B, fand ,w
equations(9)–(11) (5 real equations when the complex ones are separated as real and imaginary) can be solved for the subharmonic
magnitude and phase at any point in the loop. In this example the values are chosen as: DC=30,B=2.8,f =0andw =18Hz. Notice that the effect of the 27 Hz(3 f /2 ) component is not considered while the equations were formed (due to sharp filtering characteristic of Hsr), hence the small differences between two results. Phases of the same components in the plots also show similar
though it did not have any native oscillation. This con-tradicts with our previous observation that sub-harmonic oscillations are generated via entrainment of the alpha rhythm. We were not able tofind a para-meter set that would broaden the subharmonic region while keeping the native oscillation frequency in the normal human alpha rhythm range (native oscilla-tions either shifted up above the human alpha rhythm range or totally vanished). To clarify the discrepancies between the model and the empirical observations, we think future intracranial recordings taken directly from subcortical structures under a periodic light sti-mulus will be instrumental.
In general, to further explore features of the PD generation by the corticothalamic model, a thorough parametric sweep study is necessary. However, such a study would be extremely memory and time consum-ing considerconsum-ing the number of parameters in the model and that a single simulation for a given para-meter set takes 100 s in Simulink. We have provided a possible approach for speeding up such a sweep study by reducing the entire model tofive nonlinear alge-braic equations the solution of which shows whether subharmonic generation will occur or not. Therefore, instead of solving the system partial differential equations, which takes 100 s of simulation time with dt=10-4s in Simulink for a given parameter set, these algebraic equations can be utilized as a fast semi-analytic parameter sweep modality. As a concluding remark, we strongly believe that subharmonic oscilla-tions are important features of SSVEP responses, and that any modelling study regarding SSVEP responses should consider the presence of this empirically ver-ified nonlinear behavior in the model output.
Acknowledgments
This work was supported by The Scientific and Technological Research Council of Turkey (TUBI-TAK) under Grant 116E153.
Appendix A
Seven subjects were presented a very accurate(nearly zero distortion) sinusoidal light emitted by two high gloss LEDs placed in a Do-It-Yourself cardboard Virtual Reality headset. The stimulation frequency range was 15–42 Hz, divided into two separate ranges, 15–32 and 28–42 Hz, for shorter sessions (so that experiments induce less visual fatigue). EEG was recorded at 1kS/s from six (O1, Oz, O2, Pz, P3, P4) electrodes all referenced to‘FCz’. A two dimensional plot was generated for better observation of the trends (fundamental, harmonic and subharmonic compo-nents) in the data. In this plot, the stimulation frequencies are placed on the horizontal axis and the power spectral density(PSD) estimate of the response to each stimulus frequency are grayscale coded on the
vertical axis. More detailed explanations are available in the relevant paper[15].
Apart from statistical findings, we had observed subharmonic generation in the whole stimulus fre-quency range, 15–42 Hz. This is very clearly obser-vable from the two dimensional plots generated for both 15–32 Hz and 28–42 Hz experiments (figure1).
In bothfigures, lines on which the subharmonic components line up(labeled as 1:2 line in the figures) are clearly visible as well as the lines on which the fun-damental and harmonic components reside(labeled as 1:1 and 2:1 lines respectively). A very important observation to make here is that subharmonic respon-ses are more easily noticeable in the right-hand plot than in the left-hand plot infigure1because the sub-harmonic frequencies in the right-hand one do not fall in the alpha band.
Appendix B
Below we provide an explanation of the model formulations keeping the notation in the original work mostly unchanged[20–22].
In this model, each population is modeled by two main relations: (i) a linear operator Dab=
1 d dt d dt 1 1 1 ab ab ab ab 2 2 + + +
a b
(
a b)
that relates the meanpostsynaptic potentialVabof population a to the mean
afferent firing rate f coming from the presynapticb population b by D Vab ab(r,t)=vabfb(r,t -tab). Here vab denotes the synaptic connection strength
between populations a and b, tab denotes the mean
axonal delay between populations a and b andbab,aab
denote the reciprocal rise and fall times of the mem-brane potential of population a due to input coming from population b,(ii) a nonlinear shifted sigmoidal
function Qa S Va Q
1 exp Va
max
= =
+
(
- s-q)
[ ] that relates the
meanfiring rate Qaof population a to the same
popula-tion’s mean membrane potential Va=
å
bV .ab Here,Qmaxdenotes the maximumfiring rate, q is the mean
threshold voltage for the population and s denotes the variance of this threshold value in the population.
Originally, the model regarded mean afferent fir-ing rates f asa fields and these were governed by a damped wave equation with Qa= [ ] as the source:S Va
r r t t r t S V t 1 2 1 , , B.1 a a a a a 2 2 2 2 2 g g f ¶ ¶ + ¶ ¶ + - = ⎡ ⎣ ⎢ ⎤ ⎦ ⎥ ( ) [ ( )] ( )
where g is the reciprocal delay due to axonala conduction and ra is the axon length. However, in
reducing the model to a neural mass model, we omitted the 2 terms(since we assume there is no
positional dependence in the cortex we also drop the r argument) for all populations a=e i r s, , , . For populations other than a=e (i.e. for inhibitory
interneurons and thalamic populations), axonal con-duction delay 1/gais taken to be zero, yielding
t S V t B.2 a a f( )= [ ( )] ( ) for a=i r s, , d dt d dt t S V t 1 2 1 B.3 a a a a 2 2 2 g + g + f = ⎡ ⎣ ⎢ ⎤ ⎦ ⎥ ( ) [ ( )] ( ) for a=e.
Note that the operator in 2.3 is different from the two main relations explained above. Specifically, this does not convertfiring rate to potential or vice versa, it is only introducing a delay to the excitatory population dynamics due to longer ranged axonal connections of the excitatory neurons.
The authors made further assumptions regarding intrathalamic and intracortical connectivities [17]:
they took all bab=b a, ab=a (hence Dab=Da
except for the intrathalamicbsrandasrvalues(hence
Dsr¹Da) due to slower dynamics, and they took
Ve=Vidue to random intracortical connectivity.
Given above assumptions and derivations, the model equations are:
Contribution byfiring rate coming from sensory population (fn) to mean membrane potential of tha-lamic relay populationV :sn
D V ta sn( )=vsn nf( )t (B.4) Contribution by firing rate coming from thalamic reticular cell population (fr) to mean membrane potential of thalamic relay populationV :sr
D V tsr sr( )=vsr rf( )t (B.5) Contribution by firing rate coming from excitatory cortical interneurons(fe) to mean membrane poten-tial of thalamic relay populationV :se
D V t v t t 2 B.6 se = se ef - 0 a ⎜⎛ ⎟ ⎝ ⎞⎠ ( ) ( )
Mean membrane potential of thalamic relay popula-tionV :s
V ts( )=V tsn( )+V tsr( )+V tse( ) (B.7) Contribution by firing rate coming from excitatory cortical interneurons(fe) to mean membrane poten-tial of thalamic reticular population V :re
D V t v t t 2 B.8 re = re ef - 0 a ⎜⎛ ⎟ ⎝ ⎞⎠ ( ) ( )
Contribution by firing rate coming from thalamic relay cell population(fs) to mean membrane potential of thalamic reticular population V :rs
D V ta rs( )=vrs sf( )t (B.9) Mean membrane potential of thalamic reticular popu-lationV :r
V tr( )=V tre( )+V trs( ) (B.10) Contribution by firing rate coming from excitatory cortical interneurons(fe) to mean membrane poten-tial of excitatory cortical interneuron population V :ee
D V ta ee( )=vee ef( )t (B.11) Contribution byfiring rate coming from inhibitory cortical interneurons(fi) to mean membrane poten-tial of excitatory cortical interneuron populationV :ei
D V ta ei( )=veifi( )t (B.12) Contribution by firing rate coming from thalamic relay cell population(fs) to mean membrane potential of excitatory cortical interneuron population V :es
D V t v t t 2 B.13 es = es sf - 0 a ⎜⎛ ⎟ ⎝ ⎞⎠ ( ) ( )
Mean membrane potential of excitatory cortical inter-neuron populationV :e
V te( )=V tee( )+V tei( )+V tes( ) (B.14) Mean afferent firing rate f of the thalamic relays population with a mean membrane potential ofV :s
S V t B.15
s s
f = [ ( )] ( )
Mean afferentfiring rate f of the thalamic reticularr population with a mean membrane potential ofV :r
S V t B.16
r r
f = [ ( )] ( )
Mean afferentfiring ratef of the inhibitory corticali interneuron population with a mean membrane potential of Vi =V :e
S V t S V t B.17
i i e
f = [ ( )] = [ ( )] ( )
Mean afferentfiring rate f of the excitatory corticale interneuron population with a mean membrane potential ofV :e d dt d dt t S V t 1 2 1 B.18 e e e e 2 2 2 g + g + f = ⎡ ⎣ ⎢ ⎛ ⎝ ⎜ ⎞⎠⎟ ⎤ ⎦ ⎥ ( ) [ ( )] ( )
Appendix C
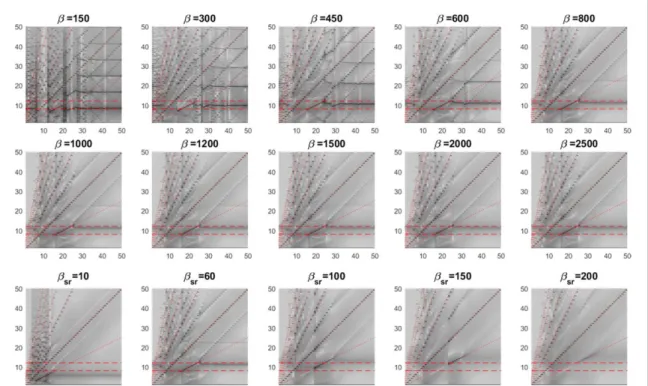
In figure C1, effects of the remaining seven (v vsr, rs, b b, sr, Qmax, s q, ) different parameters on subharmonic generation are shown. In all these plots, default values are used for parameters other than the swept parameter. As b is increased from 150 to 2000, subharmonic regime tends to slowly shift from 10–20 Hz to 15–25 Hz, keeping its width pretty much unchanged. The alpha oscillation frequency shifts from∼8 Hz to ∼12 Hz as b is increased (power at alpha components seems to drop as is b increased). For lower values of b the spectrum becomes very, crowded and complex possibly owing to many non-linear interactions taking effect. For valuesb >800, the spectrum remains largely unaffected(only change seems to be the decreasing power at alpha band) from increasing b. As bsr is varied from 10 to 200, the
subharmonic regime shifts upwards(i.e. 5–15 Hz to 25–35 Hz) with decreasing power at this regime (at
200,
sr
b = the subharmonic components are barely distinguishable from background). The native oscilla-tion frequency (fa) also shifts upwards with the
subharmonic regime, going outside the alpha band. The effects of increasingQmax is not as impactful as
other parameters. The position of the subharmonic regime is unaffected, while its width is barely affected at the upper limit(the interval changed from 15–24 Hz to 15–25 Hz). The power of the alpha oscillation seems to increase asQmaxincreases with its frequency fairly
unaffected. s is arguably the most influential para-meter on the subharmonic regime. For lower values (s =2, 2.5) , the spectrum is utterly cluttered, with lots of nonlinear components including many higher order subharmonics. For higher values of ,s both the subharmonic regime and alpha oscillation vanish, only leaving the fundamental and harmonic components in the spectrum. q significantly affects the width of the
subharmonic regime. As it is varied from 10 to 25, subharmonic regimefirst extends from the upper limit then from the lower limit (at θ=20 the width is doubled). After q =20, the regime tends to shift downwards with vanishing power at alpha oscillation. For vrs=0.2,subharmonic regime is inexistent. For increasing vrsvalues, the width of the regime is subtly
affected at the upper limit, but the alpha oscillation frequency shifts upwards, from∼10 Hz to ∼12 Hz. Higher values for v ,sr kill off both the subharmonic
components and the alpha oscillation(as expected due to negative feedback). At lower values, subharmonic regime seems to be faintly affected by vsr while alpha
oscillation seems to cease as vsr is increased from 0.2
to 1.5.
Figure C1. Effects of seven(v vsr, rs, b b, sr, Qmax, s q) different parameters on subharmonic generation are shown. In these plots,, the stimulation frequencies are placed on the horizontal axis and the PSD estimate of the response to each stimulus frequency is grayscale coded on the vertical axis. Two topmost rows show model responses forb =150,300, 450, 600, 800, 1000, 1200, 1500, 2000, 2500 third row forb =sr 10,60, 100, 150, 200, fourth row forQmax=100,200, 250, 300, 400 ,fifth row for
2, 2.5, 3.3, 4, 5,
s = fifth row forq =10,15, 20, 25, sixth row for vrs=0.2,0.6, 1.5, 2.9, 4, and bottommost row for vsr=0.2, 0.57, 1.5, 3, 5. While these values are swept for the relevant parameter, the values for other parameters are selected as in table1.
ORCID iDs
Yiğit Tuncel https://orcid.org/0000-0001-5943-0230
Toygun Başaklar https: //orcid.org/0000-0002-9312-236X
Yusuf Ziya Ider
https://orcid.org/0000-0002-1961-6804
References
[1] Regan D 1966 Some characteristics of average steady-state and transient responses evoked by modulated light
Electroencephalogr. Clin. Neurophysiol.20 238–48
[2] Regan D 1989 Human Brain Electrophysiology: Evoked Potentials and Evoked Magnetic Fields in Science and Medicine (New York: Elsevier)
[3] Yin E, Zhou Z, Jiang J, Yu Y and Hu D 2015 A dynamically optimized SSVEP brain–computer interface (BCI) Speller IEEE Trans. Biomed. Eng.62 1447–56
[4] Yin E, Zeyl T, Saab R, Chau T, Hu D and Zhou Z 2015 A hybrid brain–computer interface based on the fusion of P300 and SSVEP scores IEEE Trans. Neural Syst. Rehabil. Eng.23 693–701
[5] Zhang Y, Yin E, Li F, Zhang Y, Tanaka T, Zhao Q, Cui Y, Xu P, Yao D and Guo D 2018 Two-stage frequency recognition method based on correlated component analysis for SSVEP-based BCI IEEE Trans. Neural Syst. Rehabil. Eng.26 1314–23
[6] Herrmann C S 2001 Human EEG responses to 1–100 Hz flicker: resonance phenomena in visual cortex and their potential correlation to cognitive phenomena Experimental Brain Research137 346–53
[7] Nunez P L and Cutillo B A 1995 Neocortical Dynamics and Human EEG Rhythms(New York: Oxford University Press) [8] Vialatte F-B, Maurice M, Dauwels J and Cichocki A 2010
Steady-state visually evoked potentials: Focus on essential paradigms and future perspectives Prog. Neurobiol.90 418–38
[9] Norcia A M, Appelbaum L G, Ales J M, Cottereau B R and Rossion B 2015 The steady-state visual evoked potential in vision research: a review Journal of Vision15 4
[10] Rager G and Singer W 1998 The response of cat visual cortex to flicker stimuli of variable frequency European Journal of Neuroscience10 1856–77
[11] Tweel L H and Spekreijse H 1969 Signal transport and rectification in the human evoked-response system Ann. N.Y. Acad. Sci.156 678–95
[12] Townsend R, Lubin A and Naitoh P 1975 Stabilization of alpha frequency by sinusoidally modulated light Electroencephalogr. Clin. Neurophysiol.39 515–8
[13] Crevier D W and Markus M 1998 Synchronous period-doubling inflicker vision of salamander and man J. Neurophysiol.79 1869–78
[14] Tsoneva T, Garcia-Molina G and Desain P 2015 Neural dynamics during repetitive visual stimulation J. Neural Eng.12 066017
[15] Tuncel Y, Başaklar T and Ider Y Z 2018 Period doubling behavior in human steady state visual evoked potentials Biomedical Physics & Engineering Express4 025024
[16] Labecki M, Kus R, Brzozowska A, Stacewicz T,
Bhattacharya B S and Suffczynski P 2016 Nonlinear origin of SSVEP spectra a combined experimental and modeling study Front. Comput. Neurosci.10 129
[17] Roberts J A and Robinson P A 2012 Quantitative theory of driven nonlinear brain dynamics NeuroImage62 1947–55
[18] Spiegler A 2011 Dynamics of Biologically Informed Neural Mass Models of The Brain(Ilmenau: Univ.-Verl.)
[19] Jansen B H and Rit V G 1995 Electroencephalogram and visual evoked potential generation in a mathematical model of coupled cortical columns Biol. Cybern.73 357–66
[20] Robinson P A, Loxley P N, O’Connor S C and Rennie C J 2001 Modal analysis of corticothalamic dynamics,
electroencephalographic spectra, and evoked potentials Phys. Rev. E63 041909
[21] Robinson P A, Rennie C J and Rowe D L 2002 Dynamics of large-scale brain activity in normal arousal states and epileptic seizures Phys. Rev. E65 041924
[22] Rennie C J, Robinson P A and Wright J J 2002 Unified neurophysical model of EEG spectra and evoked potentials Biol. Cybern.86 457–71
[23] Lopes da Silva F H, Hoeks A, Smits H and Zetterberg L H 1974 Model of brain rhythmic activity Kybernetik15 27–37
[24] Lopes da Silva F H and Leeuwen W S V 1977 The cortical source of the alpha rhythm Neurosci. Lett.6 237–41
[25] Robinson P, Rennie C, Rowe D and Oconnor S 2004 Estimation of multiscale neurophysiologic parameters by electroencephalographic means Human Brain Mapping23 53–72
[26] Breakspear M, Roberts J A, Terry J R, Rodrigues S, Mahant N and Robinson P A 2005 A unifying explanation of primary generalized seizures through nonlinear brain modeling and bifurcation analysis Cerebral Cortex16 1296–313
[27] West J C and Douce J L 1955 The mechanism of sub-harmonic generation in a feedback system Proceedings of the IEE - Part B: Radio and Electronic Engineering102 569–74
[28] Gelb A and Earl V V W 1968 Multiple-Input Describing Functions and Nonlinear System Design(New York: McGraw-Hill)
[29] Notbohm A, Kurths J and Herrmann C S 2016 Modification of brain oscillations via rhythmic light stimulation provides evidence for entrainment but not for superposition of event-related responses Frontiers in Human Neuroscience10
![Figure 1. Averaged two dimensional plots across all subjects (Channel Oz) for the experiments in [ 15 ]](https://thumb-eu.123doks.com/thumbv2/9libnet/5881514.121425/2.892.182.828.92.352/figure-averaged-dimensional-plots-subjects-channel-oz-experiments.webp)