©BEYKENT UNIVERSITY
DETERMINING THE SIZE OF LINEAR
STOCKPILE FOR THE AFŞİN - ELBİSTAN (B)
POWER STATION (TURKEY)
Suphi URAL
Çukurova University, Department of Mining Engineering, Adana, Türkiye, [email protected]
ABSTRACT
The aim of this study is to show how to estimate optimum size of a linear coal stockpile for the Afşin - Elbistan (B) power station using geostatistical modeling techniques. After a description of the geology of the area a geostatistical study based on 2968 core samples of 193 drill holes is presented. The coal samples present a symmetric frequency distribution. Experimental variograms representing three main directions - strike plunge, cross-dip and downdip directions - are calculated and a simple spherical-type model is fitted to the variograms. The model parameters are validated. Storages capacities for buffering and homogenisation are estimated taking into account of longer operation standstill of the Çöllolar mine and daily fluctuations of quality parameters. In order to estimate the storage capacity of stockpile and number of stacking layers, block variance of varies size blocks are calculated utilising F chart. Finally, numbers and dimensions of prismatic type linear stockpile bunkers are determined.
Key Words: Afşin-Elbistan, geostatistics, coal, stock pile, block variance
ÖZET
Bu çalışmanın amacı, jeoistatistiksel modelleme teknikleri kullanılarak bir kömür stok sahasının optimum boyutlarının nasıl kestirilebileceğini göstermektir. Çalışmada, Afşin-Elbistan (B) termik santralinde, lineer bir kömür stok sahasının stoklama kapasitesi ve boyutlandırılmasına ilişkin olarak yapılan çalışmalar anlatılmıştır. Bölgenin jeolojik yapısı tanıtıldıktan sonra, 193 adet sondaj kuyusundan sağlanan 2968 adet karot numunesine ilişkin veriler esas alınarak sahanın jeoistatistik modeli oluşturulmuştur. Üç ana yönde de deneysel variogramlar ve bu variogramlara uygun modeller seçilmiştir. Çöllolar maden işletmesinde ortaya çıkabilecek uzun süreli duruşlar, kömür harmanlama gerekleri ve kalite kontrolüne ilişkin kısıtlarda
dikkate alınarak, stok sahasının kapasitesi kestirilmiştir. Bu hesaplamalarda, farklı büyüklüklere sahip blokların varyansları F kartları kullanılarak hesaplanmıştır. Son olarak stok sahasındaki bunker sayıları hesaplanmış ve bunlar boyutlandırılmıştır.
Anahtar kelimeler: Afşin-Elbistan, jeoistatistik, kömür ,stok sahası , blok
varyansı
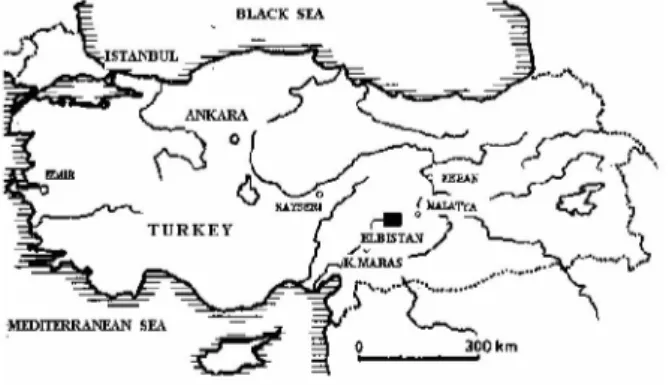
The targets of the mining-technical planning are to guarantee that the power station operations will have to be stopped at no time due to lack of fuel, fluctuations with regard to volume and quality of the product should be balanced and the total calorific value of mining field should be used as fully as possible by blending the coal. Stockpile with its capacity for long-term low frequency quality variation filtering has been widely accepted as a key method of raw coal homogenization. It has dual role within the raw coal preparation system, being a buffer storage unit and capability for homogenization of raw coal if properly designed and operated. The purpose of the present paper is to estimate the size of linear stockpile for the Afşin - Elbistan (B) power station. The Afşin-Elbistan lignite deposit with its 3.4 billion metric tons of reserve is the biggest lignite basin and one of the most important resources for electrical energy production in Turkey [10]. The Elbistan lignite is best suited to use in thermal power generation and are capable of supplying 16 x 340 MW power stations. The lignite deposit is located north of Elbistan, Kahramanmaras Province, in southeast Turkey (Figure 1). The Çöllolar mining field is the second open cast mine to feed Afsin-Elbistan (B) power station with the installed capacity of 1376 MW. Afsin-Elbistan (A) power station has been under operation since 1984 [11].
1. INTRODUCTION
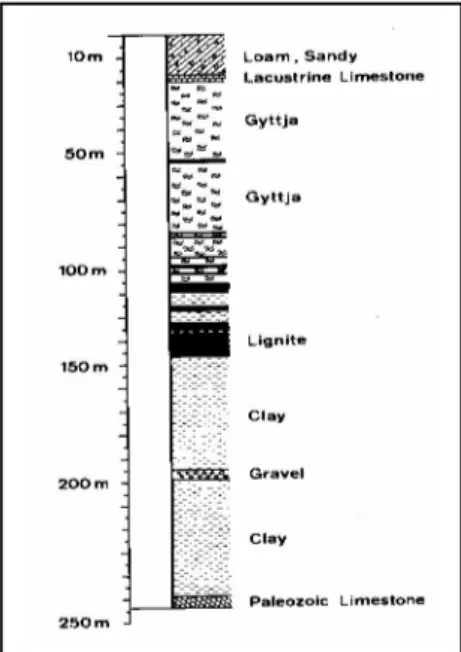
The Elbistan basin encompasses an area of 900km , and its centre lies about 1150m above mean sea level. The sedimentation took place mainly in the upper Pliocene period. The Collolar sub-basin of the Afsin-Elbistan basin is a multi-layer lignite deposit with associated clays and gyttja partings. The thickness of the coal bed varies from 60m to 80m respectively. The basal part of the coal beds consists of clay, marl and sandy clay. These formations are overlain by gyttja, which may also occur in the form of calcareous ooze, enveloping coal beds. The thickness of the gyttja is up to 80m. Alluvium, occurring very widespread along Hurman Stream, consists of gravels, sands and silt [5]. Lithological profile of the Collolar field is presented in Figure 2.
Figure 2. Lithological profile of the Collolar coal -field
2. PRESENTATION OF THE DATA SET
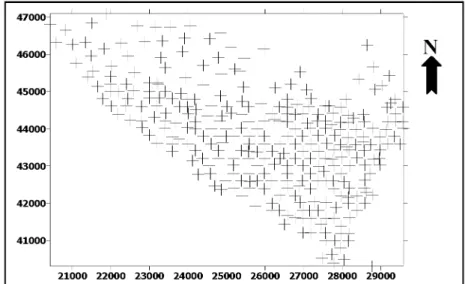
The information available comes from 193 holes drilled vertically on about a 200m to 250m grid (Figure 3). The coordinates and the number of the hole, and the results of the analyses for raw coal are supplied. The raw coal had been analysed for moisture content, ash content and calorific value. Core recoveries in the lignite are between 92% and 96% with an average of 94%.
44000^ 41000^ 42000^ 43000^ 45000^ 46000 47000^
t
N
21000 22000 23000 24000 25000 26000 27000 28000 29000Figure 3. Drill hole location map of Çöllolar coal-field
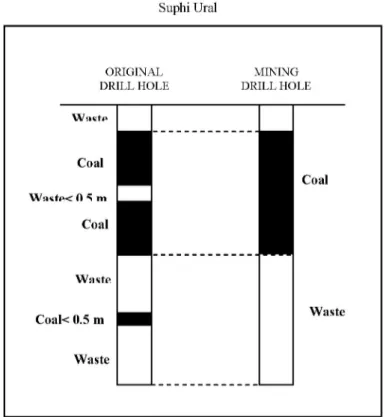
The deposit is made up of a great many layers of coal and intercalation. In this case the question of defining what is to be considered as "coal" and what is the "waste" is very real. This choice is governed by the technical constraints imposed by the mining method used. To be mineable, a coal seam must be at least 50cm thick. Similarly any intercalation less than 25cm thick is mined with the coal. These two constraints are applied to each drill hole in turn to distinguish mineable coal from waste. Figure 4 illustrates this procedure for a typical drill hole. In the first step the thicknesses of all contiguous coal seams are summed. Any coal seams that are too thin to be mined are then redefined as waste. Lastly any narrow bands of waste sandwiched in between exploitable coal seams are included with the coal.
Since the coal is destined for power generation the variables of interest include calorific value and ash content. The core samples are composited into a constant length of 5m from sample lengths that varied from 0.5m to 5m. The basic statistics of the variables to be studied is calculated in order to check outliers (extremely large or small values) or nonhomogeneous population. The histograms of the variables show that they present nearly normal distribution. 2968 composite samples have a mean of 1167 kcal/kg calorific value and 37.2% ash content in dry coal (Figure 5).
ORIGINAL MINING DRILL HOLE DRILL HOLE
Wa ste Coal
1
1
Coal Waste< 0 5 m Coal1
1
Waste Waste Coal< 0.5 m Waste WasteFigure 4. Procedure for calculating the quantities of coal and waste in a drill hole
Total number of samples: 2968 Mean: 37.2; Variance: 42.25 12 n 10 8 6 -» i l
İlli
JUL CN CN CO COAsh content in dry basis (%)
4 2 0
Total number of samples: 2968 Mean: 1167; Variance: 99225
„ o j l i l
E
Calorific value in raw coal (kcal/kg)
14 12
( a ) ( b )
3. VARIOGRAM ANALYSIS AND MODELING
Geostatistical theory is based on the observation that the variability of such quantities as grade and thickness has a particular spatial structure. The grades
z(x) and z(x+h) at point x and x+h are correlated; this spatial correlation
depends on the vector h, which separates the two points and decreases as the distance I h I increases. Beyond a particular distance the two quantities are no longer correlated. The spatial variability can also differ from one direction to another [7]. A characteristic behaviour or structure of the spatial variability can be discerned behind a locally erratic aspect. Geostatistics consider these variables as regionalized variables and both the random and structured aspect of the regionalized variables are expressed in the probabilistic language of random functions, every point of the deposit defines a random variable and the value at that point is interpreted as a realization of that random variable. A random function is seen as a set of random variables defined at each point in the deposit and a regionalized variable is a realization of the random function. In geostatistics the spatial variability of a regionalized variable is characterized by the variogram function, 2y(h) [6].
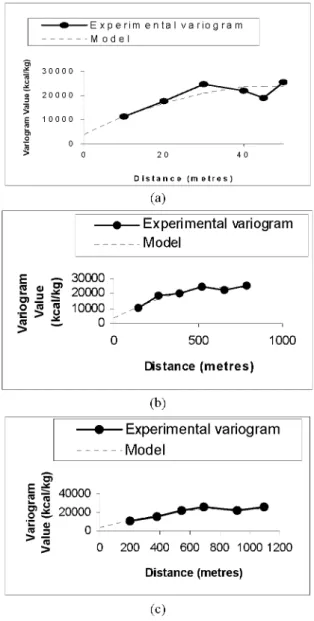
where h is the separation vector, y(h) is the semi-variogram and Z(x) is a random variable defined at point x. The variogram defines a few parameters like the zone of influence in all directions (which is named range, a), sampling error (which is named nugget effect, C0) and the variance of the samples (which is named sill, C) and is used in estimating an unknown value of the regionalized variable under study. Experimental variograms and model variograms of the variables of calorific value and ash content are seen in Figure 6 and Figure 7. The first experimental variogram of calorific value is computed for the downdip direction (Figure 6 (a)); this variogram shows a range of around 40m with a nugget effect value 2400 kcal/kg. The experimental variograms cross dip (Figure 6 (b)) and in strike-plunge (Figure 6 (c)) indicate the existence of geometric anisotropy, and the ranges in these directions are 750m and 500m, respectively. The following three-dimensional, simple, spherical type of variogram model is adopted
2y(h) = Var[Z(x) - Z(x+h)];
y(h) = 22080
y(h) = 0 h = a(9)
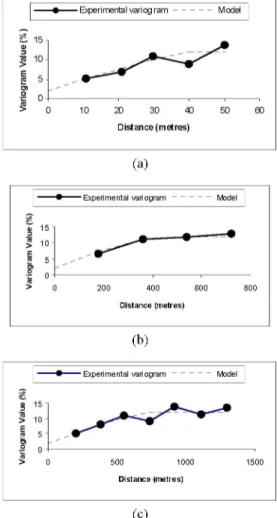
The experimental variogram of ash content for the downdip direction (Fig. 7(a)); shows a range of around 40m. The experimental variograms cross dip (Fig. 7(b)) and in strike-plunge (Fig. 7(c)) indicate the existence of geometric anisotropy, and the ranges in these directions are 682m and 455m, respectively. (a) Experimental variogram Model E ™ <0 d) ^ S ~ 30000 20000 10000 0 500 1000 Distance (metres) 0 (b) •Experimental variogram Model w m ar JC re 40000 o JC 20000 c ra e 0 > rs > 200 400 600 800 1000 1200 Distance (metres) 0 (c)
Figure 6. Experimental variograms and models for calorific value: (a) downdip; (b) cross-dip; (c) strike plunge
İ •g 0 2 e 15 3 > 10 ma 5 0 > > 10 Ü 5 -Experimental v a r i o g r a m 10 20 30 40 50 Distance (metres) (a) •Experimental variogram 200 400 600 800 Distance (metres) (b) "Experimental variogram 500 1000 Distance (metres) (c)
Figure 7. Experimental variograms and models for ash content: (a) downdip; (b) cross-dip; (c) strike plunge
The following three-dimensional, simple, spherical type of variogram model is adopted:
y(h) = 10 Y(h) = 12
1.5- h ( h ^•-0.5 3
a(9) I a(G) +2 h <a(G) h > a(G) ( 15 ğ 1 0 -0 e 15 0 0 1500
y(h) = 0 h = a(d)
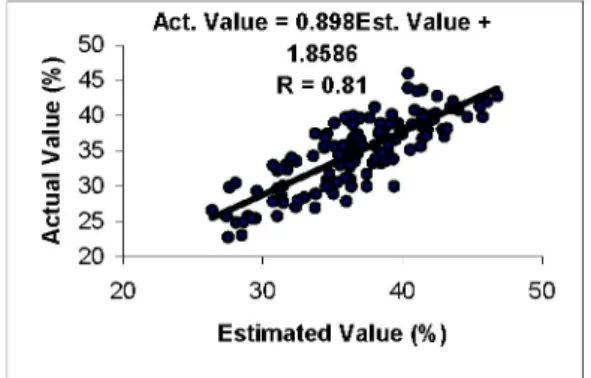
The parameters of the variogram model are validated by use of the back-estimation technique, in which each sample is removed from the data set in turn and then estimated from the remaining data and the variogram model. For conditionally unbiased estimates, the linear regression of actual values on estimated values should be close to a 45° line-that is, an intercept of zero and a slope of 1 [4].
The linear regressions of actual values on estimated values are presented in Figure 8 and Figure 9, respectively. Figures 8 and 9 can be taken as a verification of the model chosen.
~ Act. Value = 0.889Est. Value + t 1 6 0 0 1 85.88 ! 1400 - R = t 1 0 0 ^ W Î P ^ ' Ü 1000 - *
= ksC?* •
o 800 J — ' , , , < 800 1000 1200 1400 1600Estimated Value (kcal/kg)
Figure 8. Linear regression of actual values on estimated values for the calorific value of coal
Act. Value = 0.898Est. Value +
20 30 40 50 Estimated Value (%)
4. STORAGES CAPACITY FOR BUFFERING
The following points favour the use of stockpile as a buffer storages unit: (1) activities both at the mine and during production need not interact dynamically; (2) a steady supply of homogeneous raw coal to the power station is ensured; and (3) reduces demand for complex automation of subsequent processing stages.
The minimum buffering storages capacity of a power station coal stockpile can be determined
Qb = T P (SE /LCV) /1000 Vsb = Qb / p
where Qb is stocking capacity of stockpile, tonne; T is duration of maximum stoppage time for coal production, hour; P is installed capacity of power station, kW; SE is specific energy consumption of power station, kcal/kWh; LCV is lower calorific value of raw lignite, kcal/kg; Vsb is stocking volume of stockpile, m3; and p is average bulk density of the coal, t/m3.
It is reported that, duration of the longer operating standstill is 264 hours [9]; the installed capacity of Çöllolar power station is 1376000 kW, specific energy consumption of power station is 2300 kcal/kWh, average bulk density of the Elbistan coal is 0.85 t/m3 and average calorific value is
1167 kcal/kg. The stocking volume of stockpile can be calculated as
Qb = (264 x 1376000 x (2300 /1167)) /1000 Qb = 7160001
Vsb = 716000 / 0.85 Vsb =842353 m3
5. STORAGES CAPACITY FOR HOMOGENISATION
Raw coal arriving from the mine has certain unwanted characteristics fluctuations in their quality composition that must be filtered out if a consistent good quality coal feed is to be achieved. The following considerations favour the use of stockpile as a raw coal homogenisation unit: (1) sufficient overall input/output variability reduction ratio can be achieved, (2) raw coal from poorer deposits with large scale heterogeneity can be utilised, (3) mixing of various component raw coals can be achieved and (4) power station demands for improved product quality can be met.
Several attempts have been made to determine the size of stockpile utilising the theory of regionalised variables [1, 3] and also using unrealistic black-box macroscopic design techniques based on standard Gaussian ideal statistical formulae for assumed approximately normal distributed, statistically independent coal quality variation [8].
Geostatistical approach has been applied to determining the size of stockpile. In many cases a regionalized variable is defined as the average over a certain volume or a surface rather than a point. The basic volume on which a regionalized variable is defined is called its support. If we change the support we obtain a new regionalized variable, which is related to the preceding one but which has different structural characteristics. In case a stockpile is being considered to reduce stockpile input quality standard deviations, one can compute which size it should be so that stockpile output quality standard deviations are reduced to a certain level. Geostatistics can be used to calculate the variability of the average value of blocks of certain sizes, in other words the coal is homogenised over the size of the stockpile [1]. For that reason, it is essential to know the variance of blocks of a given size in the deposit. For the sake of generality, the supports will be referred to as volume v (i.e. daily production) and volume V (i.e. deposit). After Kriging's relationship [2] it is known that the variance of a block within a deposit is equal to the variance of a point within a deposit minus the variance of a point in the block. Thus all that is needed is the within block variance for a point as the first one is experimentally available. The variance of a block v within a large block V will be obtained by (David, 1977)
a2 (v/V) = a2(0/V)-a2(0/v) = F(V)-F(v) ;
where v is volume of daily production, V is volume of stockpile, a2(0/V) is
variance of a point within stockpile and a2(0/v) is variance of a point within
daily production.
To determine the size of the stockpile, one has to find the size of block, which has the value of a2(0/V) (David, 1988)
a2(0/V) = a2 (v/V) + a2(0/v)
Assume that the effect of stockpiling and subsequent reclaiming is perfect, in other words the coal is homogenized over the size of stockpile. Regarding the quality parameters as calorific value and ash content, the necessary size of stockpile for perfect homogenization can be calculated as follows:
Calorific value: The variogram of calorific value is spherical with the
is 40m with the nugget effect value of 2400 kcal/kg and the sill of 19680 kcal/kg. Each day 75m x 50m x 15m block, oriented as the main variation axes, is mined out. Using the chart of Fig. 10 and taking the anisotropies into account to calculate a2(0/v)
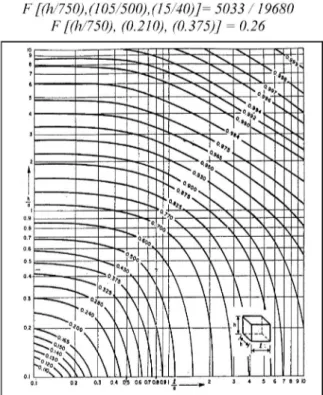
F [(75 / 750), (50 / 500), (15 / 40)] = 0.21 a2(0/v) = F(v) C = 19680 x 0.21 = 4133
It is desired to keep daily fluctuation of calorific value to 30 kcal/kg. To determine the size of the stockpile, one has to find the size of block, which has a variance (a2(v/V)) of 900 kcal/kg, as stockpiling and reclaiming to send the power station will show the variability of these larger blocks. The block must be 105m and 15m in two of its dimensions. To obtain a variance of 900 kcal/kg, we need a block within which the variance of a point will be
a2(0/V) = 900 + 4133= 5033
F [(h/750),(105/500),(15/40)]= 5033 /19680 F[(h/750), (0.210), (0.375)] = 0.26
Figure 10. Variance aa2(0/V) of a point within a parallelepipedic block (h, h, l) function
Using the chart of Figure 10, we can determine the third dimension of the block that should be 0.21 x 750m = 157.5m long. So, volume of the block is
V =157.5m x 105m x 15m = 248063 (bank) m3 and the volume of the stockpile regarding the calorific value is
Vc = V x
Vc = 248063 (bank) m3 x 1.18 Vc = 292714 (loose) m3,
where Vc is volume of the stockpile regarding the calorific value, m3; and y is average swell factor of Elbistan coal.
Ash content: The variogram of ash content is spherical with the horizontal
ranges across_dip and astrike_plunge are 682m and 455m, the vertical range is 40m with the nugget effect value of 2% and the sill of 10%. Using the chart of Fig. 10 and taking the anisotropies into account to calculate a2(0/v)
F[(75 / 682), (50 / 455), (15 / 40)] = 0.22 a2(0/v) = F(v) C = 10 x 0.22 = 2.2
It is desired to keep daily fluctuation of ash content to 1.0%. To determine the size of the stockpile, one has to find the size of block, which has a variance
(a2(v/V)) of 1.0%. The block must be 105m and 15m in two of its dimensions. To obtain a variance of 1.0%, we need a block within which the variance of a point will be
a2(0/V) = 1.0% + 2.2% = 3.2%
F [(h/682), (105/455), (15/40)] = 3.2 /10 F[(h/682), (0.230), (0.375)] = 0.32
Using the chart of Fig. 10, we can determine the third dimension of the block that should be 0.23 x 682m = 157m long. So, volume of the block is
157m x 105m x 15m = 247275(bank) m3 and the volume of the stockpile regarding the ash content is:
Va = V y
Va = 291785 (loose) m3
If it is desired to keep daily standard deviation of calorific value and ash content to 30 kcal/kg and 1% respectively, the total volume of stockpile is to be at least 292714m3.
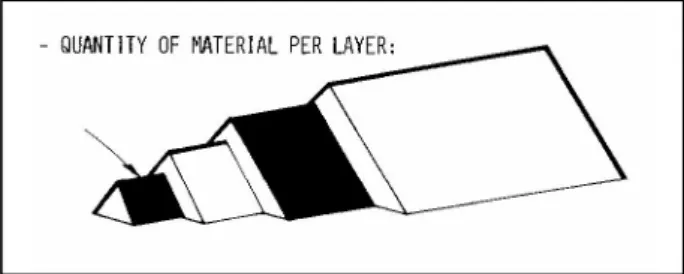
6. STACKING AND RECLAIMING
Most of stockpile equipment manufacturers utilize design methods that are essentially based on standard statistical macroscopic relationships [3]. These are used primarily to specify the number of layers of coal (Figure 11) that would be theoretically required in the stockpile to achieve a certain variability reduction ratio within the pile. The variability reduction ratio is also shows the homogenisation effect.
n = c / c
where n is homogenisation effect, co is stockpile output sample-to-sample quality standard deviation and c is stockpile input sample-to-sample quality standard deviation.
Figure 11. Representing of stacking in layered linear stockpile
The assumptions made for the specification of the number of layers of coal are: (1) that the variability of the raw coal to be homogenised are of a total random character with no underlying trends and present a near normal or Gaussian probability density function, (2) that adjacent quality sample values for any sample quantity/size are statistically independent. The sampling distribution of means is related to the original distribution for the data in having the same mean and a variance proportional to the original variance divided by the number of elements in each sample [8]
a x = k a2 j / n
where n is number of elements that can be interpreted as being equal to the number of layers (N) and k is the proportionality constant the value of which is
dependent on the amount of sample to sample correlation. If it can be assumed that the variation within the individual reclaimed slices is so insignificant to be of no interest and sample-to-sample correlation is zero then the ax can be expressed as:
a2x = a2o
a o = a2, / N
N = a2, / a2 o
Relating the Kriging's relationship [2], number of layers for perfect blending is equal the variance of a point within the bunker divide to the variance of a point within a layer.
N _ a2 (0/Vb)
a2 (0/Vl)
where a2(0/Vb) is variance of a point within the bunker, Vb is volume of a bunker, m3; a2(0/Vl) is variance of a point within a layer and Vl is volume of a layer, m3.
If it is desired to keep stockpile daily output standard deviation of calorific value to 30 kcal/kg and a2(0/Vb) equal to a2(0/V) and a2(0/Vl) equal to a2(0/v); number of layers for the variable of calorific value can be calculated
ir
5033
N _
900
N = 6
7. DIMENSIONS OF STOCKPILE
Total volume of the stockpile and number of bunkers can be given by
Vsb > Vc and Vc = Va Vb = Vc Vb = 292714 m3 Nb = Vsb / Va Nb = 842353 m3 /292714 m3 Nb =3
where Nb is number of bunkers. Total volume of the stockpile is equal to buffering storages capacity and stockpile can consist of three identical bunkers.
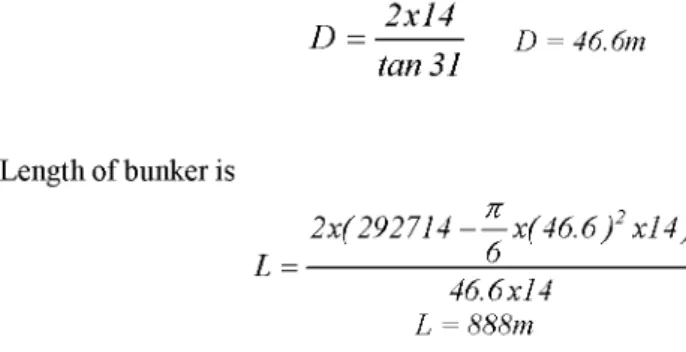
The maximum storages volume of a prismatic stockpile bunker is given by
n H3 H2L
Vb = — x — +
a
where L is the length of a bunker, m; H is total height of pile, m; a is the angle of repose of the coal; and D is the base with of the pile, m. Base with of the pile can be expressed as
D = J H . tana
Length of bunker can be expressed as:
L =
2(Vb D2H )
6 DH
It is reported that [9], total height of pile is 14m and the angle of repose of the coal is 32°. The base width of the pile is
D = 2xI4 tan SI D = 46.6m Length of bunker is n L = 2x(2927I4 x(46.6)2xI4) 6 46.6 xI4 L = SSSm
Proposed dimensions of the stockpile bunkers are presented in Figure 12.
8. CONCLUSIONS
The main findings of this study are the following:
The deposit is made up of a great many layers of coal and intercalation. To be mineable, a coal seam must be at least 50 cm thick. Similarly any intercalation less than 25 cm thick is mined with the coal. These two constraints are applied to each drill hole in turn to distinguish mineable coal from waste.
Geostatistical modeling techniques are good tool for the coal quality controlling purposes. The study presented here indicates that three-dimensional variograms of the quality parameters as calorific value and ash content of the Çollolar coal deposit can be modeled by spherical models. The models are then used to estimate fluctuation of daily production and storage capacity of the stockpile for perfect blending. The results of this study show that; the necessary storage volume for blending is 292714 m3 regarding to the coal quality parameters. As a result, total volume of the stockpile is to be at least 842353m3 and consists of 3 identical bunkers. The length and base width of each bunker is to be 888.0m and 46.6m respectively.
REFERENCES:
1. Armstrong, M. and Carignan J.; Géostatististique linéaire, Application au domaine
minier, Paris: Les press de l'Ecole des Mines, (1997), 113 p.
2. David, M. Geostatistical ore reserve estimation, New York: Elsevier, (1977), 364p. 3. David, M.; Handbook of applied advanced geostatistical ore reserve estimation, New
York: Elsevier, (1988), 215 p.
4. Dowd, P.A.; Algorithms for three-dimensional interpolation between planar slices.
In Earnshaw R.A. ed. Fundamental algorithms for computer graphics, NATO ASI Series F17, Berlin: Springer-Verlag, (1985), 531-54.
5. Gold, O. Lignite Deposit Afsin Elbistan Feasibility Report, Volume I, Cologne,
(1969), 354 p.
6. Journel, A.G. and Huijbregts Ch. J.; Mining geostatistics, London: Academic Press,
(1978), 600 p.
7. Matheron, G.; Principal of geostatistics. Economical Geol., (1963), 58, 1246-66. 8. Schofield, C. G.; Homogenisation/Blending Systems Design and Control for Mineral
Processing, Clausthal: Trans Tech Publication, (1980), 315 p.
9. Turkish Electricity Enterprises; Project Report for Afsin Elbistan Çollolar (B),
Volume I, Ankara, (1978), 123p.
10. Unver, O. and Kalafatcioglu, A.; Utilization of low calorific value Afsin-Elbistan
Lignites, Braunkohle - Tagebautechnik, Sondernummer EII, December (1979), 57-64.
11. Ural, S. and Onur A.H.; Application of continuous surface mining technology in
Afsin-Elbistan lignite basin, Transactions of the institution of mining and metallurgy (Section A), (1998), Vol. 107, A48-51.