(ISSN : 1304-0448)
January 2020 Volume 13 Number 1
www.jast.hho.edu.tr
Research Article
An ANFIS Based Vehicle Sales Forecasting Model Utilizing Feature
Clustering and Genetic Algorithms
Atınç YILMAZ
1, Umut KAYA
2, Ediz ŞAYKOL
31 Computer Engineering Department, Engineering and Architecture Faculty, Beykent University, İstanbul, Turkey,
[email protected] , https://orcid.org/0000-0003-0038-7519
2 Computer Engineering Department, Engineering and Architecture Faculty, Beykent University, İstanbul, Turkey,
[email protected], https://orcid.org/0000-0002-1410-3444
3
Computer Engineering Department, Engineering and Architecture Faculty, Beykent University, İstanbul, Turkey,
[email protected], https://orcid.org/0000-0002-8950-5114
Article Info Abstract
Received: October 17, 2019 Accepted: January 06, 2020 Online: January 23, 2020
Keywords: Adaptive Neuro Fuzzy Inference System (ANFIS), Feature Clustering, Genetic Algorithms, Vehicle Sales Prediction.
The automotive sector is one of Turkey’s most important industries, and the developments in technology are affecting the automotive sector as well as the other sectors. The methods that have been used to date indicate that the use of AI should be increased when the demand forecasting applications take into account the developments in the industry. For this purpose, by using the data taken from the Automotive Distributors Association and Turkish Statistical Institute Internet pages, intuitive learning hybrid ANFIS method is used to forecast the sales in this study. A clustering scheme is first applied to group the features, and then the features are fed into genetic algorithms to improve the prediction model performance. The experiments show that the prediction performance of the proposed method is good when compared to existing related studies in the literature.
To Cite This Article: A. Yılmaz, U. Kaya, E. Saykol, “An ANFIS Based Vehicle Sales Forecasting Model Utilizing Feature
Clustering and Genetic Algorithms”, Journal of Aeronautics and Space Technologies, Vol. 13, No. 1, pp. 139-154, Jan. 2020.
ANFIS Tabanlı Öznitelik Kümeleme ve Genetik Algoritmaları Kullanan
Bir Araç Satış Tahmini Modeli
Makale Bilgisi Öz
Geliş: 17 Ekim 2019 Kabul: 06 Ocak 2020
Yayın: 23 Ocak 2020
Anahtar Kelimeler: Uyarlamalı Sinirsel Bulanık Çıkarım Sistemi (ANFIS), Özellik Kümeleme, Genetik Algoritma, Araç Satış Tahmini.
Otomotiv sektörü Türkiye’nin en önemli sanayi kollarından biridir. Teknolojide yaşanan gelişmeler birçok sektörde olduğu gibi otomotiv sektörünü de etkilemektedir. Bugüne kadar yapılan çalışmalarda kullanılan yöntemler talep tahminindeki uygulamaların sanayide yaşanan gelişmeler dikkate alındığında yapay zekâ kullanımının artması gerektiğine işaret etmektedir. Bu amaçla Otomotiv Distribütörleri Derneği ve Türkiye İstatistik Kurumu İnternet sayfalarından alınan verileri kullanarak, bu çalışmada araç satışlarını tahmin etmek için sezgisel öğrenmeli melez ANFIS yöntemi kullanılmıştır. İlk once özellikleri gruplamak için kümeleme şeması uygulanır ve ardından tahmin modeli performansını geliştirmek için özellikler genetik algoritmalara beslenir. Deneyler, önerilen yöntemin tahmin performansının literatürdeki mevcut çalışmalarla karşılaştırıldığında iyi olduğunu göstermektedir.
1. INTRODUCTION
The automotive sector is one of Turkey's most important sectors. Technological development affects the automotive industry and many other industries. Ford's series production in the automotive sector is one of the most important discoveries in the industrial sector. The automotive sector is a large industrial sector that is a constantly growing sector associated with many industries and industries in the world. The automotive sector is one of the most important development parameters. The automotive sector in Turkey in the first quarter of 2017 decreased by 8.65% to 237 717 units, production increased by 22.13% 573 239 units, while exports in the first quarter of 2017 rose to 31.49% and reached 472 632 units. There are many factors affecting the demand for a product, especially the type and quality of the product. The most important of these are product type, price, other services or product prices, consumer income, consumer tastes and preferences. If the product is available, the request will be used at the same time as the sales request [1].
The K-means clustering algorithm [2] is an algorithm that separates the data to be clustered according to similar characteristics of the k-number of clusters as described in the literature [3]. Pulat and Kocakoç had proved of the effect of K-means clustering and GA [4]. GAs are intuitive algorithms that simulate biological processes by optimizing functions. Using GA for solution of multi parameter and nonlinear problem can give better results than conventional methods. The neural fuzzy logic, which is a hybrid AI model with powerful features of both methods, was developed by Jang in 1993, in which Artificial Neural Networks (ANNs) combine the decision-making features of fuzzy logic method derived from experiential learning and fuzzy set theory. Takagi-Sugeno-Kang, the first ANFIS method, has emerged by combining the neural fuzzy logic method, Takagi-Sugeno fuzzy logic method and the Kang neural network (NN) method.
In the study, a hybrid model fed by the averages method with Artificial Intelligence (AI) methods, Genetic Algorithm (GA) and neural fuzzy logic methods are proposed. By using the advantages of the AI methods mentioned, a hybrid model is proposed, and this model will be used in the sales forecast of the car. In the model, the input parameters will be clustered by showing the relation with the K-means methods, and then the clustered data will be optimized using the GA from the heuristic algorithms. Vehicle sales forecasts will be made using the optimized data and the clustered data annex method.
Similar works will be examined in Section 2 of the work, the methods used to solve the automobile sales problem
will be explained in Section 3. The created hybrid model is detailed in Section 4, the solution and the results of the model problem in Section 5 and the results and future works in Section 6.
2. RELATED STUDIES
In this section, the examples which show the hybrid methods are more successful than the methods used in literature for estimating the sales of automobiles, the applications in different fields and the other methods have been mentioned.
In 2011, Wang et al. used an ANFIS, an AI method for estimating new car sales in their work for the automotive industry in Taiwan, using a monthly data set of light commercial and commercial vehicles. They expressed that the results they obtained could provide significant contributions to the individual and to all market relations. They pointed out that this work could be helpful for price regulations in regional markets and market-making institutions [5].
Tian et al. used three different models to study the number of scrap vehicles in China. Estimation models constructed on the basis of scrap vehicle volume are composed of ANN methods optimized with multiple linear regression, ANN and GA. Mean value of multiple linear regression (MLR) is 2.86420, standard deviation (SD) is 4.39630, correlation coefficient (CC) is 0, 99940, mean value of ANN 2,301, SD 3,602, CC 0.9996, mean value of GA-ANN 0.8799, SD 1.5609, CC 0.9999. GA-GA-ANN model is better than MLR and ANN models because of the lower mean value and SD of absolute error and higher CC [6]. Yang and Li have proposed a combination forecasting model based on the Seasonal Index, RBF and RBF NNs, analyzing the characteristics of real car sales, because seasonal fluctuations and monthly sales are not linear to effectively predict automobile sales and increase the competitive power of automotive operation. The Segmental Index model obtained the results of MAPE 4,48, RMSE 11,51, RBF MAPE 4,48, RMSE 23,2, mappings MAPE 3,9, RMSE 8,36. According to these results, the seasonal index model and RBF NNs may increase the accuracy of estimation; they suggested that the combination model is very suitable for estimating sales in the automobile industry. [7].
The Saipa group of automakers in Wahabi and their automotive industry in Iran has created a hybrid AI model using ANFIS and GA, to predict future car sales. For the sales forecast, they used the customs tariffs per capita income, inflation rate, housing, imports, exchange rates, loan interest rates, car imports in the years 1990 to 2016. The RMSE and R2 values of the model results are 27092,
81 and 99, 66% for the ANFIS, 27092, 76 and 99, 66% for the Insensitive-GA, 59436, 75 and 95% for the ANN. According to this, they show that using GA has better estimation performance than ANN and ANFIS models. However, ANFIS and other heuristic and meta-heuristic methods can be used and methods such as GA can be used to select input variables to train with ANFIS [8].
Farahani et al. used ANNs and analytic hierarchy process to evaluate different sales and marketing factors in their efforts to predict vehicle sales and discussed different estimation methods. Before producing the desired vehicle, they argued that the ANN could determine whether the manufactured vehicle had sufficient demand and sales capability, or whether the investment would be affected by the demand risk [9].
We conducted a study on the monthly sales of domestic and imported light commercial vehicles in domestic and imported automobiles in Turkey in 2014-2016. By using the monthly domestic producer prices and monthly domestic producer price indexes in the studies of the S & P and Moody's rating institutions' periodic credit ratings as input data, We tried to estimate the sales of the first three months of 2017 with the ANFIS. We have shown that the ANFIS model we have created has reached 93% accuracy without estimating vehicle sales [10].
Lin et al. have proposed a new hybrid multi-model forecasting system with a specific focus on the changing regional market demand in image markets. The results show that the proposed system has better prediction performance than previous and individual models. They suggested that the hybrid model could be adapted to many areas of market forecasts [11].
Chen proposed a hybrid ANFIS model with incremental (cumulative) clustering and particle swarm optimization for job failure prediction. The suggestions show that the model is superior to the other models by providing a lower mean absolute percentage error (MAPE) and root mean square error (RMSE). They argued that the PS-ANFIS approach could provide better results in anticipating potential financial stress [12].
Tan et al. proposed a new ANFIS that adapts the fuzzy inference rules using Fruit Fly Optimization Algorithm (FOA) for Stock Market volatility estimation. They have correctly and successfully estimated the volatility of the model stocks and observed that the FOA-ANFIS model gave better results than the ANFIS model [13].
Akkaya tried to estimate the biomass heat value using approximate analytical components based on ANFIS. The results showed that the sub-cluster-based exponential model is the best predictor of the heat value of the biomass. With the regression coefficient value of 0.8836
(R2) and the value of 1.3006 RMSE, he suggested that the proposed model could be used as an effective method with high prediction accuracy [14].
Karthika and Paresh proposed a hybrid ANFIS model using wavelet decomposition data to estimate the air temperature. The hybrid wavelet-ANFIS method with Gaussian membership function yielded better results than the 0.95 (R2) reliability coefficient value and 0.74 (RMSE) root mean squared error value [15].
Akkarapol et al. found that automobile sales at segment levels had a long-term balance relationship with designated economic indicators in their study of the structural relationship definition methodology for defining the dynamic link between automobile sales and economic indicators in the automotive industry. Experimental results of the models indicated that RMSE (42.73%) and MAPE (42.25%) performance values could be used as an important method to increase the predictive accuracy of automotive sales forecasts 12 months ahead, compared with classical time series techniques [16]. Giashi et al. used a model of mass-machine intelligence system known as the CMIS in their study of carbon dioxide loading capacity of aqueous solutions for modeling and evaluation of experimental data. The R2 and RMSE values for the CMIS model are 0,999 and 0,016, respectively. They reported that the model used by DEA to predict CO2 loading capacity of aqueous solutions was successful [17].
Atsalakis et al. used the ANFIS method to estimate the success of new tourism service. To evaluate the performance of the proposed ANFIS model, they compared the results of linear discriminant analysis, logistic regression, k-neighborhood algorithm, and linear approach support vector and classification trees with comparative error measures. Among all predictive models, the ANFIS model has the lowest total error (8.43%) [18].
Soliman et al. developed a hybrid control scheme model consisting of GA and ANFIS to improve the performance of the variable speed wind energy conversion system. The validity of the ANFIS-GA control scheme has been confirmed by extensive simulated analyzes. They argued that the use of the ANFIS-GA control system could further enhance the dynamic and transient stability of wind generator systems [19].
Tsai et al. used a method consisting of ANFIS and GA to optimize the design parameters of surface acoustic wave gas sensors. Their suggestions have shown that the simulated experimental application of the GA-based ANFIS approach yields superior results in terms of both
resonance frequency shift and precision performance compared to traditional trial-and-error design methods and other GA-based designs [20].
Tsai et al. proposed a GA-ANFIS model to optimize the parameters of the microstructures of the backlight modules in the liquid crystal displays. When the results are analyzed in terms of prediction accuracy, cost reduction and brightness uniformity, the results of the hybrid method have far superior results than the traditional trial-and-error design methods and other GA-based methods. They concluded that the model they apply can be applied to industrial product design in nature and thus can provide an effective solution to the problems in various sectors [21].
Kampouropoulos et al. have proposed a new method for energy optimization of multi-carrier energy systems consisting of a combination of GA and ANFIS method. They aimed to meet the total power demand of the plant and to minimize the number of optimization criteria that are formulated as energy use, monetary cost and environmental cost. The success of the method has been confirmed under real conditions in the SEAT's car manufacturing facility in Spain under the FP7 European Research Project [22].
The difference of this study from the methods investigated in the literature is that it is aimed to obtain a better and more accurate estimation performance by using the k average algorithms considering the accuracy performance of the method which is used in automobile sales with the GA used in other fields.
3. METHOD
3.1. K-Means Clustering Algorithm
The K-means clustering method [3] is an algorithm that, as stated in the literature, divides the data to be clustered according to similar characteristics of k constant number of clusters and degrades performance in large data sets [4].
To start the clustering process, k random point selections are made, which represent the cluster centers of each entry. (w1, w2,...,wk) points at the beginning of the clustering process by the assumption that there are k constant clusters for the k average clusters according to [3], and each of the n input patterns (i1, ... in),
𝑾𝒋 = 𝒊𝒍, 𝒋 Є {𝟏, … , 𝒌}, 𝒍 Є {𝟏, … , 𝒏}
The expression Cj is the jth cluster, which is the discrete subset of the input patterns. The clustering quality is determined by the following error function:
𝐸 = ∑ ∑ |𝑖𝑙 − 𝑤𝑗|2 𝑖𝑙Є 𝐶𝑗 𝑘
𝑗=1 (1)
The choice of the appropriate k is a problem, the set of definitions is dependent and usually specifies the appropriate k value by experimenting with the user. Assuming that there are N patterns, each d dimension is divided into 3 parts, the computational cost of each iteration of the k average algorithms:
1. Time required for first For Loop is O (nkd)
2. Time required for the second For Loop (for calculating centers) is O (nd)
3. The time required for the calculation of the error function is O (nd).
The number of iterations required can range from one to a few thousand, depending on the number of models, the number of clusters and the distribution of input data. Thus, direct application of the K-means method can be very intensive in terms of calculation. This is especially true for typical data mining applications with a large number of pattern vectors. Clustering algorithm;
Initiate k prototypes (w1,..,wk) by associating each Cj clusters with prototype wj,
Repeat this for each input vector, l Є {1... n}
Assign the closest wj prototype and il to the Cj cluster
J Є {1... k} for each of the Cj clusters; update prototype wj until
𝑤𝑗 = ∑ |𝐶𝑗|𝑖𝑙
𝑖𝑙Є 𝐶𝑗 (2)
Will be the center of all the examples in the current situation in Cj.
Calculate the error function E by using the equation (1) until it does not change significantly or the cluster membership is unchanged.
3.2. GAs
GAs are intuitive algorithms that simulate biological processes by optimizing functions. The parameters used in the GA represent the genes and the bulk of the parameters represent the chromosome. To summarize the advantages of GA;
• It does not need any derivative information.
• It can investigate the objective function in an extended search space.
• It can work with many parameters. • It can work concurrently.
• It can optimize the parameters of the complex objective function without attaching to the local minimum and maximums.
• When multiple solutions are required, it allows optimum solutions to be obtained.
GAs are methods to solve search and optimization problems. Unlike other algorithms, GAs are one of the closest solutions that add time constraints to the account to choose the best. GAs are able to adapt to the conditions by having the ability to learn and collect events and information when there is no prior knowledge. Using GA for solution of multi parameter and nonlinear problem can give better results than conventional methods [23]. GA [24] first creates a random population. Then a series of new populations emerge. At each step, the algorithm uses the individuals of the current generation. The algorithm stops when the best fitness value is reached. The selection is valid for the next generation of parents according to the fitness scale. The algorithm creates cross-children by selecting vector entries or genes from a couple of individuals in the current generation. A person is mutated to form a child. Crossover allows the algorithm to extract the best genes from different people. The mutation contributes to population diversity. The algorithm continues until you find the best individuals with the best fitness indicators. Genetic algorithm steps are shown in Figure 1.
Figure 1. Genetic algorithm steps.
3.3. ANFIS
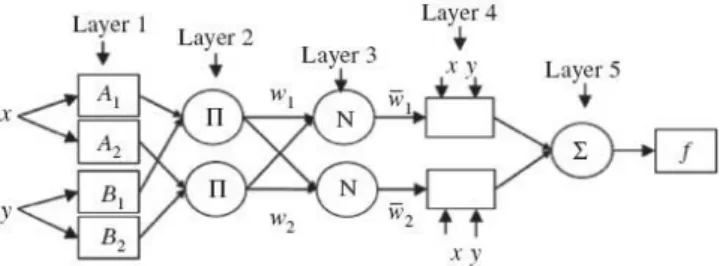
The neural fuzzy logic, which is a hybrid AI model with powerful features of two methods, was developed by Jang in 1993, in which ANNs combine the decision-making features of a fuzzy logic method derived from experiential learning and fuzzy set theory. Takagi-Sugeno-Kang, the first ANFIS method, has emerged by combining the neural fuzzy logic method Takagi-Sugeno fuzzy logic method and the Kang NN method. Developed by Jang, this method has been developed to identify nonlinear functions, to be used in determining nonlinear elements in chaotic time series estimation and control systems. The fuzzy logic module in MATLAB Software enables the use of the method developed by Jang [25]. In Figure 2, there is an exquisite architecture of Jang.
Figure 2. Jang ANFIS architecture [25].
The A and B values used to express verbal variables in the first layer are moved to Layer 2 after the membership level is determined by the membership function. These input products, which are expressed as the ignition level value after the 2nd layer in which the multiplication of the inputs is performed, are moved to a single node point in Layer 3. 3. Normalization is performed by multiplying the network sum of product values carried in the layer to the firing level value. After the normalization process, Takagi-Sugeno-Kang method is applied to the values obtained in the 4th layer to obtain a polynomial function or a fixed numerical value of the output values [26]. The average weight method is used in the Takagi-Sugeno-Kang model to calculate output values [27]. Thus, output values are obtained after 5th layer.
𝑥0= Σ𝛼𝑖.𝑥𝑖𝛴𝛼𝑖 (3)
As the result of TSK method, clarified values are obtained and no clarification process is required. The model generated according to the rule set and the output values after the fifth layer are expressed as follows [28]:
𝐼𝐹 𝑥 𝐼𝑆 𝐴𝑖 𝐴𝑁𝐷 𝑦 𝐼𝑆 𝐵𝑖 𝑇𝐻𝐸𝑁 𝑓𝑖 = 𝑝𝑖. 𝑥 + 𝑞𝑖. 𝑦 + 𝑟𝑖
(4)
1. Layer: The membership level of verbal variables is determined by the membership function (𝜇(x)), which indicates the level of
ignition (𝜇Ai(x),Bi(y)).
2. Layer : 𝑤𝑖 = 𝜇𝐴𝑖(𝑥). 𝜇𝐵𝑖(𝑦)
3. Layer: 𝑤𝑖⃗⃗⃗⃗ = 𝑤𝑖/ Σwi implies normalized level of the firing.
4. Layer: 𝑤𝑖⃗⃗⃗⃗ . 𝑓𝑖 is the layer output. 5. Layer : x0= Σwi.
fi Σwi
As a membership function in this study, the gauss combination membership function (gauss2mf function), which is known to give better results in the literature with fewer error values than others, has been used [28]. The Gaussian function consists of sig and c parameters and is defined as follows;
𝑓(𝑥; 𝑎, 𝑏, 𝑐) = 𝑒 − (𝑥 − 𝑐)2/2𝜎2 (5) The gauss2mf function, which is a combination of sig and
c parameters, is:
𝑦 = 𝑔𝑎𝑢𝑠𝑠2𝑚𝑓(𝑥, [𝑠𝑖𝑔1𝑐1 𝑠𝑖𝑔2𝑐2]) (6) While sig1 and c1 are used to describe the leftmost shape of the curve, the sig2 and c2 parameters are used to describe the rightmost shape of the curve. In the case of
c1 <c2, while the gauss2mf value in the first section
reaches the maximum, the maximum value is lower than the first value. The ordered parameters are displayed as follows:
[𝑠𝑖𝑔1, 𝑐1, 𝑠𝑖𝑔2, 𝑐2] (7) 3.4. Applying Hybrid Method
Experimental procedure was explained chapter 3.4 applying hybrid method. GA parameters were tuning for the problem type, range and best fitness. Literature studies guided to 12 input data types were effective parameters for car sales. So they were selected for vehicle sales prediction. K-Means algorithm was reorganized and improved. Also GA algorithm was added from the MATLAB explanations. GA optimization was terminated when the application reached to 50th iteration. Intel(R) Core(TM) i5-3230 CPU@ 2.6GHz 2.60 GHz CPU, 4 GB RAM, 64 bit Windows 10 Pro x64 Operating Systems.
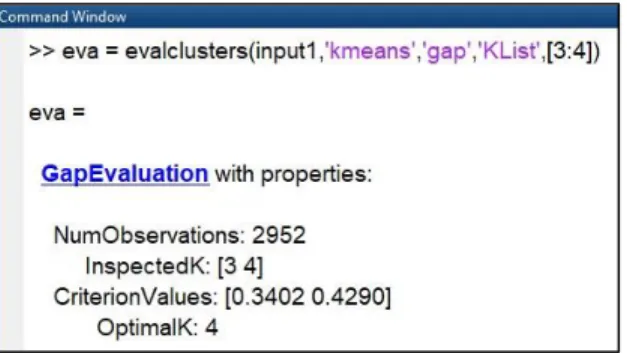
In this study [10], K-Means were chosen for the clustering algorithm, for determining the relationship between input and feature extraction, unlike the literature study. We evaluated the optimum clusters for our
datasets. Figure 3 shows that four clusters of K-Means are better than three clusters of K-Means.
Figure 3. Evaluate the optimal clustering between four and three clusters of K-Means.
Figure 4 shows four clusters and three clusters of plots versus gap values in K-Means clustering step.
Figure 4. K-Means Analysis; number of clusters versus gap values.
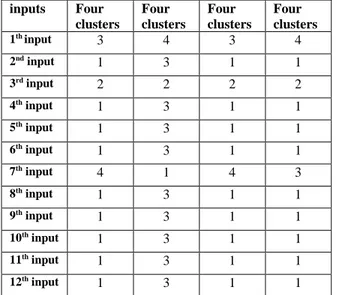
We chose four clusters for our datasets. We observed the alternated different four clusters of K-Means to our data sets. Table 1 shows the results of the different samples of random four clusters to our inputs. It proves that the same inputs grouped together in spite of the different numbers of clusters. So, we say that our clustering is effective and it is not randomly changed.
Table 1. The results of inputs random four clusters. inputs Four clusters Four clusters Four clusters Four clusters 1th input 3 4 3 4 2nd input 1 3 1 1 3rd input 2 2 2 2 4th input 1 3 1 1 5th input 1 3 1 1 6th input 1 3 1 1 7th input 4 1 4 3 8th input 1 3 1 1 9th input 1 3 1 1 10th input 1 3 1 1 11th input 1 3 1 1 12th input 1 3 1 1
It can be understood from that K-means algorithm applied for feature extraction by dividing the data into four clusters takes into account the Euclidean distance and it is not possible to randomly change the set of inputs. Table 2 below provides sample entries for vehicle sales forecasting. In the study in [10], sales in the first 3 months of 2017 were tried to be estimated by the method of insolation and the applied model reached 93% accuracy [28].
Considering the information in the literature, the new model in Figure 1 has been built on the basis of the ANFIS to improve the previously used model, since it is considered that the method of ANFIS is better with fewer parameters and the effect of estimation of each parameter is unknown.
However, in order to obtain the best result of the K-means clustering algorithm and the best result of the GA, the intuitive optimization features were added to the ANFIS method to generate the hybrid method Kme-gen-ANFIS expected to predict the best and most accurate vehicle sales.
The generated new model aggregates the twelve input data according to the K-means clustering algorithm so that the common properties can be determined first and the relationship between them can be understood. Thus, it is aimed to give better results to the hybrid method by grouping objects with similar properties.
The group that has common features has been selected as the group with the highest number of members. Selection of elements in this group is to avoid duplication of data. Then, by applying this group GA, it is possible to produce intuitive optimization of the input data which is not seen before and intuitively select the parameters which can give the best result.
Table 2. Vehicle sales forecast input sample data.
1st input 2nd input 3rd input 4th input 5th input 6th input 7th input 8th input 9th input 10th input 11th input 12th input Brand Vehicle
Type Ppi Dppi
Moody’s’ credit ratings S&P’ credit ratings Date Intermediate goods Durable consumer goods Non-durable consumer goods Energy Capital goods 1 2 229,10 5,52 1 2 1 9,9 2,7 8 3,3 7,1 1 2 232,27 6,11 1 2 2 6,5 5,4 3,6 5,8 3,1 1 2 233,98 6,95 1 2 3 4,7 3,9 4,4 4,6 5,2 1 2 234,18 7,89 1 2 4 4,3 1,2 4,2 6,8 6,5 1 2 232,96 8,66 1 2 5 5,6 -2,7 2 2 3,3 1 2 233,09 9,03 1 2 6 0 6,4 1,7 3,1 2,2 1 2 234,79 9,26 1 2 7 -0,7 5,1 4,7 5,4 11 1 2 235,78 9,55 1 2 8 2,4 1,8 3,8 6,5 9,5 1 2 237,79 9,84 1 2 9 -0,9 2,9 2,4 7 5,5 1 2 239,97 10,11 1 2 10 -0,3 5,3 4,5 3,6 3,5 1 2 237,65 10,32 1 2 11 -1,2 -1,4 4 4,1 -1,1
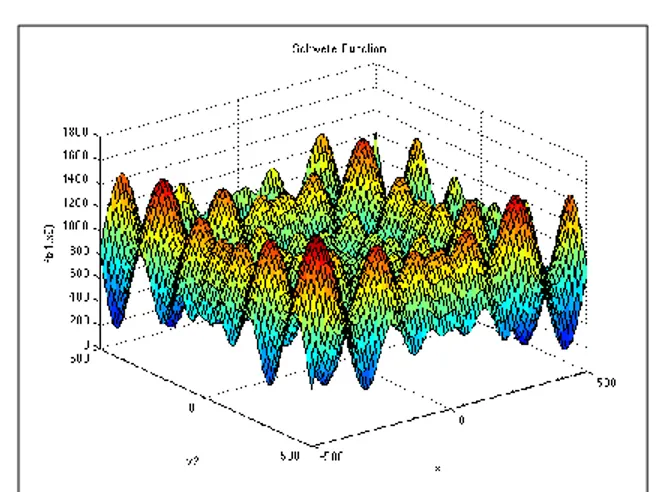
With the intuitive feature of GA, the data coming from the inputs will be output as if they are in the unconscious learning methods and will be used for the feeding. Applying averaging algorithms to the inputs will apply the grouping GA method which has the largest number of groups. The output of the GA will result in inputs that feed the output and other groups. Figure 4 shows that the optimum result of inputs of GA. Unconstrained problem type was chosen with Schwefel objective function which is complex and has many local minima [29].
𝑓(x) = 418.9829𝑑 − ∑ 𝑥𝑖 𝑠𝑖𝑛(√|𝑥𝑖| 𝑑
𝑖=1 ) (8)
Where d is dimension.
Also you can see two dimensional of the function plot in Figure 5. Schwefel function’s Matlab code is:
function value=objfun_schwefel(x) % Schwefel function
% Function: f(X1, X2) = -x1*sin (sqrt (abs(x1)) – x2*sin (sqrt (abs(x2)))
% Search space constraints: -500<=xi<=500
% Solution: min (f) = f6 (420.9687, 420.9687) = -837.9658 value = -x (1).* sin(abs(x (1)).^0.5) – x (2).*sin(abs(x (2)).^0.5);
Figure 5. Schwefel function plot for two dimensions. The input domain of the function is usually evaluated on the hypercube
𝑥𝑖 Є [−500,500], 𝑓𝑜𝑟 𝑎𝑙𝑙 𝑖 = 1, … , 𝑑
The global minimum of the function is:
𝑓(𝑥∗) = 0 𝑎𝑡 𝑥∗= (420.9687, … ,420.9687) (9)
In Figure 6, the optimization toolbox properties for GA problem solver are shown.
Figure 6. MATLAB Optimization tool for GA.
There is a GA code which is generated by MATLAB optimization tool in Figure 7.
Figure 7. MATLAB GA code.
GA optimization results are shown in Figure 8. The optimization terminates when the average change in the fitness value is less than options. GA stops at 51 generations for unconstrained problem type.
Figure 8. GA optimization results.
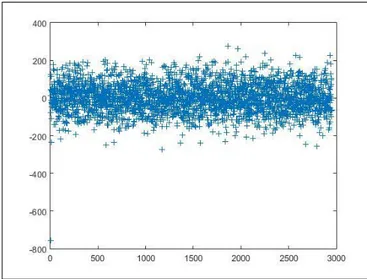
The negative results are shown in Figure 9 which is plotted for GA results.
Figure 9. GA results.
The ANFIS method has the ability to make comments on inputs that the ANNs have never encountered, thanks to the ability of learning. However, the ANFIS, which also has the ability to decide on the fuzzy logic method, has a high ability to predict the quantity of vehicle sales accurately with the rules applied to the input parameters. A hybrid forecasting model is used to consider the success of the hybrid models in the literature so that these three methods can give the best and most accurate vehicle sales forecast.
Five different dataset models have been created for the data which consist of training, test and control data. Considering the studies in the literature, the reduction of the number of exposures leads to better estimation results. However, it is observed that ANFIS shows more effective results in nonlinear estimation problems. It has been stated that more efficient results can be obtained in selected model constructions by experimenting with the data set. In predicting output values, it has been observed in previous studies that the success of the predicted values is due to the selection of the correct data sample, the appropriate learning method, the data cluster size, and the probabilistic membership function selection [28].
The other groups and the optimization parameters obtained from the GA result in four inputs and single output parameters resulting in the final input. Figure 10 shows Kme-gen-ANFIS model in below.
The architectural structure was created by using twelve input membership functions, eighty-one rules, and grid partitioning fuzzy inference method, hybrid optimization method for training and fault tolerance method for performance. The FIS editor, which is a neural fuzzy logic interface for writing using the edit command in MATLAB environment, is shown in Figure 11.
Figure 11. FIS properties.
It can be seen as four inputs, one output and eighty-one rules in Sugeno FIS type. In this study, ANFIS structure has one hundred ninety three nodes, four hundred five linear parameters, forty eight nonlinear parameters for four hundred fifty three total parameters. It also became two thousand training data pairs, four hundred fifty two checking data pairs and eighty one fuzzy rules.
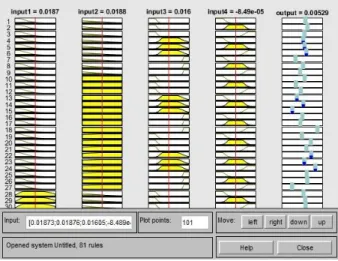
Since test, training and control data’s are loaded by selecting the workspace. Then, the generate FIS button was selected to create a fuzzy inference system. Here, the
screen showing the number and membership functions in Figure 12 emerges.
Figure 12. ANFIS rule sets.
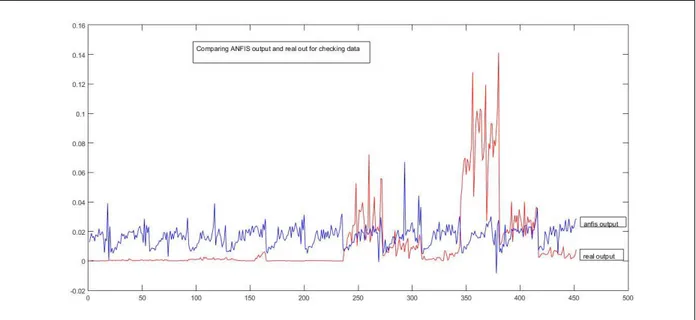
Three membership functions were selected for each of the four input parameters and the membership function type was selected as gauss2mf. In the phase of the fuzzy inference system, there are two optimization methods; back diffusion method and hybrid method. In practice, the hybrid optimization method is used for 0.005 fault tolerance. Ten repetitions were selected for training and the system terminated in two repetitions. The data allows us to test the neural fuzzy inference found in the interface. In Figure 13, it can be seen comparing ANFIS output and real output for check data pairs. Figure 14 shows ANFIS result errors for check data.
Figure 13. Comparing ANFIS output and real output for check data.
Table 3 shows that the sample results of comparing ANFIS output, real output and errors for checking four hundred fifty three data pairs.
Table 3. Comparing ANFIS output, real output and errors for checking data.
Real output ANFIS output Errors
0,00058279 0,0127225 -0,01263 0,000252542 0,015633316 -0,01557 0,000310821 0,018747074 -0,01871 0,000427379 0,015844844 -0,0155 0,001427835 0,016672617 -0,01662 0,001456975 0,013354293 -0,01335 0,001068448 0,017711165 -0,01769 0,000602216 0,017230399 -0,01722 0,000456519 0,016413437 -0,01641 0,000728487 0,021774534 -0,02177 0,000922751 0,017487815 -0,01733
4. RESULTS and DISCUSSION
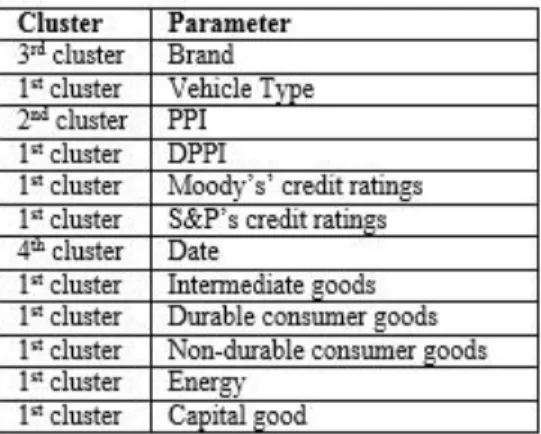
When the K average algorithms are applied to determine the number of clusters, the best value for k is obtained as four and the input data is divided into four clusters. The resulting clusters are shown in Table 4.
Table 4. Sets of K-means algorithm result input parameters.
Since K-means clustering algorithm has been applied in the literature [28], which results in fewer parameters than the first clustering method, the GAs have been applied to reduce the number of parameters and to create optimal
values for similar data. Table 5 shows the clusters and parameters applied to the GA.
Table 5. GA applied parameters of the first cluster.
Cluster Parameter Application
1st cluster Vehicle Type GA
1st cluster DPPI GA
1st cluster Moody’s’ credit ratings GA
1st cluster S&P’s credit ratings GA
1st cluster Intermediate goods GA
1st cluster Durable consumer goods GA
1st cluster Non-durable consumer goods GA
1st cluster Energy GA
1st cluster Capital goods GA
Table 6 shows sample data of the parameters obtained from the GA
Table 6. GA result sample parameter values.
GA result parameter -755,362 115,9581 -77,1082 46,21694 126,3314
The GA consists of the resultant parameter and the inputs of the 2nd, 3rd and 4th denominators and examples of the inputs and outputs of ANFIS are shown in Table 7.
Table 7. ANFIS input data examples.
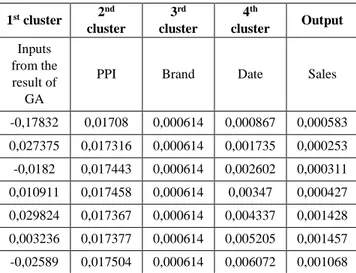
Before the application of ANFIS, parameters are normalized with each column vector in itself. Then the sample of normalization results of input parameters of ANFIS are shown in Table 8 in below.
Table 8. Normalized ANFIS input data samples.
1st cluster 2 nd cluster 3rd cluster 4th cluster Output Inputs from the result of GA
PPI Brand Date Sales
-0,17832 0,01708 0,000614 0,000867 0,000583 0,027375 0,017316 0,000614 0,001735 0,000253 -0,0182 0,017443 0,000614 0,002602 0,000311 0,010911 0,017458 0,000614 0,00347 0,000427 0,029824 0,017367 0,000614 0,004337 0,001428 0,003236 0,017377 0,000614 0,005205 0,001457 -0,02589 0,017504 0,000614 0,006072 0,001068
The data consisting of four input parameters are divided into 2000 for training, 500 for test and 452 for control to be used in the method of the ANFIS. In this study [10], k averages were chosen for the clustering algorithm, for determining the relationship between input and feature extraction, unlike the literature study.
With the intuitive feature of the GA, the data coming from the inputs are used to generate the output as well as to feed the ANFIS method as it is in the unconscious learning methods. The grouping GA method which has the largest number of groups is applied to the results of
applying K-means algorithms to the entries. Outputs that result from the application of the GA and other groups are inputs that feed the method of the ANFIS. The ANFIS method has the ability to make comments on inputs that the ANNs have never encountered, thanks to its ability to learn and to make deductions from what they have learnt. However, the ANFIS, which also has the ability to decide on the fuzzy logic method, has a high ability to predict the quantity of vehicle sales accurately with the rules applied to the input parameters. A hybrid forecasting model has been developed considering the success of the hybrid models in the literature so that these 3 methods can give the best and most accurate vehicle sales forecast result. However, intermediate goods from Turkish Statistical Institute page, durable goods, nondurable goods, energy and capital goods data [10] was created by adding the value of the input data.
In [10], four different vehicles (50 cars, domestic automobiles, imported automobiles, domestic light commercial vehicles, imported light commercial vehicles) from www.odd.org.tr, which is the web page of the automotive distributors of the year 2014-2016, type and input data.
In addition, the monthly (producer price index) PPI, domestic producer prices, Moody's credit rating, S & P credit rating, vehicle sales dates and vehicle sales figures for 2014-2016 are included in the data set. Considering that PPI, YUF, Moody's credit rating and S & P credit rating will directly affect vehicle sales; they are added to the input data in [10]. In this study, by including the figures of 2014-2016’s monthly basis, intermediate goods, durable goods, nondurable goods, energy, and by including the input data the figures for capital goods which are taken from Turkish Statistical Institute official
1st cluster 2nd cluster 3rd cluster 4th cluster Output
Inputs from the result of GA PPI Brand Date Sales
-755,3615614 229,1 1 1 60 115,9581441 232,27 1 2 26 -77,10815319 233,98 1 3 32 46,21694275 234,18 1 4 44 126,3314239 232,96 1 5 147 13,7068256 233,09 1 6 150 -109,6855826 234,79 1 7 110
page to input data, a better forecasting for vehicle sales is aimed. Kme-gen-ANFIS model succeeded 0,024 RMSE and 0,0005 MSE error results. Also, Table 9 shows that comparing results of Kme-gen-ANFIS and ANFIS [10] for SSE and SE result performances.
Table 9. Comparing the results of Kme-gen-ANFIS and ANFIS [10].
SSE SE
Kme-gen-ANFIS 0,261 -2,2049
ANFIS[10] 8,49 23,58
5. CONCLUSION
In this study, a hybrid model was developed which is thought to be an alternative to vehicle sales forecasting by neural fuzzy logic method in the literature. In the developed model, the mean values are divided into four clusters with the clustering algorithm and common features of the input data. The data belonging to the cluster containing the nine features are used as input parameters to the GA model which is one of the heuristic algorithms. The output of this model is the input of the ANFIS model together with the data from the other clusters. Thus, it is aimed to increase the estimation performance by reducing the number of inputs for the noise model. RMSE, MSE and SSE values of the proposed method are obtained as 0,0240, 0,00057 and 0,26114 according to the output results obtained after the application of ANFIS. Accordingly, it is seen that the model is successful and applicable. It is hoped that the generated Kme-gen-ANFIS hybrid model will be successful compared to other methods in the literature used for vehicle sales forecasting and will contribute to the literature as the first hybrid model in this area and exemplify the hybrid models to be developed thereafter. By providing more contribution to vehicle sales forecasting with the proposed hybrid method; production, exports, labor force, resource utilization, etc., are expected to increase productivity.
6. REFERENCES
[1] U. Kaya, A. Yılmaz, K. Keskin “Vehicle Sales Prediction Using Neural Fuzzy Logic Method in Industry 4.0,”, Industry 4.0 from the MIS Perspective, Editors: S. Gülseçen, Z. A. Reis, M. Gezer, Ç. Erol, Peter Lang Publication, vol 1, pp. 233-246, 2018.
[2] A. Khaled, R. Sanjay, S. Vineet, “An Efficient K-Means Clustering Algorithm” IPPS: 11th International Parallel Processing Symposium, 1998.
[3] T.T. Bilgin, Y. Çamurcu “Dbscan, optics ve K-means kümeleme algoritmalarının karşılaştırılması,” Politeknik
Dergisi (Journal of Polytechnic), Vol. 8, No.2,
139-145, 2005.
[4] M. Pulat, İ. Deveci Kocakoç “Determining the Initial Population of Solving the Traveling Salesman Problem with Genetic Algorithms”, JOEEP: Journal of Emerging
Economies and Policy, Vol. 2, No. 1, pp. 95-123, 2017.
[5] F.K. Wang, K.K. Chang, C.W. Tzeng “Using adaptive network-based fuzzy inference system to forecast automobile sales,” Expert Systems with Applications, Vol. 38, Issue 8, pp. 10587-10593, 2011.
[6] G. Tian, M. Zhou, J. Chu, B. Wang “Prediction models of the number of end-of-life vehicles in China” Proceedings of the 2013 International Conference on Advanced Mechatronic Systems, Luoyang, pp. 357-362, 2013.
[7] L. Yang, Li B. “The Combination Forecasting Model of Auto Sales Based on Seasonal Index and RBF Neural Network” International Journal of Database Theory and
Application, Vol. 9, pp. 67-76, 2016.
[8] A. Vahabi, S.S. Hosseininia, M. Alborzi “A Sales Forecasting Model in Automotive Industry using Adaptive Neuro-Fuzzy Inference System(ANFIS) and GA(GA)” (IJACSA) International Journal of Advanced
Computer Science and Applications, Vol. 7, No. 11, pp.
24- 30, 2016.
[9] D.S. Farahani, M. Momeni, N.S. Amiri “Car Sales Forecasting Using ANNs and Analytical Hierarchy Process (Case Study Kia and Hyundai Incorporations in the USA)” Data Analytics 2016, The Fifth International Conference on Data Analytics, Venice, Italy, from October 9, 2016 to October 13, pp. 57-62, 2016.
[10] U. Kaya, A. Yılmaz, K. Keskin “Vehicle Sales Prediction Using Neural Fuzzy Logic Method in Industry 4.0,” 4th International Management Information Systems Conference Industry 4.0 (IMISC2017), İstanbul University, İstanbul, Turkey, pp. 145-146, October 17-20, 2017.
[11] C.C. Lin, C.L. Lin, J.Z. Shyu “Hybrid multi-model forecasting system: A case study on display market” Knowledge-Based Systems, Vol. 71, pp. 279-289, 2014. [12] M.Y. Chen “A hybrid ANFIS model for business failure prediction utilizing particle swarm optimization and subtractive clustering” Information Sciences, Vol. 220, pp. 180-195, 2013.
[13] L. Tan, S. Wang, K. Wang “A new adaptive network-based fuzzy inference system with adaptive adjustment rules for stock market volatility forecasting”
Information Processing Letters, Vol. 127, pp. 32-36,
2017.
[14] E. Akkaya “ANFIS based prediction model for biomass heating value using proximate analysis components” Fuel, Vol. 180, pp. 687-693, 2016. [15] B.S. Karthika, P.C. Deka “Prediction of air temperature by hybridized model (wavelet-ANFIS) using wavelet decomposed data” International conference on water resources, coastal and ocean engineering (ICWRCOE 2015), Aquatic Procedia, Vol. 4(2015), pp. 1155-1161, 2015.
[16] A. Sa-ngasoongsong, S.T.S. Bukkapatnam, J. Kim, P.S. Iyer, R.P. Suresh “Multi-step sales forecasting in automotive industry based on structural relationship identification” International Journal of Production
Economics, Vol. 140, Issue 2, pp. 875-887, 2012.
[17] M.M. Ghiasi, A. Hajinezhad, H. Yousefi, A.H. Mohammadi “CO2 loading capacity of DEA aqueous solutions, Modeling and assessment of experimental data” International Journal of Greenhouse Gas Control, Vol. 56, pp. 289-301, 2017.
[18] G.S. Atsalakis, I.G. Atsalaki, C. Zopounidis “Forecasting the success of a new tourism service by a neuro-fuzzy technique” European Journal of Operational Research, Vol. 268, Issue 2, pp. 716-727,
2018.
[19] M.A. Soliman, H.M. Hasanien, H.Z. Azazi, E.E. El-kholy, S.A. Mahmoud “Hybrid ANFIS-GA-based control scheme for performance enhancement of a grid-connected wind generator”, IET Renewable Power
Generation, Vol. 12, No. 7, pp. 832-843, 2018.
[20] J.T. Tsai, K.Y. Chiu, J.H. Chou “Optimal Design of SAW Gas Sensing Device by Using Improved Adaptive Neuro-Fuzzy Inference System” in IEEE Access, Vol. 3, pp. 420-429, 2015.
[21] J.T. Tsai, J.H. Chou, C.F. Lin “Designing Micro-Structure Parameters for Backlight Modules by Using Improved Adaptive Neuro-Fuzzy Inference System” in IEEE Access, Vol. 3, pp. 2626-2636, 2015.
[22] K. Kampouropoulos, F. Andrade, E. Sala, A.G. Espinosa, L. Romeral “Multi objective Optimization of Multi-Carrier Energy System Using a Combination of
ANFIS and GAs” in IEEE Transactions on Smart Grid, Vol. 9, No. 3, pp. 2276-2283, May 2018.
[23] G. Tian, M. Zhou, J. Chu, B. Wang “Prediction models of the number of end-of-life vehicles in China” Proceedings of the 2013 International Conference on Advanced Mechatronic Systems, Luoyang, pp. 357-362, 2013.
[24] “How teh Genetic Algorithm Works”, mathworks.com, [Online]. Availabe:
https://www.mathworks.com/help/gads/how-the-genetic-algorithm-works.html, [Accessed: June 27, 2019] [25] A. Yücel “Tedarikçi Seçimi Probleminde Bütünleşik Sinirsel Bulanık Mantık Yaklaşımı” İstanbul Üniversitesi Endüstri Mühendisliği Bölümü, Doktora Tezi, İstanbul, 2010.
[26] Z. Şen “Mühendislikte Bulanık Mantık (Fuzzy) İle Modelleme Prensipleri” Su Vakfı Yayınları, İstanbul, 2004.
[27] R. Babuska “Fuzzy and Neural Control (Lecture Notes)” Delft, Delft University of Technology, 2001. [28] O. Doğan “Uyarlamalı Sinirsel Bulanık Çıkarım Sisteminin (ANFIS) Talep Tahmini İçin Kullanımı ve Bir Uygulama” Doktora Tezi, Dokuz Eylül Üniversitesi İktisadi ve İdari Bilimler Fakültesi Dergisi, Vol. 31, No. 1, pp. 257-288, 2016.
[29] “Virtual Library of Simulation Experiments: Test Funcions and Datasets”, sfu.ca, [Online]. Available: https://www.sfu.ca/~ssurjano/schwef.html, [Accessed: June 19, 2019].
7. VITAE
Atınç YILMAZ is an Assistant Professor in Beykent University Computer Engineering Department, Ayazağa, Istanbul, Turkey. He is the head of Computer Engineering Department at Beykent University since 2017 and Vice Dean at Engineering and Architecture Faculty since 2019. He graduated from Haliç University Computer Engineering Dept. in 2005, and finished his M.Sc. in the same department in 2008. He received his Ph.D. from Sakarya University, Department of Computer and Information Engineering in 2015. His research interests include Artificial intelligence, Programming Languages, Computer System Structure and Hardware and Deep Learning. He has a book called “Artificial Intelligence” published by Kodlab Press in 2017. He has another book, he wrote with Umut Kaya called “Deep Learning” published by Kodlab Press in 2019.
Umut KAYA is a part-time lecturer in Beykent University Computer Engineering Department, Ayazağa, Istanbul, Turkey since 2018. He graduated from Abant İzzet Baysal University, Department of Mathematics in 2005. He finished his M.Sc. in Management Information Systems from Sakarya University in 2012. He is a PhD candidate in Beykent University Computer Engineering. He also worked as a lecturer in Computer Programming Department of İzmir Kavram Vocational College between 2015 and 2019. His research interests include Artificial Intelligence and Deep Learning. He has a book, he wrote with Atınç Yılmaz called “Deep Learning” published by Kodlab Press in 2019.
Ediz ŞAYKOL is an assistant professor in Computer Engineering Department, Beykent University since 2011. His research interests include video surveillance (abnormal event detection, human action recognition, visual privacy) and document/textual image processing. His contributions have been published in several journals and conferences, and his work has been cited more than 500 times.
![Table 9. Comparing the results of Kme-gen-ANFIS and ANFIS [10].](https://thumb-eu.123doks.com/thumbv2/9libnet/3898350.43646/14.918.109.448.250.338/table-comparing-results-kme-gen-anfis-anfis.webp)
