Volume III, Issue II, 30-37 Eastern Anatolian Journal of Science
Chemometric Analysis of Moxifloxacin and Metronidazole in Binary Drug
Combinations With Spectrophotometric Method
GÜZİDE PEKCAN ERTOKUŞ, ÜMİT MURAT ÇELİK
Department of Chemistry Faculty of Science & Art, Süleyman Demirel University, Isparta, Turkey
Abstract
In this study, sensitive and accurate spectrophotometric-chemometric methods were developed for metronidazole and moxifloxacin without any separation step in pharmaceutical tablets. The used chemometric methods are partial least squares regression (PLS) and principal component regression (PCR). PLS and PCR were successfully applied for chemometric analysis of metronidazole and moxifloxacin in synthetic mixtures and pharmaceutical tablets. A concentration set including binary mixtures of metronidazole and moxifloxacin formed to 24 different combinations were randomly prepared in 0.1 M HCl. The accuracy and precision of the developed method were validated by analyzing synthetic mixtures containing the examined drugs. As a result of the determination, high recoveries and low standard deviations were found. Absorbance and concentration values were used in Minitab and other chemometric programs to calculate estimated concentrations with PCR and PLS. The second step, in drug tablets (Avelox and Flagy), was calculated amounts for metronidazole and moxifloxacin.
Keywords: Metronidazole and moxifloxacin, PLS,
PCR.
1. Introduction
Metronidazole; 2-methyl-5-nitroimidazol-1-etanol is used as an antiprotozoal, antiamebic and antibacterial drug [1]. But metronidazole in high concentration can not eradicate all bacteria from carious lesions [2]. Metronidazole was examined spectrophotometric method [3,4], chromatographic method [5,6] and voltametric method [7,8].
Moxifloxacin; 1-cyclopropyl-7-[2,8-diazobicyclo (4.3.0) nonane]-6-fluoro-8-methoxy-1.4-dihydro-4- Received: 10.10.2017
Revised: 02.11.2017 Accepted: 11.11.2017
Corresponding author: Güzide Pekcan Ertokuş, PhD Department of Chemistry,Faculty of Science & Art, Süleyman Demirel University, Isparta, Turkey
E-mail: [email protected]
Cite this article as: G. P. Ertokuşand Ü. M. Çelik, Chemometric Analysis of Moxifloxacin and Metronidazole in Binary Drug Combinations with Spectrophotometric Method, Eastern Anatolian Journal of Science, Vol. 3, Issue 2, 30-27, 2017.
oxo-3-quinolone carboxylic acid [9] has a methoxy function at the 8-position and an S,S configured diazobicyclononyl ring moiety at the 7-position [10]. Moxifloxacin is enhanced activity in vitro against Gram-positive bacteria and maintenance of activity against Gram-negative bacteria [9]. Metronidazole was examined spectrophotometric method [11,12,13,14,15], chromatographic method [16,17,18] and voltametric method [19], fluorescence [20], capillary zone electrophoresis [21].
Chemometric calibration methods are observed that it is the best techniques to determinate the amount of each component in the complex mixture. The most accepted chemometric methods in drug analysis are principal component regression (PCR) and partial least squares regression (PLS) [22]. A relationship to be established between matrices of chemical data is determinated at chemometric methods[23].
In this study, principal component regression (PCR) and partial least squares regression (PLS) were successfully performed to simultaneous determination of metronidazole and moxifloxacin in a commercial tablet formulation, tablets without any separation method. Mean recoveries (%) and standard deviation of principal component regression (PCR) and partial least squares regression (PLS) methods were calculated for the validation of the methods. The acquired results were statistically compared each other.
2. Experimental
Chemicals and Reagents : All materials used were
analytical grade. 0.025 g / 250 ml metronidazole 0.025 g / 250 ml moxifloxacin stock solutions were made up with 0.1 M HCl. Mixtures were prepared at various ratios. A training set and validation set containing the drugs in various proportions, 24 synthetic mixtures synthetic mixtures (for validation) was made.
Instruments and Software : A Shimadzu UV-1700
PharmaSpec Spectrophotometer connected to an IBM PS with UV Probe Software was used for all measurements and data processing. A pair of 1.0 cm quartz cuvettes were used for absorbance measurements.
Absorbance Measurements: Interval
corresponding to the difference 0.5 between 200-500 nm were recorded for the active ingredients of the absorbance spectra. Calibration matrix and training verification sets contain two component mixtures that are optimized at different ratios. Spectra analysis of pure agents and PLS and PCR were used to calculate the concentrations.
Samples of 5-35 ppm (either alone or in combination) between the active substances were taken up into 25 ml volumetric flask volumes and completed with 0.1 M HCl. The mixtures were agitated for thorough mixing.
Procedure for real sample: For this purpose, the
active substance samples were transferred to 25 ml flasks and mechanically mixed in 0.1 M HCl in a medium similar to the stomach environment.
Chemometric Method: Partial least squares
regression (PLS-regression) is the most commonly used chemometric multivariate calibration method [24].
PLS is done using both experimental (or x) and concentration (or c) data simultaneously. Usually PLS is presented in the form of equations. There are a few ways to express them, the most suitable for our purpose being:
X = T.P. + E (1) c = T.q + f (2)
Where X refers to the experimental measurements (e.g. spectra) and c is the concentration. There is a correlation with an installation for vector vector q. Matrix T is common to both equations. E is an error matrix and error to prevent the x vector c to block scores f orthogonal, but non-orthogonal (P) loads, generally are non-normalized [25].
The Minitab 17 program (İnova, Ankara, Turkey) was used for the analysis of all the concentration and absorbance data and to do the statistical calculations. Minitab is a statistical analysis software. In addition to statistical research, statistics can be used to learn [27].
3. Results and Discussion
Figure 1 shows the absorbance-wave length (nm) curves. The spectrum of metronidazole and moxifloxacin is in the range of 200-500 nm.
FIG. 1: The Absorption Spectrum of Metronidazole and Moxifloxacin
Our objective in this study is to develop a lower-cost but more quick and reliable analytical method using chemometry. With this method, active ingredients can be analyzed without pre-separation, and loss of time and work due to the trial and error method will be prevented.
With the spectrophotometric-chemometric method used, the pharmaceutical industry will be faster and less costly. As a result, drug prices can be lowered so people can buy drugs more cheaply.
The PLS method and absorption spectra can be used individually or overlapping for multiple simultaneous detection of very linear components.
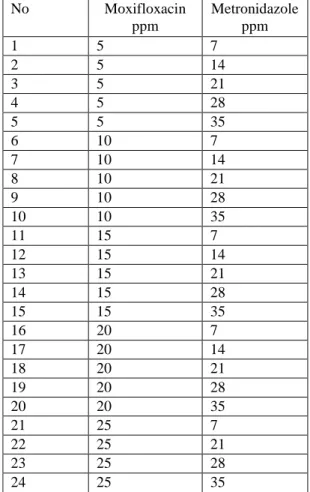
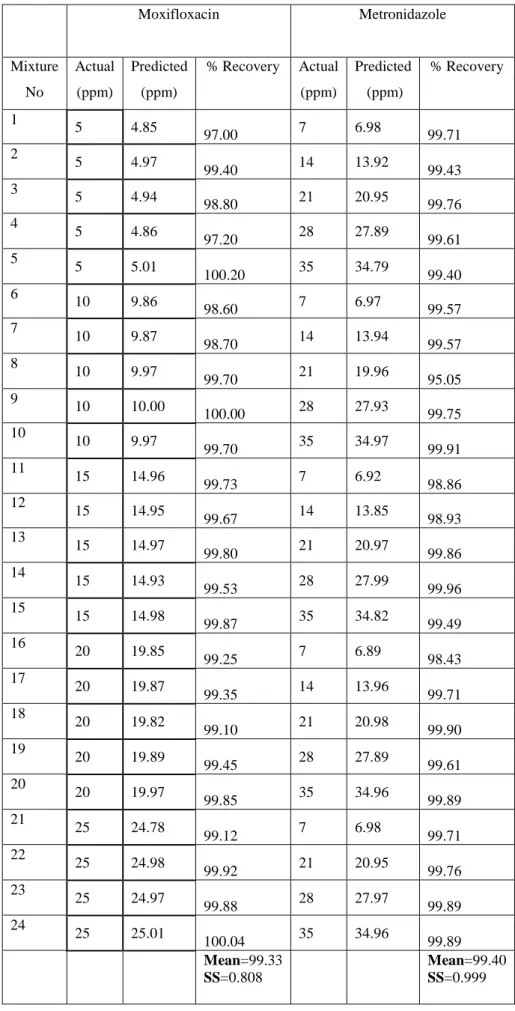
Concentrations of metronidazole and moxifloxacin mixtures are listed in Table 1. Prediction of the calibration methods was done by resolution of ten synthetic mixtures in a working concentration range for food colorants. Predicted concentration data of metronidazole and moxifloxacin mixtures is shown in Table 2. The percentage recovered and relative standard deviations are also listed in Table 2. The training set of 24 standard mixture solutions contain different concentrations of metronidazole and moxifloxacin.
Table 1: Concentratıon Set Containing Metronidazole and Moxifloxacin Compounds for The Preparation of
The Pcr and Pls Calibration.
No Moxifloxacin ppm Metronidazole ppm 1 5 7 2 5 14 3 5 21 4 5 28 5 5 35 6 10 7 7 10 14 8 10 21 9 10 28 10 10 35 11 15 7 12 15 14 13 15 21 14 15 28 15 15 35 16 20 7 17 20 14 18 20 21 19 20 28 20 20 35 21 25 7 22 25 21 23 25 28 24 25 35
Table 2 : Composition of Prediction Set and Recovery Results Obtained in Synthetic Mixtures for Pls Method Moxifloxacin Metronidazole Mixture No Actual (ppm) Predicted (ppm) % Recovery Actual (ppm) Predicted (ppm) % Recovery 1 5 4.85 97.00 7 6.98 99.71 2 5 4.97 99.40 14 13.92 99.43 3 5 4.94 98.80 21 20.95 99.76 4 5 4.86 97.20 28 27.89 99.61 5 5 5.01 100.20 35 34.79 99.40 6 10 9.86 98.60 7 6.97 99.57 7 10 9.87 98.70 14 13.94 99.57 8 10 9.97 99.70 21 19.96 95.05 9 10 10.00 100.00 28 27.93 99.75 10 10 9.97 99.70 35 34.97 99.91 11 15 14.96 99.73 7 6.92 98.86 12 15 14.95 99.67 14 13.85 98.93 13 15 14.97 99.80 21 20.97 99.86 14 15 14.93 99.53 28 27.99 99.96 15 15 14.98 99.87 35 34.82 99.49 16 20 19.85 99.25 7 6.89 98.43 17 20 19.87 99.35 14 13.96 99.71 18 20 19.82 99.10 21 20.98 99.90 19 20 19.89 99.45 28 27.89 99.61 20 20 19.97 99.85 35 34.96 99.89 21 25 24.78 99.12 7 6.98 99.71 22 25 24.98 99.92 21 20.95 99.76 23 25 24.97 99.88 28 27.97 99.89 24 25 25.01 100.04 35 34.96 99.89 Mean=99.33 SS=0.808 Mean=99.40 SS=0.999
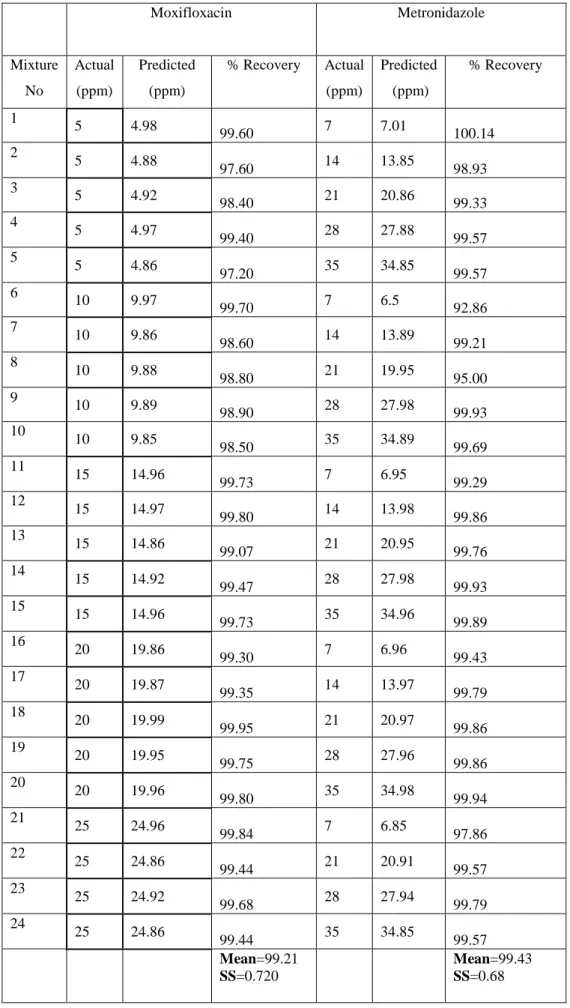
Table 3: Composition of prediction set and recovery results obtained in synthetic mixtures for Pcr method Moxifloxacin Metronidazole Mixture No Actual (ppm) Predicted (ppm) % Recovery Actual (ppm) Predicted (ppm) % Recovery 1 5 4.98 99.60 7 7.01 100.14 2 5 4.88 97.60 14 13.85 98.93 3 5 4.92 98.40 21 20.86 99.33 4 5 4.97 99.40 28 27.88 99.57 5 5 4.86 97.20 35 34.85 99.57 6 10 9.97 99.70 7 6.5 92.86 7 10 9.86 98.60 14 13.89 99.21 8 10 9.88 98.80 21 19.95 95.00 9 10 9.89 98.90 28 27.98 99.93 10 10 9.85 98.50 35 34.89 99.69 11 15 14.96 99.73 7 6.95 99.29 12 15 14.97 99.80 14 13.98 99.86 13 15 14.86 99.07 21 20.95 99.76 14 15 14.92 99.47 28 27.98 99.93 15 15 14.96 99.73 35 34.96 99.89 16 20 19.86 99.30 7 6.96 99.43 17 20 19.87 99.35 14 13.97 99.79 18 20 19.99 99.95 21 20.97 99.86 19 20 19.95 99.75 28 27.96 99.86 20 20 19.96 99.80 35 34.98 99.94 21 25 24.96 99.84 7 6.85 97.86 22 25 24.86 99.44 21 20.91 99.57 23 25 24.92 99.68 28 27.94 99.79 24 25 24.86 99.44 35 34.85 99.57 Mean=99.21 SS=0.720 Mean=99.43 SS=0.68
This study, the statistical parameters were found to produce a satisfactory validity for the PLS and PCR methods. The PLS and PCR methods have reliable accuracy and higher precision.
For calibration the prediction residual error sum-of-squares (PRESS) was calculated as:
∑
==
n iPRESS
1(
C
iadded -2)
found iC
(3) added iC
: True Concentration, additionalconcentration of drug substance
C
iadded : Estimated Concentration, calculate concentration of drug substanceSome statistical parameters determined the effectiveness of the calibration. The standard error of prediction (SEP) was calculated using the following expression: 1 ) ( 1 2 − − =
∑
= n C C SEP n i found i added i (4) added iC
: Actual Concentration, the addedconcentration of drug,
C
iadded : PredictedConcentration, the calculated concentration of drug, n: the total number of synthetic mixtures
According to the actual and predicted concentrations of the samples, SEP and PRESS values of metronidazole and moxifloxacin were calculated and listed in Table 3.
Analysis of real samples: Table 4 lists the
experimental results of the two numerical methods for commercial products and as you can see the obtained results are very close to each other (Avelox and Flagyl).
Table 3 : Statistical parameter values for calibration step- simultaneous determination of metronidazole and
moxifloxacin using partial least square and principal component regression methods.
PARAMETER METHOT METRONIDAZOLE MOXIFLOXACIN
SEP PLS 0.036 0.025 PCR 0.043 0.028 PRESS PLS 0.052 0.0096 PCR 0.064 0.0096
Table 4: Determination of metronidazole and moxifloxacin in commercial products using PLS and PCR
methods. METRONIDAZOLE(GRAM) MOXIFLOXACIN(GRAM) NO PLS PCR PLS PCR 1 0,495 0,496 0,435 0,436 2 0,49 0,492 0,436 0,434 3 0,496 0,497 0,43 0,432 4 0,497 0,493 0,432 0,435 5 0,496 0,495 0,434 0,435 Mean 0,4948 0,4946 0,4334 0,4344 Standard Deviation 0,002775 0,002074 0,002408 0,001517
In this study, chemometric methods can be applied to simultaneously measure spectra data processing based metronidazole and moxifloxacin samples containing mixtures of homogeneously mixed binary drug samples.
In order to compare the performances of the investigated chemometric techniques according to UV spectrophotometric method for real samples we applied Snedecor’s F-test.
The method used to compare the differences between the one-way ANOVA tests was applied to real samples of the drug sample. In this study, F values of Snedecor were calculated and compared with F values (p = 0.05). The ANOVA test results for metronidazole were 0.0014 (PLS) and 0.0020 (PCR). The ANOVA test results for moxifloxacin 0.0013 (PLS) and 0.0017 (PCR). Experimental (calculated) F values did not exceed F-value (4.05) in analysis of variance. This is the result of a meaningful difference between all these methods. All statistical parameters and numerical values are suitable for real-time simultaneous identification.
4. Conclusions
The partial least squares method and the main component regression, which were successfully applied, were able to identify the active ingredients in the synthetic solutions separately. For all values, low prediction errors and high correlation coefficients emphasize the high linear relationship between predicted and actual concentrations. The results obtained with this binary mixture and some ratios of component concentrations indicate excellent prediction ability with these methods.
Acknowledgement: This research work has been
supported by research grants from Süleyman Demirel University Scientific Research Project 4901-YL1-17.
References
ELKADY, E.F., MAHROUSE, M.A., (2011),
Reversed-phase ion-pair HPLC and TLC-densitometric methods for the simultaneous determination of ciprofloxacin hyrochloride and metronidazole in tablets,
Chromatographia, (73), 297-305.
TRAIRATVORAKUL, C., DETSOMBOONRAT, P., (2011), Success rates of a mixtures of
ciprofloxacin, metronidazole and minocycline antibiotics used in the non-instrumentation endodontic treatment of mandibular primary molars with carious
pulpal involvement, International Journal of
Paediatric Dentistry, 1-11.
JAIN, R., JAIN, N., JAIN, D.K., PATEL, V.K., RAJAK, H., JAIN, S.K., (2017), Novel UV
spectrophotometer methods for quantitative estimation of metronidazole and furazolidone using mixed hydrotropy solubilization, Arabian Journal of Chemistry, (10), 151-156.
MAHROUSE, M.A., ELKADY, E.F., (2011),
Validated spectrophotometric methods for the simultaneous determination of ciprofloxacin hydrochloride and metronidazole in tablets, Chem. Pharm.
Bull., 59(12), 1485-1493.
SAHOO, D.R., JAIN, S., (2016), A rapid and
validated RP-HPLC method for the simultaneous quantificiation of benzoic acid, metronidazole and miconazole nitrate in vaginal formulations, Journal of Chromatographic Sciences, 54(9), 1613-1618.
MORCOSS, M.M., ABDELWAHAB, N.S., ALI, N.W., ELSAADY, M.T., (2016), Different
chromatographic methods for simultaneous determination of diloxanide furoate, metronidazole and its toxic impurity, J.Iran
Chem Soc, (13), 1643-1651.
HERNANDEZ-JIMENEZ, A., ROA-MORALES, G., REYES-PEREZ, H., BALDERAS-HERNANDEZ, P., BARRERA-DIAZ, C.E., BERNABE-PINEDA, M., (2016),
Voltammetric determination of metronidazole using a sensor based on electropolymerization of α-Cyclodextrin over a carbon paste electrode,
Electoanalysis, (28), 704-710.
SAGHRAVANIAN, M., EBRAHIMI, M., ES’HAGHI, Z., BEYRAMABADI, S.A., (2017), Experimental sensing and density
functional theory study of an ionic liquid mediated carbon nanotube modified carbon-paste electrode for electrochemical detection of metronidazole, South African
Journal of Chemistry,(70), 29-37.
SULTAN, M.A., (2009), New, simple and validated
kinetics spectrophotometric method for determination of moxifloxacine in its pharmaceutical formulations, Arabian
Journal of Chemistry, (2), 79-85.
AL OMARI, M.M.H., JAAFARI, D.S., AL-SOUOD, K.A., BADWAN, A.A., (2014),
Moxifloxacin Hydrochloride, Profiles of
Drug Substances. Excipients and Related Methodology, (39), 299-420.
ASHOUR, S., BAYRAM, R., (2015), Development
and validation of sensitive kinetic spectrophotometric method for the determination of moxifloxacin antibiotic in püre and commercial tablets,
Spectrochimica Acta Part A: Molecular and Biomolecular Spectroscopy, (140), 216-222. PEKAMWAR, S.S., KALYANKAR, T.M.,
TAMBE, B.V., WADHER, S.J., (2015),
Validated UV-Visible spectrophotometric method for simultaneous estimation of cefixime and moxifloxacin in pharmaceutical dosage form, Journal of
Applied Pharmaceutical Science, 5(01), 037-041.
GOUDA, A.A., AMIN, A.S., EL-SHEIKH, R.,
YUOSEF, A.G., (2014),
Spectrophotometric determination of gemifloxacin mesylate, moxifloxacin hydrochloride, and enrofloxacin in pharmaceutical formulations using acid dyes, Journal of Analytical Methods in
Chemistry, 1-16.
MOTWANI, S.K., CHOPRA, S., AHMAD, F.J., KHAR, R.K., (2007), Validated
spectrophotometric methods for the estimation of moxifloxacin in bulk and
pharmaceutical formulations,
Spectrochimica Acta Part A, (68), 250-256. ATTIMARAD, M., AL-DHUBIAB, B.E.,
ALHAIDER, I.A., NAIR, A.B., HARRSHA, S., AHMED, M., (2012),
Simultaneous determination of moxifloxacin and cefixime by first and ratio first derivative ultraviolet spectrophotometry,
Chemistry Central Journal, (6:105), 2-7. DJURDJEVIC, P., CIRIC, A., DJURDJEVIC, A.,
STANKOV, M.J., (2009), Optimization of
separation and determination of moxifloxacin and its related substances by RP-HPLC, Journal of Pharmaceutical and
Biomedical Analysis, (50), 117-126.
RAZZAQ, S.N., ASHFAQ, M., KHAN, I.U., MARIAM, I., RAZZAQ, S.S., AZEEM, W., (2017), Simultaneous determination of
dexamethasone and moxifloxacin in pharmaceutical formulations using stability indicating HPLC method, Arabian Journal
of Chemistry, (10), 321-328.
KHAN, F.U., HASIR, F., IQBAL, Z., KHAN, I., SHAHBAZ, N., HASSAN, M., ULLAH, F., (2016), Simultaneous determination of
moxifloxacin and ofloxacin in physicological fluids using high performance liquid chromatography with ultraviolet detection, Journal of Chromatography B, (1017-1018), 120-128. RADI, A.E., WAHDAN, T., ANWAR, Z.,
MOSTAFA, H., (2010), Electrochemical
and spectroscopic studies on the interaction of gatifloxacin, moxifloxacin and sparfloxacin with DNA and their analytical applications, Electroanalysis, (22),
2665-2671.
VOSOUGH, M., ESHLAGHI, S.N., ZADMARD, R., (2015), On the performance of multiway
methods for simultaneous quantification of two fluoroquinolones in urine samples by fluorescence spectroscopy and second-order calibration strategies, Spectrochimica
Acta Part A:Molecular and Biomolecular Spectroscopy, (136), 618-624.
FARIA, A.F., SOUZA, M.V.N., ALMEIDA, M.V., OLIVEIRA, M.A.L., (2006), Simultaneous
separation of five fluoroquinolone antibiotics by capillary zone electrophoresis, Analytica Chimica Acta,
(579), 185-192.
USTUNDAG, O., DINC, E., OZDEMIR, N., TILKAN, M.G., (2015), Comparative
application of PLS and PCR methods to simultaneous quantitative estimation and simultaneous dissolution test of zidovudine – lamivudine tablet, Acta Chim. Slov.,
(62),437-444.
SANCHEZ-RODRIGUEZ M.I, SANCHEZ-LOPEZ E.M, MARINAS A, CARIDAD J.M, URBANO F.J, MARINAS J.M, (2014),
New approaches in the chemometric analysis of infrared spectra of extra-virgin olive oils, SORT, 38(2): 231-250.
KENNETH R.B., (1997), Chemometrics: A practical guide, John Wiley & Sons. Inc., New York. BRERETON R.C., (2007), Applied Chemometrics
for Scientists, John Wiley & Sons. Inc.,
New York. Minitab 18 Statistical
Programme
http://www.inovadanismanlik.com.tr/_tu/_u runler/_minitab18/m18.html (10.10.2017)