Tar. Bil. Der.
Dergi web sayfası: www.agri.ankara.edu.tr/dergi
Journal homepage: www.agri.ankara.edu.tr/journal
An Analysis of Cotton Production Technology on the
Harran Plain
Tamer ISGINa, Abdulbaki BILGICa, Seyda IPEKCIOGLUb
a
Harran University, Faculty of Agriculture, Department of Agricultural Economics, Şanlıurfa, TURKEY
b
GAP, Soil-water Resources and Agricultural Research Institute, Şanlıurfa, TURKEY
ARTICLE INFO
Research Article Agricultural Economy
Corresponding author: Tamer ISGIN, e-mail: [email protected], Tel: +90(414) 318 34 74/3718 Received: 19 July 2010, Received in revised form: 14 January 2011, Accepted: 08 Şubat 2011
ABSTRACT
In this research, it was aimed to determine effects of three production factors; labor, capital, and land, on the current level of cotton output produced by a sample of local cotton farmers operating on the Harran Plain in Turkey and whether this relation may be used to assess the returns-to-scale parameter, also known as the function coefficient in the production economics literature. Regression results led us to conclude that among these variables, farm size is found the most influential variable determining cotton output, followed by the variables representing capital and labor as the second and third influential, respectively. In addition, results demonstrated that the returns-to-scale parameter calculated for this sample is significantly greater than unity suggesting that cotton production technology in this region exhibits increasing returns to scale, assuming linear technology.
Keywords: Production Function; Function coefficient; Economies of scale; Heteroscedasticity
Harran Ovasında Pamuk Üretim Teknolojisinin Analizi
ESER BĐLGĐSĐ
Araştırma Makalesi Tarımsal Ekonomi
Sorumlu Yazar: Tamer ISGĐN, e-posta: [email protected], Tel: +90(414) 318 34 74/3718 Geliş tarihi: 19 Temmuz 2010, Düzeltmelerin gelişi: 14 Ocak 2011, Kabul: 08 Şubat 2011
ÖZET
Bu çalışmada işgücü, sermaye ve arazi (işletme büyüklüğü) faktörlerinin, Harran Ovasında faaliyet gösteren pamuk çiftçilerinden çekilen bir örnek üretici kitlesine ait brüt üretim miktarına nasıl tesir ettikleri ve bu ilişkinin, fonksiyon katsayısı olarak da bilinen ölçeğe-getiri parametresinin tahmin edilmesinde nasıl kullanılacağı araştırılmıştır. Regresyon analizinden elde edilen sonuçlara göre, sözü edilen bu faktörlerden işletme büyüklüğünün, pamuk üretiminde en etkili faktör olduğu ve bunu sırasıyla, sermaye ve işgücü faktörlerinin izlediği saptanmıştır. Bununla birlikte, örnek işletmeler için hesaplanan ölçeğe getiri parametresi 1’den büyük olup, lineer ilişki varsayımı altında, bölgedeki pamuk üretim teknolojisi ölçeğe artan getiri özelliği taşımaktadır.
Anahtar sözcükler: Üretim fonksiyonu; Fonksiyon katsayısı; Ölçek ekonomileri; Heteroscedasticity
T
A
R
IM
B
İL
İM
LE
R
İ
D
E
R
G
İS
İ
J
O
U
R
N
A
L
O
F
A
G
R
IC
U
LT
U
R
A
L
S
C
IE
N
C
E
S
16 ( 20 10 ) 25 4 -2 6 1
1. Introduction
Both rapidly developing and ever changing social, economic, and demographic structures and exports in Turkey have led to a rapid increase in demand for textile products, which in turn resulted in an increasing demand for cotton. While annual cotton consumption of Turkey was only about 311,000 tonnes in early 1980s (Pinar et al 1998) it has multiplied over 3 times, exceeding 1 million tonnes in 2008 (USDA 2010). This upward trend in demand for cotton has made Turkey a net importer after 1991, which had been a net exporter in earlier years (Sengul et al 2001). In contrast to the rapid increase in demand, the gap between cotton consumption and production continues to increase.
The Southeastern Region of Turkey, also known as Fertile Crescent or Upper Mesopotamia, has been historically recognized as the cradle of all civilizations in the world. This region is bordered by Syria and Iraq in the South, functioning as a bridge between Anatolian and Mesopotamian terrains, and is home to a highly populated rural community that depends heavily on agriculture for a living. While the sector of agriculture in this region is dominated by crop production, lower elevated flat terrains under irrigation provide suitable conditions for cotton production. One such
area located in the Southeastern Anatolia is the
Harran Plain where cotton is widely grown. In 1995 an area of 20,655 hectares on the Harran Plain was used to grow cotton, delivering a total of 82,603.6 tonnes in production. From 1995 to 2008, these figures have multiplied over five times: the cotton area is grown to be 113,121 hectares and production to be 435,139 tonnes (TURKSTAT 2010).
According to the published literature, yield and quality factors in the Southeastern Anatolia region are at low levels due to farmers’ inefficient production techniques, leading to negative impacts on farmer incomes. In a most recent study of Binici et al (2006) it was found that the majority of sampled farmers from the Harran Plain use inputs at inefficient levels. Moreover, the common practice of over irrigation on the Harran Plain is considered to be the major cause of elevated soil salinity (Cullu 2003), arising from shallow groundwater table (Cullu et al 2002), and leading to considerable
reductions in cotton production (Cullu et al 2000). Thus, the scope for increasing input use levels with a stagnant yield trend is limited, underlying the fact that output growth to meet the growing demand for cotton must rely on improvements in technology and efficiency, an issue that has certain relevance to output elasticities of inputs used in production.
To the best of our knowledge, empirical production economics literature falls short of studies that analyze output elasticities of production factors as an implication for function coefficient. Using a linear regression analysis, Cinemre & Ceyhan (1998) investigated the case for three different farm enterprises; vegetable farms, hazelnut farms, and mix type farms located in the Carsamba district of the Black Sea region of Turkey and found that while the mix type farms and vegetable farms had increasing returns to scale, hazelnut farms demonstrated constant returns to scale. Our analysis runs along similar lines to this study, although with few differences. Unlike Cinemre & Ceyhan (1998), we use a linear type technology with the problem of heteroscedasticity explicitly taken into account. In addition we undertake a different study area and concentrate on a different commodity. Thus, the aim of this research is to estimate output elasticities of inputs used in cotton production and to assess the return-to-scale parameter using data collected from a sample of cotton farmers operating under the irrigated conditions of the Harran Plain in Turkey and test if the study area cotton technology exhibits constant, increasing or decreasing returns to scale.
2. Material and Methods
2.1. Survey design and data
The core materials of this research consist mainly of the information gathered through a questionnaire filled out by face to face interviews with a random sample of cotton farmers operating on the Harran Plain in Turkey. The survey was conducted through the winter and spring seasons of 2004 and 2003 production season was taken as the basis for the study. In this research, participants were asked questions surrounding the matters relating to (1) production characteristics such as size of operation, type of ownership, crop yields, and land
characteristics; (2) farmer characteristics such as gender, age, and education etc.
The sampling was carried out using a two-step process. In the first step 25 villages were selected, which are thought to be representative of the study area in terms of the topography, climate, and commonly applied farming techniques. The sample was drawn from a population of 1,029 cotton farmers operating on the Harran Plain. In the second step, 89 farmers were contacted for an interview, using a stratified random sampling design introduced by Yamane (1967):
∑
∑
= = + = L h h h L h h h S N z d N S N n 1 2 2 2 2 1 ) ( (1)where n is number of farm operators to be sampled (sample size); L is number of strata in the sample; N is number of farmers in population; Nh is number of
farmers falling in the hth stratum; S
h is standard
deviation of farm size in the hth stratum; d is the
percentage error margin allowable from the population mean; and z is the z value from the standardized normal distribution table at this significance level.
The number of farms falling in each size stratum was determined based on their proportion in population. Thus, the sample size n=89 computed using (1) was distributed into its sub-sample sizes, nh, each one corresponding to the relevant stratum
in the sample according to the following proportional distribution: n N N n h h= (2)
Table 1 summarizes the sampling results for the study. A percentage allowable error margin of 8% was taken throughout, delivering a required sample size of 89 cotton farmers to be interviewed to fill out the questionnaire. To be representative of the total population, these sampled farms were divided into four strata. This process leads to a stratifying distribution, yielding 37, 25, 14, and 13 cotton farmers to be sampled in each stratum, respectively. Table 2 summarizes descriptive statistics for variables used in the analysis. The sample farms
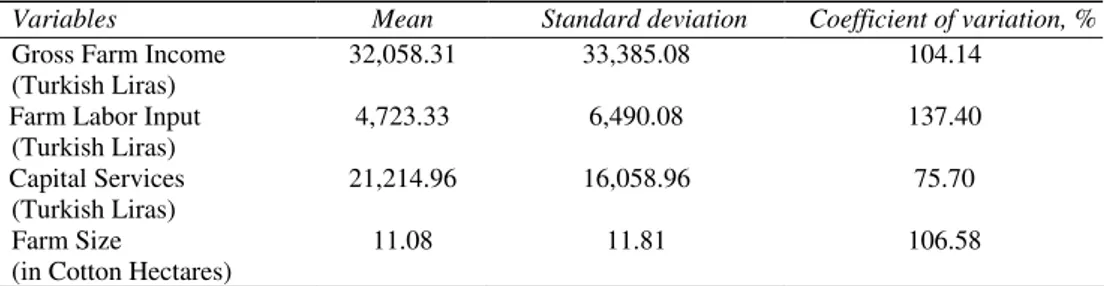
have an average farm size of 11.08 hectares seeded with cotton. This figure is substantially higher than both the regional and national farm size averages of 9.5 and 6.1 hectares, respectively, according to the 2001 Turkish census of Agriculture (TURKSTAT 2010). The capital services comprising the sum of such capital components from machinery, equipment, input supplies, operating expenses and cash holdings averages about TL 21,215 (Annual average exchange rate for US $ in 2003 was TL 1.49). The average farm labor input (including the contributions from family workers) for which the farmer paid in cotton production is TL 4,723. The sample farms have an average gross farm income of TL 32,058 with a variation of about 104 percent, which is quite comparable to those in other variables. The labor input shows the greatest variation (137%) among the other explanatory factors and it is followed by farm size and working capital with variations of 107 and 76%, respectively.
2.2. Econometric model
In our econometric model, gross agricultural income as sales revenue of cotton is the dependent variable used as a proxy for the current technology in the study area for cotton production. On the other hand, the classical three of the production factors, namely farm size, labor, and capital are the explanatory variables presumably thought to have an impact on gross agricultural income and thereby the technology. For the analysis, the following linear production function can explain the relationship between the cotton output and three production factors:
i 0 1 i 2 i 3 i i
GROSS =β + β LABOR +β CAPITAL +β SIZE +ε (3)
where GROSS denotes gross farm income from cotton sales for the th
i
farmer; CAPITAL is theth
i
farmer’s capital costs of agricultural machinery and equipment (depreciation, repair and maintenance etc.), input supplies (fertilizers, pesticides and herbicides etc.), and operating and cash expenses; LABOR includes family and hired labor input used in cotton production by theth
i
farm; and SIZE represents cotton sown area of the thTable 1-The population and the sample drawn Çizelge 1-Anakitle ve çekilen örnek
Farm size strata, ha Number of farmers in population Number of farmers sampled Percent of sampled farmers, % 0.1–5 437 37 41.6 5.1–10 222 25 28.1 10.1–20 218 14 15.7 20.1– + 152 13 14.6 Total 1029 89 100.0
Source: Original computations
Table 2-Descriptive statistics for variables used in the analysis Çizelge 2-Analizde kullanılan değişkenlere ait betimleyici istatistikler
Variables Mean Standard deviation Coefficient of variation, % Gross Farm Income
(Turkish Liras)
32,058.31 33,385.08 104.14
Farm Labor Input (Turkish Liras) 4,723.33 6,490.08 137.40 Capital Services (Turkish Liras) 21,214.96 16,058.96 75.70 Farm Size
(in Cotton Hectares)
11.08 11.81 106.58
Source: Derived from the survey data.
The random disturbance, ε, is assumed to be an independently and identically distributed normal random variable with mean zero and variance, σ2. Whereas SIZE variable is expressed in ha, the variables of GROSS, CAPITAL, and LABOR are expressed in terms of Turkish Liras.
Production elasticity with respect to a particular production factor measures the proportional change in output resulting from a given proportional change in that factor when other factors are held constant (Beattie & Taylor 1993). From the econometrics viewpoint, individual production elasticities with respect to each factor are computed at the mean values upon estimating the model parameters (Pindyck & Rubinfeld 1991). For this particular production function given in (3), the output elasticity of each input may be calculated as
1 ˆ1 1 E =β (X Y ), (4) 2 ˆ2 2 E =β (X Y ), (5) 3 ˆ3 3 E =β (X Y ), (6)
where Y stands for the dependent variable GROSS; and X1, X2, and X3 denote the explanatory variables
LABOR, CAPITAL and SIZE, respectively.
The sum of these production elasticities with respect to each factor is just as important as themselves individually because this summation is an indication of the returns-to-scale parameter, also known as the function coefficient in production economics. When the sum of individual elasticities is greater than unity, the production function has increasing returns to scale whereas it has decreasing returns to scale if the summation is less than unity. When the sum of these individual production elasticities exactly equals unity the production function has constant returns to scale (Debertin 1993).
In order to test the sum of production elasticities, we run a statistical test based on two hypotheses: one is the null hypothesis that the sum of production elasticities is equal to unity versus the alternative hypothesis that this summation is different from unity such that
0 1 2 3
1 1 2 3
H : E +E +E =1
H : E +E +E ≠1 (7)
We solve the condition under the null hypothesis in (7) for
β
ˆ
3 to yield:3 2 2 3 1 1 3 3 ˆ ˆ ˆ X X X X X Y
β
β
β
= − − (8)Substituting equation (8) into the original model of production technology given in equation (3), we arrive to the following restricted specification:
− + − + = − i i i i i i X X X X X X X X X X Y Y 3 3 2 2 2 3 3 1 1 1 0 3 3 β β β (9)
Estimating the restricted model in (9) we can test if the restriction on the model parameters in (3) under the null hypothesis of constant returns to scale is supported by the data, i.e., we want to test the null hypothesis that the summation of individual production elasticities is equal to one. This test is equivalent to testing whether or not the difference from unity, if any, is statistically significant at an appropriate significance level. This involves using a test statistic defined as:
[
]
(
ESS -ESSR UR /q)
(
ESSUR/ N-k[
]
)
~ Fq,N-k,which follows an F-distribution with q degrees of freedom in the numerator and N-k in the denominator where ESS stands for the error sums of squares derived from the restricted (R) and unrestricted (UR) models in equations (9) and (3), respectively, q is being the number of restrictions (happens to be 1 in this case), and k, the number of parameters including the intercept (Pindyck and Rubinfeld 1991).
2.3. Heteroscedasticity correction
The importance of homoscedasticity consistent estimates is well established in the literature and thus we will avoid providing a detailed discussion here to save the space. It is recognized that statistical inference drawn from inefficient model estimates due to heteroscedasticity problem will be misleading (Pindyck & Rubinfeld 1991). Our study results suggest that there was a problem of heteroscedasticity encountered in estimating the model given in (3) using ordinary least squares (OLS). This conclusion directly follows from a Breusch-Pagan test statistic calculated to be high enough (78.05) to reject the null hypothesis of homoscedasticity at an appropriate significance level, e.g., 5% or 1%. Therefore, a correction for heteroscedasticity was carried out using a Generalized Least Squares estimation technique,
particularly weighted least squares (WLS). This procedure guarantees that all the parameter estimates, standard errors, and test statistics computed from the WLS model are consistent with the homoscedasticity assumption, and reliable for that matter.
Applying the standard heteroscedasticity correction procedure described in Pindyck and Rubinfeld (1991), we use the following transformed model in place of the original linear model in equation (3)
(
W Y = β W +β W X +β W X +β W X +Wεi i)
0 i 1(
i 1i)
2(
i 2i)
3(
i 3i)
i i (10)where Y, X1,X2, X3represent the variables GROSS,
LABOR, CAPITAL and SIZE, respectively; and
,
i
ε
stands for the random disturbance term as denoted before. W is the weighting factor calculated asW
=
1
/
σ
ˆ
iwhere we obtainσ
ˆ
i'
s
using the Glejser regression method based on individual error terms coming from the original heteroscedastic model in (3). Then, the restricted model in (9) slightly modifies to:* * * * * i 0 1 1i 2 2i i Y = β +β X +β X +ε (11) where,
(
)
(
)
(
)
* i i i 3 3i * 1i i 1 i 1 3 i * 2 i i 2i 2 3 i * * 0 0 i i i i Y = W Y - W Y W X X (1 2 ) X = W X - W X W Y X (1 3 ) X = W X - W X W Y X (1 4 ) β = β W , an d ε = W ε (1 5 ) We will calculate and preserve the error sums of squares obtained from these unrestricted and restricted models in (10) and (11), respectively, and use them to test the null hypothesis that the study area production function has constant returns to scale.
3. Results and Discussion
The model estimation revealed that the variables of LABOR, CAPITAL, and SIZE explained 92.7 percent of the variation in cotton output named as GROSS. Estimating the model parameters with heteroscedasticity correction yielded much better results in terms of the reliability of computed test
statistics. Results from the heteroscedasticity corrected model shown in Table 3 demonstrate that a high proportion (92.9%) of the variation in GROSS can be explained by the variation in explanatory variables. Results also show that all the parameters estimated using WLS are statistically significant at varying levels (1% or 5%).
The dependent variable GROSS is hypothesized to be an increasing function of the explanatory variables. Estimation results show that the hypotheses constructed for the explanatory variables are supported, as evidenced by the expected positive signs on the coefficients of these variables (Table 3). It should be noticed that both OLS and WLS models offer consistency in this respect.
All three production factors, i.e., land, labor and capital appear to be the major determinants of gross farm income from cotton production. However, land remains the single most important factor with an output elasticity of 0.88 followed by capital at 0.17 and labor at 0.06, respectively. Due to labor surplus Turkish economy, LABOR has the lowest production elasticity in the model. We found that the summation of these production elasticities equals 1.11, which indicates increasing returns to scale for the linear cotton technology studied. Following the guidelines given in the methodology section and using the error sums of squares obtained from the unrestricted and restricted model results shown in Tables 3 and 4, respectively. It was constructed the F-statistic to be used to test if this deviation from unity is statistically significant.
For the numbers of degrees of freedom as stated, the critical values of the F-distribution are 2.77, 3.95 and 6.94 for the significance levels of 10, 5, and 1%, respectively. We observe that the computed F-statistic of 10.28 is higher than these critical values for all significance levels. This finding leads to the conclusion that we reject the null hypothesis of constant returns to scale for the technology under study. Given this conclusion, increasing returns to scale are what characterize the production performance of the cotton farms studied on the Harran Plain under the assumption of linear technology. Thus, when all factors are increased proportionally, an increase of a greater magnitude
in cotton output is expected. For example, when all factors are increased by an amount of 10% proportionally, gross agricultural income from cotton sales is expected to increase at a rate 11.1%.
Given that this sample consists mainly of small farm enterprises, one would not expect that the study area cotton production exhibits diseconomies of scale. This expectation is in fact reasonable since previous studies on agricultural productivity in developing countries support an inverse relationship between farm size and productivity (Bery & Cline 1979; Barrett 1996; Helfand et al 2004; Grabowski et al 1990; Binici et al 2006). Even though different findings are available in the literature (e.g., Townsend et al 1998), similar results in Turkey are reported by Cinemre & Ceyhan (1998), i.e., using a linear technology, they found that mix type farms and vegetable farms demonstrate increasing returns to scale. In spite of differences in study area and commodity, what we found in this analysis is consistent with these literature findings and so increasing returns within this sample seem to be reasonable for a developing country like Turkey.
4. Conclusions
The model developed here proves useful understanding the changes in cotton output by means of the three explanatory variables, i.e., labor, capital, and farm size. All the regression coefficients are found statistically significant. Dwelling on these regression results as well as the production elasticities, we ascertain that among these variables, farm size was found as the most influential variable determining cotton output, followed by the variables representing capital and labor, respectively.
The results indicate that the sample cotton farmers in the studied area operate under increasing returns to scale, assuming linear technology. Relying on such evidence, there is an obvious need to develop local agricultural policy instruments targeting measures that improve farm capital and especially land acquisition, which in turn will translate into thriving local agricultural economics.
Table 3-Results from the linear models (OLS versus WLS estimates - Harran Plain Data, 2003) Çizelge 3-Lineer modellere ait sonuçlar (OLS ve WLS tahminleri - Harran Ovası verileri, 2003)
a Dependent variable is GROSS, i.e., gross sales from cotton production. b For WLS (weighted least squares) model, all variables are multiplied by the weighting factor W as explained in the Heteroscedasticity Correction section. c Single and double asterisks (*) denote significance levels of 10% and 5%, respectively whereas triple asterisks represent 1% significance level. OLS stands for ordinary least squares.
Table 4-Restricted weighted least squares model results Çizelge 4-Kısıtlanmış tartılı en küçük kareler modeli sonuçları
Restricted WLS Estimates Variables Coefficient t-value INTERCEPT -2076.59185** -2.14 X1STAR 0.11614 0.62 X2STAR 0.11873** 2.36 R2 ESS 0.0794 716132 a
Dependent variable is the modified gross cotton sales whereas X1STAR and X2STAR
stand for the modified versions of the variables LABOR and CAPITAL, respectively, as in equation (6).
Acknowledgement
The data used in this paper have been furnished by a research project conducted at the University of Harran with project number: HUBAK 386. We would like to thank all the survey participants for taking their time to fill out our tedious questionnaire.
References
Barrett C B (1996). On price risk and the inverse farm
size–productivity relationship. Journal of
Development Economics 51(2):193–216
Beattie B R & Taylor C R (1993). The Economics of Production., Krieger Publishing Co Malabar, Florida Bery A R & Cline W R (1979). Agrarian Structure and
Productivity in Developing Countries., The Johns Hopkins University Press, Baltimore
Binici T, Zulaf C, Kacira O & Karli B (2006). Assessing the efficiency of cotton production in Harran Plain, Turkey. Outlook on Agriculture 35(3): 227–233 Cinemre H A & Ceyhan V (1998). Functional analysis of
agricultural income on agricultural farms of Carsamba Province (in Turkish). Turkish Journal of
Agriculture and Forestry 22: 241–250
Cullu M A (2003). Estimation of the effect of soil salinity on crop yield using remote sensing and geographic information system. Turkish Journal of
Agriculture and Forestry 27(1): 23–28
Cullu M A, Celik I & Almaca A (2000). Degradation of the Harran Plain soils due to irrigation. SSST
Proceedings of International Symposium on
Desertification, Konya, Turkey
Cullu M A, Almaca A, Sahin Y & Aydemir S (2002). Application of GIS for monitoring soil salinization in the Harran Plain, Turkey. SSST International
OLS estimates
Weighted least squares estimates
Variables Coefficient t-value Coefficient t-value Elasticities INTERCEPT -1071.67025 -0.64 -1747.94548* -1.88 --- LABOR 0.51733*** 2.98 0.40728** 2.04 0.05966 CAPITAL 0.14626** 2.08 0.17560*** 3.44 0.16761 SIZE 2490.29115*** 25.76 2538.20931*** 24.07 0.88228 R2 ESS B-Pagan 0.9273 7126412970 78.05 0.9285 Σe= 1.10955 638846 (Homoscedastic)
Conference on Sustainable Land Use and Management, Canakkale, Turkey
Debertin D L (1993). Agricultural Production Economics (second edition). Kentucky University Press, Kentucky
Grabowski R, Kraft S, Pasurka C & Aly H Y (1990). A ray-homothetic frontier and efficiency: Grain farms in Southern Illinois. European Review of Agricultural
Economics 17(4): 435–448
Helfand S M & Levine E S (2004). Farm size and the determinants of productive efficiency in the Brazilian center-west. Agricultural Economics 31: 241–249 Pinar M, Akyil N, Er S & Erturk Y E (1998). Cotton
Status and Projection Report 1997-1998 (in Turkish). Agricultural Economics Research Institute No: 2, Ankara, Turkey
Pindyck R S & Rubinfeld D L (1991). Econometric Models and Economic Forecasts (Third Edition), McGraw-Hill Inc, New York
Sengul H, Koc A, Akyil N, Bayaner A & Fuller F (2001). Cotton Market in Turkey: Evaluating the factors that affect future demand (in Turkish). Agricultural Economics Research Institute, Project Report No: 49, Ankara, Turkey
Townsend R, Kirsten J & Vink N (1998). Farm size, productivity and returns to scale in agriculture revisited: A case study of wine producers in South Africa. Agricultural Economics 19: 175–180
TURKSTAT (2010). Turkish Statistical Institute. Available: http://www.turkstat.gov.tr
USDA (2010). Available: http://www.fas.usda.gov /psdonline/psdQuery.aspx
Yamane T (1967). Elementary Sampling Theory. Englewood Cliffs, NT: Printice Hall