~
Pergamon
0014-3057(94)E0004-N Eur. Po(vm. J. Vol. 30, No. 7, pp. 845 850, 1994 Copyright (i3 1994 Elsevier Science Ltd Printed in Great Britain. All rights reserved 0014-3057/94 $7.00 + 0.00C H A R A C T E R I Z A T I O N O F D E G R A D A T I O N P R O D U C T S O F
P O L Y E T H Y L E N E O X I D E BY P Y R O L Y S I S
M A S S S P E C T R O M E T R Y
M. M. FARES, 1 J. HACALOGLU j* a n d S. SUZER 2
*Faculty of Arts and Science, Chemistry Department, Middle East Technical University, 06531 Ankara, Turkey
2Chemistry Department, Bilkent University, 06533 Ankara, Turkey
(Received 26 May 1993; accepted 8 September 1993)
Abstract--The techniques of direct and indirect (evolved gas analysis) pyrolysis MS are used to characterize the thermal degradation products of polyethylene oxide. Using direct pyrolysis MS technique the main degradation process is determined to be due to C ~ and C ~ C scissions yielding fragments characteristic of the polymer. Evolved gas analysis indicates formation of small molecular stable compounds such as C2H•OCzH 5, CH3CHO, CO,, CO and C2H 4.
INTRODUCTION
Polyethylene oxide, PEO, is a t o u g h ductile highly crystalline t h e r m o p l a s t i c a n d is readily soluble in water. It is finding increasing c o m m e r c i a l use [1, 2] in the f o r m o f disposable l a u n d a r y bags, p a c k a g i n g for agricultural seeding, h a z a r d o u s dyes a n d detergents, c h r o m a t o g r a p h i c s t a t i o n a r y p h a s e s a n d wet-track ad- hesives. It is also used as a c o n d u c t i n g m e d i u m in light weight energy density batteries [3]. A l t h o u g h , chemi- cal a n d physical characteristics o f P E O h a v e been extensively studied, only few r e p o r t s a b o u t t h e r m a l [1,4, 5] or t h e r m o - o x i d a t i v e [6, 7] stability a n d degra- d a t i o n a p p e a r e d in the literature.
T h e r m a l d e g r a d a t i o n o f polymers have been studied with different techniques; differential s c a n n i n g c a l o r i m e t r y [5, 6], t h e r m o gravimetric m e t h o d [1, 4], t h e r m a l volatilization analysis [8], d y n a m i c m e c h a n - ical t h e r m a l analysis [2], pyrolysis, evolved gas analy- sis [9-13] by i.r., M S or GC. H o w e v e r m o s t o f the c o m m o n l y used t h e r m a l analysis m e t h o d s can n o t give any i n f o r m a t i o n a b o u t the chemical n a t u r e o f the d e g r a d a t i o n products. Recently pyrolysis p r o d u c t s o f several p o l y m e r s by i.r. a n d M S have been studied in o u r l a b o r a t o r y [9-11]. N o w , we r e p o r t results ob- tained by a m o r e direct pyrolysis t e c h n i q u e applied to analyze t h e r m a l d e g r a d a t i o n p r o d u c t s o f PEO.
EXPERIMENTAL
PROCEDURES
Standard PEO homopolymer with M w of 9 x 10⁵ and 4 × 10⁶g.mol -~ were obtained from Aldrich chemical company, in direct pyrolysis experiments, 20pl 1% (w/v) PEO~thyl alcohol solution was placed inside the sample holder and the solvent was evaporated to dryness at room temperature. In direct pyrolysis (evolved gas analysis) experiments 10 mg samples were used.
For direct pyrolysis experiments, a probe (Fig. 1) that can be inserted directly inside the mass spectrometer through a
*To whom all correspondence should be addressed.
valve that allows differential pumping of the probe inlet line was designed. It is basically composed of a stainless steel tube connected to a copper assemble carrying the copper sample holder. A heater is placed inside the stainless steel tube, and a thermocouple is connected to measure temperature.
The system used for evolved gas analysis was similar to the one described in our previous studies [9, 10]. Simply it con- sists of an oven, a pyrex reactor chamber and a needle valve which is connected to the mass spectrometer.
Duplicate runs indicated high reproducibility of the tech- niques used. The mass spectrometer was Balzers QMG 311 quadrupole mass spectrometer conected to a personal computer for the control of the MS, data acquisition and analysis.
RESULTS AND DISCUSSION Direct pyrolysis analysis
T h e r m a l d e g r a d a t i o n p r o d u c t s o f P E O (M~, = 9 × 1 0 5 g - m o l - j ) were studied by recording mass spectra as a f u n c t i o n o f t e m p e r a t u r e . The t e m p e r a t u r e was increased to 120 ° rapidly a n d t h e n the sample was h e a t e d at a rate o f 15°/min until the t e m p e r a t u r e reached 210 °. Finally the rate o f heating was de- creased to l ° / m i n a n d k e p t c o n s t a n t .
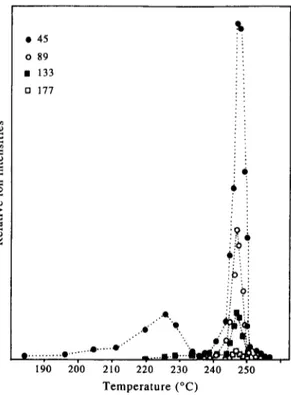
The peak o f 45 a.m.u, was the first t h a t a p p e a r e d at 140 '~ a n d increased slowly until it reached a m a x i m u m o f 222 ° . T h e n it nearly d i s a p p e a r e d a r o u n d 230 ° . A t 2 3 5 it a g a i n s h o w e d up t o g e t h e r with the peaks related to d i m e r (m/z = 89 a.m.u.), t r i m e r (m/z = 133 a.m.u.), t e t r a m e r (m/z = 177 a.m.u.), p e n t a m e r (m/z = 221 a.m.u.) a n d h e x a m e r (m/z = 265a.m.u.). Ion yields increased rapidly a n d reached their m a x i m u m values at 248 ° a n d disap- peared totally at 254 ° . Thus, it can be c o n c l u d e d t h a t the d e g r a d a t i o n o f the p o l y m e r m a i n l y occurred at 235-255 ° range. T h e m a i n peaks observed in the mass spectra represent C H 3 C H E O ( C H 2 C H 2 0 ) , +, C H 3 C H 2 0 ( C H 2 C H 2 0 ) , C H ~ a n d C H 3 C H 2 0 - ( C H 2 C H 2 0 ) , C H 2 C H f f r a g m e n t s where n = 0 - 6 . Relatively weaker peaks due to h y d r o g e n losses f r o m
846 M.M. FARES et al.
r o
/
Stainless s t e e l t u b e
Fig. 1. Pyrolysis probe. Heater
--- Thermocouple
• l~ I ./Sample holder
I ~ ~ - - C o p p e r assemble
Ag
these main fragments were also present. The base peak was the monomer peak at 45 a.m.u., CH3CH20 +, throughout the experiment at any temperature. Rela- tive intensities of the main peaks decreased as the chainlength increased. Variation of intensities of peaks related to monomer, dimer, trimer and tetramer as a function of temperature are given in Fig. 2. In general stability of a radical fragment decreases with chain length. The experimental observations are in accord- ance with this fact. However, one should also consider the fragmentation of the degradation products in the ion source of the mass spectrometer. Ionization of the thermal decomposition products with energetic elec- trons will cause further fragmentation which in turn results in considerable increase in the relative abun- dances of the low mass ions.
"¢~H 3 CH20(CH2 CH20)n CH2 CH20 ~''x
CH3 CH20(CH2 CH20)~
CH3CH20(CH2CH20)~ + e-
--,CH3 CH20(CH2 C H 20) + where n > m
In order to investigate the extent of fragmentation in the mass spectrometer, analysis of pyrolysis products of the same sample were carried out at different electron energies; 65, 50, 40, 30 and 20 eV. In all these experiments degradation occurred at the same temperature range (235-255 ° ) revealing the high reproducibility of the pyrolysis technique used. In Fig. 3, mass spectra recorded at 248 °, corresponding to maximum product yield temperature, using 65, 50, 40, 30 and 20 eV electrons are plotted. It can be observed from the figure that relative intensities of the higher mass peaks increased noticeably as the electron energy decreased. The base peak shifted to mass 89 a.m.u. (dimer) and relative intensities of higher mass frag- ments increased compared to the monomer peak. A three fold increase in case of dimer and tetramer and about a four fold increase in case of trimer and pentamer were observed (Table I). Identical
increases in relative intensities of the peaks related to CH3CH20(CH2CH20),CH ~ and CH3CH20- (CH2CH20),,CH2CH ~ ions were also detected.
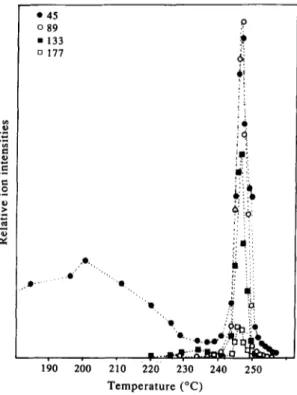
The variation of intensities of peaks related to monomer, dimer, trimer and tetramer as a function of temperature recorded at 20 eV are shown in Fig. 4. A very similar trend in degradation of the polymer as a function of temperature can be observed from the figure. But notice also the differences in the relative intensities. Although the relative intensity of the peak at 45 a.m.u, decreased above 230 °, it considerably
.=. • 4 5 O 89 • 133 n 177 . .
... .. :....
• . . . • . . . _ . . . . , , . . i . . . t d P l z ~ . - , U k S ~ n ~ ,i~0
2~0
",io 2:i0 2~0 ",~.0 2~0
Temperature (°C)Fig. 2. Variation of intensities of peaks at 45, 89, 133, 177 a.m.u, as a function of temperature at ionization energy
C h a r a c t e r i z a t i o n o f d e g r a d a t i o n p r o d u c t s b y p y r o l y s i s M S 847 4.P 45
.,.., ,.. ,I,., ...
i |,.d,l,l,II
|,,,IL,J,,,I
,,,,,
i... ,,Fl,,,,,,,,,,,
!... ,,,,11,,,,,,,,,I
I 20 I ....,hhi I 89 1 3 3 I 2 0 e V 1 7 7 ,, ... ,,Ib ... ,dl ... ,ill ... I • I ' h n H n l l l I] I,,,,,,,,,,,I,,,,,,,,,,,,,I,
1 I... ,,,
v 30©V',
... I, ... ,,I, ... ,,II. ... I ' ' I ' ' 4 0 ¢ V... ,,,L, ... , ... , ... , ...
I ' I ' I ' ' I ' • I ' 5 0 ¢ VI, ...
,,,lll,...,.,,,,,I
I ' ' I -' " I ' ' I ' ' 6 0 c V... ,,,,,11 ,,,,,
,,ill, ...
,,,L
I | ' 50 80I
I
I ' ' I ' ' I ' ' l l 0 140 170 200 mlz Fig. 3. M a s s s p e c t r a o f p y r o l y s i s p r o d u c t s o f P E O a t 2 4 8 ' a t v a r i o u s e l e c t r o n e n e r g i e s .848
Table
M. M. FARES et al.
1. Relative intensities of CH~CH~O(CH2CH~O) ~ , C H 3 H 2 0 ( C H 2 C H 2 0 ) . C H ~-
CH3CH20(CH2CH20).CH2CH~- ions at various electron energies at 2 4 8
and Relative intensity
Peak Electron energy
(a.m.u.) 65 eV 50 eV 40 eV 30 eV 20 eV Assignment 45 1000 1000 1000 1000 950 C H 3 C H 2 0 + 59 305 330 273 351 364 CH3CH2OCH2 + 73 340 390 350 527 709 CH3CH 2 O C H 2 C H ~ 89 383 473 464 755 1000 C H 3 C H 2 O C H 2 C H 2 0 + 103 112 130 118 221 294 C H 3 C H 2 O C H 2 C H 2 O C H ~ 117 117 147 150 284 446 C H 3 C H 2 0 C H 2 C H 2 O C H 2 C H 2 + 133 140 180 189 383 607 CH3CH20(CH2CH~O)2 + 147 24 28 27 60 84 C H 3 C H 2 0 ( C H 2 C H 2 0 ) 2 C H ~ 161 17 21 23 50 79 CH3 CH20(CH2CH2 O)2 CH2 C H + 177 24 29 33 67 84 C H 3 C H 2 0 ( C H 2 C H 2 0 ) ~ 191 2 2 4 4 6 C H 3 C H 2 0 ( C H 2 C H 2 0 ) 3 C H ~ 205 1 2 2 4 5 CH3CH20(CH2CH20)3CH2CH ~ 221 2 2 3 4 7 C H 3 C H 2 0 ( C H ~ C H 2 0 ) ; 235 1 1 1 I 1 C H 3 C H 2 0 ( C H 2 C H 2 0 ) 4 C H ~ 249 1 1 1 I 2 CH3 CH20(CH2 CH20)~ CH2 CH ~ 265 1 I t 1 I CH3CH20(CH2CH20)5 ~ 279 I 1 1 1 I C H 3 C H 2 0 ( C H 2 C H 2 0 ) s CH ~
increased at the low energy range. No other peak above 45 a.m.u, was detected at this temperature range. It has been known the PEO is susceptible to marked free radical oxidative attack during storage at ambient temperatures [2] and to formation of many oxygenated products. Thus peak at 45 a.m.u, observed at low temperature range may be attributed to an oxidative degradation product of PEO absorbed on the polymer. Furthermore it may be concluded that degradation of the polymer does not start below 220 ° . Sudden increase in the total ion current above 230 ° indicated that thermal decomposition of the polymer had started. All the peaks observed showed a very similar trend in 225-255 ° range.
e., o ,¢ • 45 o 89 9 • 133 n 177 6~ ID . . .
,~0 26o
. 0 . . • 0 .•. -.•...• id, ,c ~:~'o
:!!i, .
/ ~ ::i~,
.,..~,-.-~'.~i;.,4 . ~ .
210 220 230 240 250 Temperature (°C)Fig. 4. Variation of intensities of peaks at 45, 89, 133 and 177 a.m.u, as a function of temperature at ionization energy
of 20 eV.
These results indicate that decomposition of the polymer is possible at any point along the chain.
I I I
I I IIII I I I I
It has been postulated that degradation of pure PEO should initiate by random C - - O and C---C scissions and that the radicals formed may depolymerize evolv- ing volatile components such as ethylene, formal- dehyde and acetaldehyde [1]. Thus the peaks observed in the spectrum at low ionization energies (20 eV) are directly related to thermal decomposition products. It is also noted that, the relative intensities of the main ions decreased in the order of
C H 3 C H 2 0 ( C H 2 c n 2 O ) +
> CH3CH20(CH2CH20)~ _ j CH2CH~ > Ell3 CH20(CH2CH2 O). _ I CH~.
It has been shown that polymers containing oxygen in the main chain tend to degragate more readily than those containing only carbon atoms in their back- bone [6, 14]. This is expected on the bases of car- bon-oxygen and carbon-carbon bond energies. Thus it can be concluded that cleavages of the polymer chain next to the oxygen atom at I and II positions are more significant during thermal degradation of PEO.
Experiments were repeated using 4 x 10⁶g • m o l - ' PEO samples. The very identical results obtained indicated that the technique used, although not sensi- tive to molecular weight of the polymer under inves- tigation, at least in this molecular weight range, gives reproducible results.
Evolved gas analysis
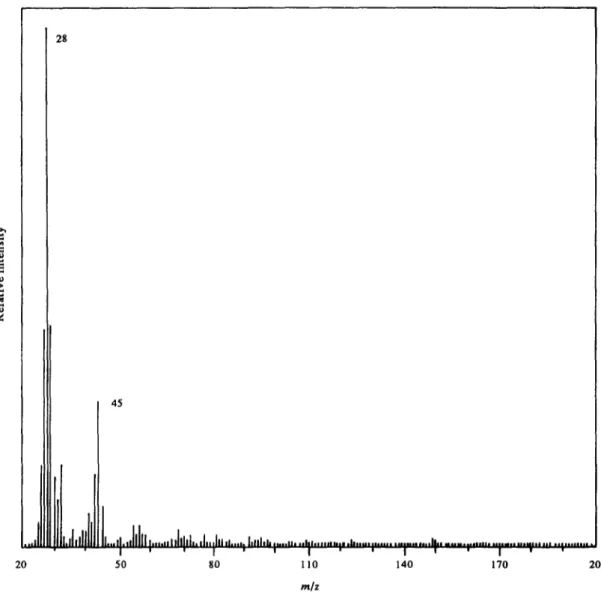
In evolved gas analysis, peaks due to pyrolysis products started to appear after the oven temperature reached 200 ° . Total ion yield continuously increased and reached its maximum value at 280 ° . The mass spectrum recorded at this temperature is given in Fig. 5. No ion above 100 a.m.u, was observed at any time during the experiment at any temperature. Thus it
Characterization of degradation products by pyrolysis MS 849 2 8 45 I ' ' I ' I I ' I J ' I ' ' 20 50 80 110 140 170 200 m/z
Fig. 5. Mass spectrum of indirect pyrolysis products of PEO at 280 °.
can be concluded that only stable, volatile low- molecular weight products could reach the ion source under the experimental conditions. The base peak was at 28 a.m.u, throughout the experiment. Strong peaks at 31,44, 45, 55, 59, 73, 81 and 96 a.m.u, were detected. Variation of intensities of the peaks as a function of
temperature indicated that peaks at 96, 81 and 55 a.m.u, and 73, 59, 45 and 31 a.m.u, were inter- related.
Peaks at 96, 81 and 55 a.m.u, may be attributed to an unsaturated cyclohexanone that would give rise to these peaks by the following mechanism [ 15]:
O + O
Ii
Ill
C C H2C/[ \CH2[ + e - ~ H2C i~,..jH-~H HC\\ z.CH2 HC\,, .,CH 2 CH CH (96 a.m.u.) O +Ill
C x H3C "CH [ I ~ C H 2 " - - ' C H ~ C ~ O + + C3H 5 HC\ x z CH2 (55 a.m.u.) CH H C ~ C H ~ C ~ O + II II HC ~ CH 2 + CH 3 (81 a.m.u.)850 M . M . FARES et al.
The presence of peaks at 31, 45, 59 and 73 a.m.u. can be related to C H 3 C H 2 O C H 2 C H 3 molecule which will yield C H 3 C H 2 O C H 2 C H ~ ' , C H 3 C H 2 O C H ] , C H 3 C H 2 0 + and C H 2 0 + ions at the observed m / z values. However the trends in ion yields of peaks at 59, 45 and.31 as a function of temperature indicate that these peaks should be also due to another stable molecule, most probably C H 3 C H 2 O C H 3.
Low mass peaks at 44, 31 and 28 a.m.u, can be also directly assigned to C H 3 C H O and CO2, C H 2 0 , C O and C2H 4 respectively with the use of literature data [1].
CONCLUSION
The direct pyrolysis technique used gives
diagnostic data related to the polymer sample under investigation. Degradation of P E O occurred at the temperature range 235-255 ° by both C - - O and C ~ C scission, products due to C - 4 3 cleavages being more abundant. Peaks related to degradation products upto six m o n o m e r units were detected. The main degradation products are C H 3 C H 2 0 ( C H 2 C H 2 0 ) .- C H 2 C H f , C H 3 C H 2 0 ( C H 2 C H 2 0 ) n C H f and C H 3 C H 2 0 ( C H 2 C H 2 0 ) ~ + where n = 0 - 6 . However with the use o f evolved gas analysis technique by mass spectrometry, an indirect pyrolysis method, only low molecular weight volatile products such as CO2, C H 2 0 , C H 3 C H O and (CH3CH2)20 could be identified. A large variety o f molecules might be produced in the reactor during pyrolysis. These thermally stable components may not even be directly related to the sample under study. Thus the spectra obtained are much complicated but less characteristic compared to those recorded in the case o f direct
pyrolysis. Therefore the direct pyrolysis MS
technique should be preferential especially for structural analysis whereas indirect pyrolysis can be
applied to investigate stable degradation products of a polymer sample.
Acknowledgment--We acknowledge financial support provided by METU through the research Grant No. AFP- 92-01-03-01.
REFERENCES
I. N. Grassie and A. Perdomo Medoza. Polym. Deg. Stab. 9, 155 (1984) and C. G. Cameron, M. D. Ingram, M. Y. Qureshi, H. M. Gearing, L. Costa and G. Camino. Eur. Polym. J. 25, 779 (1989).
2. S. W. Bigger, J. Scheirs, O. Delatycki and N. C. Billingham. Polym. Int. 26, 181 (1991) and references cited therein.
3. D. G. H. Ballard, P. Cheshire, T. S. Mann and J. E. Prezeworski. Macromolecules 23, 1256 (1990). 4. E. Clahorra, M. Cortazar and G. M. Guzman.
J. Polym. Sci.; Polym. Lett. Edn 23, 257 (1985). 5. Y. Nishio, N. Hirose and T. Takahashi. Polym. J. 21,
347 (1987).
6. J. Scheirs, S. W. Bigger and O. Delatycki. Polymer 32, 2014 (1991).
7. A. M. Afifi-Effat and J. May. Eur. Polym. J. 8, 289 (1972).
8. I. C. McNeil. Eur. Polym. J. 3, 409 (1967); 6, 373 (1970); I. C. McNeil and M. A. J. Mohammed. Eur. Polym. J. 8, 975 (1972).
9. M. Erdogan, T. Yalcin, T. Tincer and S. Suzer. Eur. Polym. J. 27, 413 (1991).
10. B. Ozden, T, Yalcin and S. Suzer. J. Molec. Struc. 267, 135 (1992).
1 I. T. Yalcin, U. Akbulut and S. Suzer. Macromol. Reports A30, 55 (1993).
12. H. Schulten, N. Simmleit and R. Muller. Analyt. Chem. l, 221 (1989).
13. H. Ohtani, T. Yuyama, S. Tsuge, P. Plage and H. R. Schulten. Eur. Polym. J. 26, 93 (1990).
14. H. Vink. Macromolec. Chem. 67, 105 (1963). 15. R. Dawis and F. Freason. Mass Spectrometry. John