DEM analysis of passive failure state behind a rigid retaining
wall: effect of boundary conditions
Adlen Altunbas1,*, Behzad Soltanbeigi2 and Ozer Cinicioglu3
1Department of Architecture, School of Fine Arts, Design and Architecture, Istanbul Medipol University, Istanbul, Turkey 2Institute for Infrastructure & Environment, School of Engineering, University of Edinburgh, UK
3Department of Civil Engineering, Bogazici University, Istanbul, Turkey
Abstract. Discrete Element Modelling (DEM) is a virtual testing method that enables multiscale studies on granular materials. DEM provides a well-controlled testing environment, which enables precise systematic evaluation of the factors influencing the bulk response. The current study focuses on the behaviour of cohesionless backfills while a passive state of stress is simulated (i.e. rigid retaining wall translates toward backfill). Though particle-scale properties (e.g. size, shape and cohesion) play an important role on the macro response, the main objective in this study is to highlight the extent by which boundary conditions are important. Thus, identical dense packings are subject to the following boundary conditions: smooth/rough retaining wall and smooth/rough/periodic sidewalls (necessary for maintaining plain-strain conditions). Based on the DEM results, the failure surface geometries, wall pressure distribution and dilative response of the specimens are evaluated. It is seen that a curvilinear slip surface, similar to that observed in experiments, is only obtained once a rough retaining wall and periodic sidewalls are available. The overall observations suggest that the mobilisation of the passive state of stress, for a cohesionless granular assembly, is highly sensitive to the considered various boundary conditions.
1 Introduction
Retaining walls are designed for various applications, such as: flood or avalanche prevention barriers, slope stability in highways and bridge abutments. The main factor contributing in efficient and safe design of soil retaining structures is the magnitude of the induced forces from the embankment. Once a retaining structure moves horizontally or tilts towards a backfill, passive earth pressure generates within the soil mass. The Coulomb and Rankine [1,2] theories are widely used in engineering practice to calculate passive resistance because of the simplicity. Additionally, the log spiral theory proposed by [3] has been known to offer a more accurate estimation of passive earth pressure, but due to its complexity engineers would not prefer to use it in design.
In the literature, the mode of wall movement, cohesion and friction, interface friction and adhesion, and structure shape are considered as parameters that affect the passive failure mechanism [4]. However, in experimental studies, it is challenging to determine the exact influence of each parameter. Thus, use of numerical approaches can lead to a deeper understanding over the micro and macro scale characteristics of the soil media under various boundary conditions.
The Discrete Element Method (DEM), developed by [5], has been successfully used to predict the behaviour of granular materials. DEM considers the granular material
as a system of distinct interacting bodies and provides an insight into its overall response. Our study considers the so-called soft contact approach, in which particles are assumed rigid for shape definition purpose, and also allowed to overlap during contact (an elastic deformation). A detailed description of the work process on DEM can be found in the literature [6].
Widulinski et al. [7] evaluated the capabilities of DEM to generate the pattern of shear zones under active and passive states. Various wall movements (i.e. horizontal translation, rotation about top and toe) were considered and backfills are prepared with spherical particles. Results are compared with both experimental (through X-rays and DIC analysis) and numerical (through FEM) and shown that DEM realistically predicts the pattern of the shear zones.
Jiang et al. [8] used DEM to investigate the wall pressure distribution with respect to various wall movement types. A contact model that incorporates a rolling resistance model is employed. Accordingly, the dependency of bulk response over applied rolling resistance at contacts is evaluated. It is shown that it is essential to consider rolling resistance at contacts to predict realistic responses.
In the current study the dependency of the formed failure wedges, at passive state, on various boundary conditions is determined. Accordingly, using DEM, a backfill is simulated and following parameters are varied:
a) friction between the retaining wall and the particles b) availability of the periodic boundaries (to satisfy plain-strain conditions) c) having rigid frictionless/frictional boundaries (as side walls). The results suggest that the friction between the retaining wall and particles plays an important role on the resultant passive pressure. Additionally, it is shown that the side walls greatly impact the motion of the particles and therefore changes the geometry of the failure wedge.
2 Methodology
2.1. DEM formulationThe initial step in DEM is to define the geometry of the system, where particles are free to overlap while they come into contact. Repeated calculations in DEM are performed with using Newton’s second law, applied to the particles, and force-displacement law at the contacts. Force-displacement law relates the contact forces the particles to the resulting displacements (i.e. to calculate forces from displacements). The total normal and shear forces acting on every individual particle are calculated at each time-step by taking into account both the contact forces and body forces acting on the particle. Newton’s second law of motion is applied after determination of the contact forces to each particle. Between two succeeding time-steps, it provides the acceleration, velocity and displacements of each element.
For particle i the equation of motion is given by Equation (1):
mi (d2xi/dt2)=fi+mig (1)
where mi is the mass of the particle, t is time, xi is its
position, g is the acceleration due to gravity and fi is the
force acting on the particle due to particle contacts and defined as Equation (2):
fi=Ʃfic (2)
The rotational motion equation for particle i is given by:
Ii (dωi/dt)=Ti (3)
where Ii is the moment of inertia for particle i, ωi is its
angular velocity and Ti is the total torque acting on it,
which is defined by Equation (4) where li is the branch
vector of particle i, defined by Equation (5):
Ti=Ʃlic ˣ fic (4) li=ri-r (5)
The theory of DEM and its work process for
2.2. Numerical model
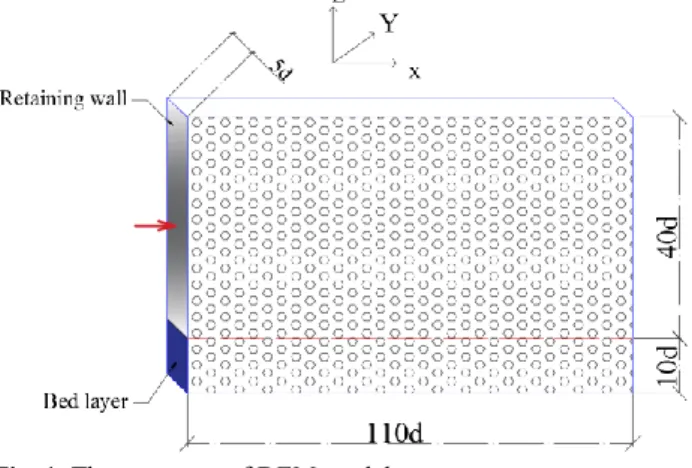
A cohesionless retained backfill that deforms under a plane strain boundary condition is modelled using DEM, as shown in Figure 1. The retaining wall has a rough/smooth surface and its inward horizontal translation leads to passive state failure. Furthermore, the adverse influence of the bed boundary effects is minimized by considering a layer of particles in the bot-tom section of the model. The properties of the particles in this layer are the same as in the backfill and its height is 10 times the mean particle diameter. Table 1 summarizes the list of parameters of the DEM simulation. The EDEM particle simulation software is used for running numerical simulations (DEM Solutions Ltd. 2014).
Spherical particles are employed in the simulation of the granular system (consists of ~37000 particles in case of periodic boundaries, and ~35000 particles in the presence of rigid sidewalls). The mean diameter of 3 mm and a standard deviation of 0.3 mm is considered for the granular packing.
The wall is translating with a constant speed of 2 mm/s to ensure the quasi-static flow of the particulate system. The particle data is saved with a frequency of 200 Hz. The friction between particles and the geometries (δ) is varied, while inter-particle friction (µSPP) is kept constant and
results are further discussed in the Section 3.
Fig. 1. The geometry of DEM model.
Table 1. DEM material properties.
Parameter Unit Value
Radius Mm 1.5
Density kg/m3 25
µSPP - 0.56
δ - 0 – 0.45
3 Results
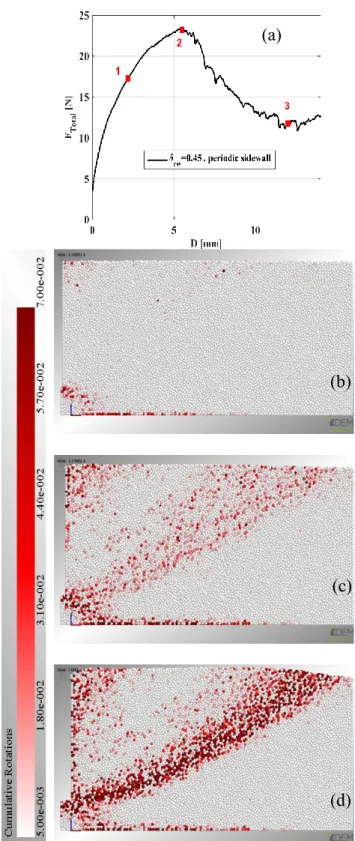
This section summarises the results from identical dense packings, which are imposed to different boundary conditions. As an initial step, the variation of the total wall pressure is obtained and plotted for the case with rough retaining wall (δrw=0.45) and periodic side wall. The plot
suggests that after reaching a distinct peak state (at D=5mm), the sample starts to strain soften until critical state is reached (at D=12mm), see Figure 2a. It is known that the maximum rotation of the particles occurs inside the shear bands. Accordingly, here the rotation of the single particles is accumulated (around y axis) during the wall movement and used for identifying the region where deformation localisation occurs (i.e. an indicator of the failure surface). Three points on Figure 2a are selected in different instances of the wall movement. The first point is located at D=2.2mm, and its respective cumulative rotation distribution is shown in Figure 2b. Except for some deformations at toe of the retaining wall and the region near base wall, no major shear band is formed. However, at second point, where the peak strength is recorded, it is obvious that the failure wedge is formed, see Figure 2c. Additionally, Figure 2d presents a more distinct failure wedge, where deformations are localized. Moreover, the failure slip is seen, from results of cumulative rotation distribution, to be curvilinear, which is in agreement with experimental observations.
To investigate the influence of retaining wall roughness on the passive state of failure, the two cases are simulated as: a) δrw=0.225 (half friction as in Figure 2) b)
an extreme case with frictionless retaining wall δrw=0. The
cumulative rotation is shown for both cases in Figure 3. It is seen that the geometry of the failure wedge is approximately similar for cases with frictional retaining wall, see Figure 3a. However, the slip surface is changed from curvilinear (for the frictional retaining wall) to approximately linear (for the frictionless retaining wall), see Figure 3b. Accordingly, it is of great importance to consider the friction between retaining wall and the particles while studying passive state of failure.
The influences of having physical sidewalls instead of periodic boundaries are also investigated. For this purpose, two packings are prepared with frictionless sidewalls (δsw=0) and frictional sidewalls (δsw=0.225),
note that in both cases the retaining wall is frictional δrw=0.45. The cumulative rotation distribution is shown
for both cases in Figure 4. In case of frictionless sidewall, it seems that a thicker shear band (approximately linear) is emerged. Furthermore, for the frictional sidewalls, the rapture plane is not distinctly formed. Instead, particles near the wall are pushed upward (rather than translating laterally as part of the failure wedge).
Fig. 2. Effect of wall movement on a) total force acting on the retaining wall b) defamation localisation at D= 2.2mm c) defamation localisation at D= 5mm d) defamation localisation at D= 12mm.
(b)
(c)
(d)
(a)
Fig. 3. Cumulative rotation distribution for a) δrw=0.225 b) δrw=0 (with periodic boundaries).
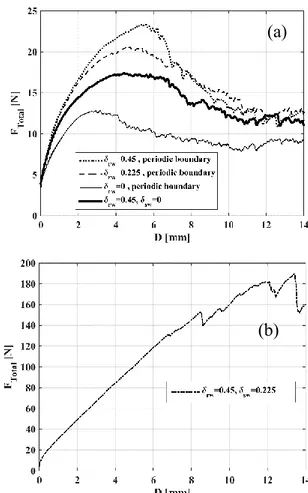
The total force acting on the retaining wall (Ftotal) is
recorded over 14mm of the wall movement, for various cases, and summarised in Figure 5. While a periodic boundary is considered, the case with highest δrw yield
largest peck strength. It is also seen that at critical state, both cases with δrw=0.45 and 0.225 yield overlapping
residual strength. Additionally, result of the case with frictionless sidewalls is also presented. It is seen that the Ftotal is lower than those of with periodic boundaries. Once
particles are exposed to periodic boundaries, the friction at the side boundaries is equal to particle-particle friction, whereas in case with δsw=0, particles can move easily near
the side boundaries (the particle-geometry contacts are not mobilised). However, once friction is enabled between the sidewalls and the particles (as in Figure 4b), the Ftotal increases significantly (almost 10 times larger
than case with δsw=0), see Figure 5b.
Fig. 5. Total force distribution exerted on the retaining wall (during wall movement) a) with periodic and frictionless side-walls b) with frictional side wall.
4 Conclusion
This study focused on the influence of boundary
(a)
(a)
(b)
(a)
failure surface, and thus the total force exerted on the wall (i.e. FTotal decreases for smaller δrw values). For smooth
retaining wall a linear failure surface is observed. Additionally, sidewalls are enabled for 2 cases and δrw
value is applied as 0 and 0.225. For the case with smooth sidewalls, it is pointed out that the emerged failure surface is approximately similar to that of with periodic boundaries (note that the form of slip surface is an almost linear in this case and a thicker shear band is observed). For FTotal it is shown that smooth sidewalls yield less force
on over the retaining wall. Furthermore, for frictional sidewalls, the shear localisation pattern is different to the other observed cases (much smaller slip plane). However, it is seen that FTotal is almost 10 times larger than the case
with δsw=0.
Consequently, it can be suggested that aside the single particle properties, the boundary conditions have a large influence on the macro-scale characteristics of the granular backfill.
The authors would like to thank The Scientific and Research Council of Turkey (TÜBITAK) for supporting this study with Project number 114M329.
References
1. C. A. Coulomb, Memoires de mathematique et de physique (Presentes a l’Academie Royale des Sciences, Paris 1776).
2. W.J.M. Rankine, Philosoph. Trans. Royal Soc. (London, 1857).
3. K. Terzaghi, Wiley (1943).
4. J.M. Duncan & R. L. Mokwa, J. of Geot. and Geoenv. Eng. 127, 3 (2001).
5. P.A. Cundall & O.D. Strack, geotechnique 29, 1 (1979).
6. C. O'Sullivan, CRC Press (2014).
7. Ł.Widuliński, J.Tejchman, J.Kozicki & D.Leśniewska, Int. J. Sol. and Struct. 48, 7–8 (2011). 8. M. Jiang, J. He, J. Wang, F. Liu, & W. Zhang, Gran.