THE EFFECTS OF REFERENCE POINTS ON FAIRNESS JUDGMENTS A Master’s Thesis by BETÜL AKAR Department of Economics
İhsan Doğramacı Bilkent University Ankara
July 2014
THE EFFECTS OF REFERENCE POINTS ON FAIRNESS JUDGMENTS
Graduate School of Economics and Social Sciences of
İhsan Doğramacı Bilkent University
by
BETÜL AKAR
In Partial Fulfillment of the Requirements for the Degree of MASTER OF ARTS
in
THE DEPARTMENT OF ECONOMICS
İHSAN DOĞRAMACI BİLKENT UNIVERSITY ANKARA
I certify that I have read this thesis and have found that it is fully adequate, in scope and in quality, as a thesis for the degree of Master of Arts in Economics.
---
Asst. Prof. Dr. Emin Karagözoğlu Supervisor
I certify that I have read this thesis and have found that it is fully adequate, in scope and in quality, as a thesis for the degree of Master of Arts in Economics.
---
Asst. Prof. Dr. N. Aygün Dalkıran Examining Committee Member
I certify that I have read this thesis and have found that it is fully adequate, in scope and in quality, as a thesis for the degree of Master of Arts in Economics.
--- Prof. Dr. Özlem Yılmaz
Examining Committee Member
Approval of the Graduate School of Economics and Social Sciences
--- Prof. Dr. Erdal Erel Director
ABSTRACT
THE EFFECTS OF REFERENCE POINTS ON FAIRNESS JUDGMENTS
AKAR, Betül
M.A., Department of Economics Supervisor: Asst. Prof. Dr. Emin Karagözoğlu
July 2014
In this study, we empirically investigate the effects of reference points on fairness judgments with the help of the vignette technique. Specifically, we examine (i) whether reference points have influence on fairness judgments or not, (ii) if and how counter-intuitive reference points influence fairness judgments, and (iii) how the asymmetry of reference points shape fairness judgments. For that purpose, we use a within-subject design, in which participants are confronted with three versions of vignette: vignettes without reference point, vignettes with salient reference point, and vignettes with counter-intuitive reference point. Consequently, our findings suggest that (i) the reference points significantly influence fairness judgments, (ii) introducing counter-intuitive reference points moderate the salience of reference points, and (iii) the asymmetry of salient reference points has a concave relationship with fairness judgments, while the asymmetry of counter-intuitive reference points does not affect fairness judgments.
ÖZET
REFERANS NOKTALARININ ADALET KARARLARI ÜZERİNDEKİ ETKİLERİ
AKAR, Betül
Yüksek Lisans, İktisat Bölümü
Tez Yöneticisi: Yrd. Doç. Dr. Emin Karagözoğlu
Temmuz 2014
Bu çalışmada, referans noktalarının adalet kararları üzerindeki etkilerini vinyet tekniği yardımıyla araştırıyoruz. Özellikle (i) referans noktalarının adalet kararlarını etkileyip etkilemediğini, (ii) akla-yatkın olmayan referans noktalarının adalet kararlarını nasıl etkilediğini, ve (iii) referans noktalarının asimetrisinin adalet kararlarını nasıl şekillendirdiği inceliyoruz. Bu amaçla, katılımcılara üç farklı vinyet versiyonunun sunulduğu - referans noktasız vinyet, belirgin referans noktalı vinyet, ve akla-yatkın olmayan referans noktalı vinyet - bir denek içi dizayn kullanıyoruz. Sonuç olarak, bulgularımız (i) referans noktalarının adalet kararlarını belirgin bir şekilde etkilediğini, (ii) akla-yatkın olmayan referans noktaları ortaya koymanın referans noktalarının belirginliğini azalttığını, ve (iii) belirgin referans noktaları ile adalet kararları arasında iç bükey bir ilişki varken, akla-yatkın olmayan referans noktalarının adalet kararları üzerinde etkisi olmadığını öne sürmektedir.
ACKNOWLEDGEMENTS
I would like to express my deepest gratitude to my supervisor Asst. Prof. Emin Karagözoğlu for his excellent guidance, encouragement and support throughout my graduate study. It was a great pleasure for me to study under his supervision.
I am also thankful to Asst. Prof. N. Aygün Dalkıran for his helpful and worthwhile comments.
I am also indebted to Prof. Dr. Özlem Yılmaz for her valuable comments, suggestions, and criticisms.
Finally, I am deeply grateful to my parents Hakime Akar and Ahmet Akar, for their unlimited support and love throughout my life. And a special thanks to my brother, Halit Akar, for his help, support, and comments during my undergraduate and graduate studies. Without their understanding and patience, I would not complete this thesis.
TABLE OF CONTENTS
ABSTRACT ... iii ÖZET ... iv ACKNOWLEDGEMENTS ... v TABLE OF CONTENTS ... viLIST OF TABLES ... vii
LIST OF FIGURES ... viii
CHAPTER 1: INTRODUCTION ... 1
CHAPTER 2: RELATED LITERATURE ... 5
CHAPTER 3: METHODOLOGY AND DESIGN ... 9
CHAPTER 4: RESEARCH HYPOTHESES ... 16
CHAPTER 5: RESULTS ... 19
5.1 Subjects’ background information ... 19
5.2 Fairness Judgments ... 20
CHAPTER 6: CONCLUSION ... 44
SELECT BIBLIOGRAPHY ... 48
APPENDICES A: RESULTS OF POST-EXPERIMENTAL QUESTIONNAIRE ... 50
LIST OF TABLES
1. Our Design (all amounts in points) ... 15
2. Sample Sizes ... 20
3. Average high performer’s shares in V1 ... 22
4. Average equal performer’s shares in V1 and V2 ... 24
5. Average high performer’s shares in V1 and V2 ... 27
6. The average high performer’s shares in V1 and V3 ... 32
7. The average high performer’s shares in V2 and V3 ... 36
8. The average high performer’s shares in V2 ... 40
LIST OF FIGURES
1. Fairness judgments in V1 ... 212. Fairness judgments in WRP-4500 and V-2250 ... 23
3. Fairness judgments in WRP-4500 and V-3747 ... 25
4. Fairness judgments in WRP-6000, V-3753, and V-6000 ... 26
5. Fairness judgments in WRP-3000 and V-2253 ... 26
6. Fairness judgments in V-755 and WRP-3000 ... 29
7. Fairness judgments in V-2242 and WRP-6000 ... 30
8. Fairness judgments in V-0 and WRP-6000 ... 31
9. Fairness judgments in V-756 and WRP-4500 ... 31
10. Fairness judgments in V-2242 and V-3753 ... 34
11. Fairness judgments in V-755 and V-2253 ... 34
12. Fairness judgments in V-756 and V-3747 ... 35
13. Fairness judgments in V-0 and V-6000 ... 36
14. Fairness Judgments in V2 ... 39
CHAPTER 1
INTRODUCTION
A growing experimental literature on the effects of reference point in negotiations reports that culture, environmental cues, focal points, historical precedents, norms, previous agreements, tradition, and values of relevant economic parameters can emerge as a reference point. For instance, Ashenfelter and Bloom (1984) and Bazerman (1985) show that previous agreement, even if expired, is an important factor affecting the outcome of current negotiations. In the light of their theoretical study, Gupta and Livne (1989) point out that the reference point, in the form of previous agreement, has a great impact on negotiation outcomes. More recently, Blount, Thomas-Hunt, and Neale (1996), Bohnet and Zeckhauser (2004), Abeler, Falk, Götte, and Huffman (2011), Herweg and Schmidt (2013), Bartling and Schmidt (2014), and Fehr, Hart, and Zehnder (2014) find that contracts, expired contracts, expectations, historical contractual conditions, and norms can act as a reference point and strongly influence the negotiation process and negotiation outcomes. In this study, on the other hand, we evaluate the effects of reference points on fairness judgments in negotiations from the point of view of an impartial spectator.
There have been a considerable number of studies arguing that what people perceive as “fair” vary with respect to whether they are in the shoes of an impartial
spectator or in an actual negotiation (see, for instance, Babcock, Loewenstein, Issacharoff, and Camerer, 1995; Babcock and Loewenstein, 1997; Gächter and Riedl, 2005, 2006; Karagozoglu and Riedl, 2010). All these studies report that fairness judgments are likely to be biased in a self-serving manner. Therefore, we expect that people can be more unbiased, while responding to the hypothetical situations in the shoes of impartial spectator rather than in the actual negotiation. For this reason, we employ the vignette technique to assess people’s fairness judgments. In particular, we design and conduct a survey consisting of thirteen vignettes (hypothetical scenarios) and a post-experimental questionnaire.
We contribute to the existing literature by empirically investigating the effects of reference points on fairness judgments. Specifically, we examine (i) whether the reference points influence fairness judgments or not, (ii) if and how the counter-intuitive reference points influence fairness judgments, and (iii) how the asymmetry of reference points shapes fairness judgments. For that purpose, we use a within-subject design, in which subjects are confronted with three versions of vignette: vignettes without reference point, vignettes with salient reference point, and vignettes with counter-intuitive reference point. Our vignette design provides enough context and information for subjects by presenting them a hypothetical situation and persons. Specifically, in our study, vignettes introduce the bargaining problem with reference points to subjects and then ask them about their opinion on how to distribute surplus “fairly” between two persons.
Our vignette design also allows us to investigate our aims. To explore whether the reference points have influence on fairness judgments, we compare the responses in the vignettes without reference point to in the vignettes with salient
reference point. To study the effects of counter-intuitive reference points, we make pair-wise comparisons across three versions of vignette. To examine how the asymmetry of reference points affects fairness judgments, we vary the reference points over nine possible values.
Our study makes several important contributions on the existing literature. First, to our knowledge, our study is the first to combine three versions of vignette into one design and thereby provides us to test directly whether the reference points influence fairness judgments. Second, contrary to previous studies as sited here, we explore the effects of asymmetry by comparing fairly a high number of reference points. Third and foremost, our study is the first to underscores the importance of salient reference point by introducing counter-intuitive reference points.
By means of our vignette design, we first find that reference points significantly influence the fairness judgments. Our findings suggest that subjects do take into account the reference points, while making their decisions. Second, we observe that introducing counter-intuitive reference points moderate the salience of reference points. Our data reports that subjects’ answers in the vignettes with counter-intuitive reference point do not differ from in the vignettes without reference point. Namely, subjects behave as if they were confronted with the vignettes without reference points. Moreover, compared to the other vignettes, there is considerable heterogeneity in fairness judgments in the vignettes with counter-intuitive reference point. Third, we see that the asymmetry of reference points is an important factor affecting subjects’ fairness judgments. There is a concave relationship between the asymmetry of reference point and subjects’ fairness judgments in the vignettes with salient reference point. On the other hand, we find that the asymmetry of
counter-intuitive reference points does not affect subjects’ fairness judgments. Our data indicates that subjects’ answers are identical across the vignettes with counter-intuitive reference point. On the other hand, we also observe that the asymmetry of reference points leads to higher heterogeneity in subjects’ fairness judgments.
The rest of the paper is organized as follows: In the next chapter, we review the related literature. In chapter 3, we present the methodology and design of our vignette study. In chapter 4, we develop our research hypothesis. In chapter 5, we report the results and in chapter 6 we conclude. In the Appendices, we report the results of post-experimental questionnaire and present sample vignettes.
CHAPTER 2
RELATED LITERATURE
There are several studies employing the vignette method to explore the views of an impartial spectator on what is a fair distribution in different economic environments (see Gaertner and Schokkaert, 2011 for a review). One of the first examples is the study of Yaari and Bar-Hillel (1984). Yaari and Bar-Hillel (1984) discuss whether a departure from equal-split distribution comes from differences in needs, in tastes or in beliefs in a simple exchange economy. For that purpose, they use a between subject design where different groups of subjects are confronted with three versions of vignette. Specifically, these versions differ with respect to needs, tastes and beliefs and all of them ask subjects to report their opinion about how to distribute a bundle of goods fairly between two persons. Their results point out that differences in needs are considered to be a justification for the departure from equal-split. Along the same lines, Schokkaert and Overlaet (1989) use a vignette technique for analyzing the principles of distributive justice in a production context. In order to investigate the reasons for income differences, they confront different groups of subjects with four versions of vignette, in which production depends on either effort or talent. In these vignettes subjects are asked to indicate their opinion about how to divide profit or
loss fairly in a partnership between two persons. Their findings reveal the importance of effort for income differences. More recently, Konow (2003) conduct an extensive survey by employing the vignette technique to assess the normative and positive theories of justice. However, contrary to previous studies as cited here, instead of asking subjects their views on what is fair, this study ask them to rate distributions, policies, or situations described in vignettes as “fair” or “unfair”.
There is also some recent experimental study that inspired us to conduct this vignette study. For instance, our paper is closely related and complementary to Gächter and Riedl (2006), who empirically investigate the bargaining problems with claims. Specifically, they assess both the people’s fairness judgments as well as people’s actual bargaining behavior with the help of a vignette study and a bargaining experiment. They also examine the predictability of three bankruptcy rules in a bargaining with claims environment. In the vignette study, Gächter and Riedl (2006) confront different groups of subjects with two versions of vignette. In particular, two versions are asymmetric with respect to two claims and both of them ask subjects to answer a question on what a fair division would be from the point of view of an impartial spectator. As a result, they report that the asymmetry of claims strongly influence the fairness judgments. In addition, their findings suggest that the answers in vignettes come closest to the proportional solution, whereas the bargaining outcomes are closest to the constrained equal-award solution. Although our vignette design is quite different from Gächter and Riedl (2006), we address the same research question, regarding to the effects of asymmetry. It is therefore our study is complementary to Gächter and Riedl (2006).
Our study is also related to the study of Bosmans and Schokkaert (2009). As Gächter and Riedl (2006), Bosmans and Schokkaert (2009) empirically study on the bargaining problems with claims. They conduct a questionnaire study, in which different groups of subjects are confronted with two versions of questionnaire: the Firm version and the Pension version. In their study, in contrast to Gächter and Riedl (2006), they vary not only claims but also the sum of claims over three possible values. Specifically, in both versions they present subjects to nine bargaining problems with claims and ask them to choose the most fair distribution from the predictions of bankruptcy rules. By means of their research design, they compare the three bankruptcy rules and report that Egalitarian solution better predicts the answers in the Firm version than in the Pension version.
Our vignette design shares some similarity with the design of aforementioned studies, although we study on different subject, namely bargaining problems with reference points. For example, as in the study of Gächter and Riedl (2006) and Bosmans and Schokkaert (2009), in our study we introduce the bargaining environment by presenting a hypothetical firm to subjects and serve the reference point as the firm’s previous policy for splitting surplus. Moreover, similar to all previous studies as cited here, we assess people’s fairness judgments by asking subjects to indicate their impartial views on what is a fair division. On the other hand, our vignette design considerably differs from the aforementioned studies in three aspects. First, contrary to all previous studies as cited here, we use a within-subject design and thereby having an opportunity to make individual comparisons and test for individual effects. Second, in contrast to Yaari and Bar-Hillel (1984), Konow (2003), and Bosmans and Schokkaert (2009), however in the line with
Schokkaert and Overlaet (1989) and Gächter and Riedl (2006), in order to avoid framing effects, we ask subjects to indicate what is a fair division instead of asking them to choose a fair division from a number of predictions of theoretical rules. Third, compared to Gächter and Riedl (2006) and Bosmans and Schokkaert (2009), we examine the effects of asymmetry by varying the reference point over fairly a high number of values. That is, we manipulate the reference points over nine possible values, while Gächter and Riedl (2006) and Bosmans and Schokkaert (2009) vary claims over 2 and 3 possible values, respectively.
CHAPTER 3
METHODOLOGY AND DESIGN
In order to assess the fairness judgments of subjects, we used the vignette method in our study. Vignette method is very useful to explore fairness judgments of subjects, since we expect that subjects can be more unbiased while they respond to a hypothetical situation than being directly asked about their views. Moreover, by presenting subjects a hypothetical situation and persons, the vignette method can give enough context and information for them to have an understanding of the real life bargaining situations (Bartner and Renold, 2000).
In our vignette study, subjects first received the general instructions in which we introduced the bargaining problem to subjects and informed them about the common features of vignettes. We then read the general instructions aloud in order to make the rules of the vignette study common knowledge. Specifically, subjects were presented the following instructions (translated from Turkish):
Imagine two persons, named as A and B, are working in a hypothetical firm. Their work is to count the number of 1s in randomly generated 6×6 panels filled with 0s and 1s”. They work on this task simultaneously for a limited period of time and face the same set of panels in the same sequence. A panel looks like this:
1 0 1 0 1 0 0 0 1 1 1 1 1 1 0 1 0 0 0 1 1 0 1 1 0 0 1 1 0 1 1 1 0 0 0 0
The performance of A and B are measured with the task described above. The person who count higher number of panels correctly is considered as “high performer”, while the other person is considered as “low performer”. If the number of panels correctly counted by A and B are equal, both A and B are considered as “ equal performer”.
At the end of the task, if the total number of panels correctly counted by A and B are higher than 15, they earn the total of 9000 points. Afterwards, they will bargain over the division of the amounts that they earned. If they reach an agreement, they earn what they agree on. Otherwise, they earn nothing. If the total number of panels correctly counted by A and B are less than 15, both of them earn nothing.
Historically, persons who worked in this hypothetical firm worked on the aforementioned task as well. At the end of the task, the persons who have the same performances with A and B earned the amounts that is less than the total of 9000 points depending on the economic conditions of the firm. It is also known that one of the factors that the firm took into account while splitting the surplus between the persons is their performances.
After reading instructions aloud, subjects were confronted with thirteen vignettes, which were completely independent of each other. In each vignette, subjects were asked about their opinion on how to distribute 9000 points fairly between A and B. While making their decisions, subjects were asked to put themselves in the shoes of a non-involved, neutral third party and to assume that their decisions determine the payoffs of the two persons in such a situation. In particular, subjects were asked to answer the following question (adapted from Babcock et al., 1995):
“According to your opinion, what would be a fair division of 9000 points between A and B at the end of the bargaining that they made in order to share the amounts they earned?”
(Please use exact amounts; no intervals! The amounts should sum up to 9000 points!)
In our vignette study, we used a within-subject design, in which subjects were confronted with three versions of vignette: vignettes without reference point, vignettes with salient reference point, and vignettes with counter-intuitive reference points. The reason why we used within-subject design is that it allows us to test for individual effects, make individual comparisons, and have more powerful test results. Nevertheless, one disadvantage of within-subject design is the problem of order effects. In our study, therefore, we presented the vignettes to subjects in a different order to eliminate order effects. Below, we summarize the common features of three versions:
• Version 1 (V1): Vignettes without reference point
o Subjects were confronted with four vignettes.
o The information about firm’s previous policy for splitting the surplus is not given. The only available information is the previous surplus.
o Subjects were presented the following vignette (translated from Turkish): Historically, high performers and low performers, who worked in this hypothetical firm, earned the total of 4500 points at the end of the task they worked on. However, the amounts that high and low performers received are not known.
Currently, high performer A and low performer B, who are also working in the same hypothetical firm, earned the total of 9000 points at the end of the task they worked on. In order to share the surplus, they have to bargain over 9000 points. In case of disagreement, they will earn 0 point.
• Version 2 (V2): Vignettes with salient reference point
o Subjects were confronted with five vignettes.
o The information about firm’s previous policy for splitting surplus is given. o Historically, the surplus was split according to performance.
The detailed information about how the previous surplus was split among persons, who worked in this hypothetical firm, is stated below.
Previous surplus: 4500 points
The amounts that high performers received: 3747 points The amounts that low performers received: 753 points
Currently, high performer A and low performer B, who are also working in the same hypothetical firm, earned the total of 9000 points, at the end of the task they worked on. Due to the change in firm’s policy for distribution of surplus, they have to bargain over 9000 points. In case of disagreement, they will earn 0 point.
• Version 3 (V3): Vignettes with counter-intuitive reference point
o Subjects were confronted with four vignettes.
o The information about firm’s previous policy for splitting the surplus is given.
o Historically, high performers received lower amounts of surplus, while low performers received higher amounts of surplus.
o Subjects were presented the following vignette (translated from Turkish): The detailed information about how the previous surplus was split among persons, who worked in this hypothetical firm, is stated below.
Previous surplus: 4500 points
The amounts that high performers earned: 756 points The amounts that low performers earned: 3744 points
Currently, high performer A and low performer B, who are also working in the same hypothetical firm, earned the total of 9000 points at the end of the task they worked on. Due to the change in firm’s policy for distribution of surplus, they have to bargain over 9000 points. In case of disagreement, they will earn 0 point.
In our study, the firm’s previous policy for splitting the surplus serves as a reference point. However, in some of the vignettes we did not inform subjects about the firm’s previous policy but informed them about the previous surplus and the relative performance of the persons previously worked in this hypothetical firm.
Thus, by comparing answers in the two versions of vignette, namely Version 1 and 2, we investigate whether the reference point influence the fairness judgments or not.
Furthermore, in some of the vignettes we assigned the higher amounts of surplus to low performers, whereas, the lower amounts of surplus to high performers in order to introduce counter-intuitive reference points. More clearly, we design four counter-intuitive reference points, in which the ratios of the high performers’ share to the low performers’ share are 1:1.66, 1:3, 1:5, and 0:1. On the one hand, we also proposed salient reference points, where the high performers (low performers) received the higher amounts (lower amounts) of surplus. Specifically, we set five salient reference points, where the ratios of the high performer’s share to the low performer’s share are 1:1, 1.66:1, 3:1, 5:1, and 1:0. Here high performers received nearly the same amount of surplus with low performers in the vignettes with counter-intuitive reference point. In other words, the ratios of high performers’ share to low performers’ share in V2 and the ratios of the low performer’s share to the high
performer’s share in V3 are indeed the same; however, the amounts that high
performers received in V2 are slightly different from the amounts that low performers
received in V3. For instance, the amount that high performers received in one of the
vignettes in V2 is 2242 points, while the amount that low performers received in one
of the vignettes in V3 is 2247 points. The reason why we set the amounts like this is
to minimize on the salience of proportionality. Additionally, in case some of the subjects consider that there is a typo or typing mistake in the vignettes with counter-intuitive reference point, we create uncertainty in the instruction part by saying that “one of the factors” that the firm took into account while splitting the surplus
between the persons is their “performances”. Thus, our design will allow us to show the effects of counter-intuitive reference points on the fairness judgments.
We also varied the reference points over nine possible values. First of all, it is notable to examine the effects of strongly asymmetric reference points on the fairness judgments. Subjects may react in different ways, when they confront with vignettes with strongly asymmetric reference point. Therefore, in our vignette study, two of these nine reference points are strongly asymmetric that high performers (low performers) receive the all surplus, while low performers (high performers) receive nothing. Moreover, since we choose a symmetric disagreement point, namely (0,0), to make the Person A and B strategically equivalent, the equal-split may become a focal point that attracts subjects’ decisions. We therefore set a symmetric reference point, where equal performers receive the same amount of surplus. Finally, we designed our other reference points by means of proportionality. In this respect, our vignette design is similar to Gächter and Riedl (2006). They calculated the ratios of the high performer’s share to the low performer’s share, which is called as the ratios of the claims in their study, as 2:1 and 4:1. However, we extend the range of the ratios of the high performer’s share to the low performer’s share from 1.66:1 to 5:1. Namely, we set the ratios of high performers’ share to the low performers’ share as 1.66:1, 3:1, and 5:1 in V2 and 1:1.66, 1:3, and 1:5 in V3. In addition to this, contrary
to Gächter and Riedl (2006), we also manipulate the amounts of previous surplus over three possible values: 3000, 4500, and 6000 points. Thus, this research design provides us to examine how the asymmetry of reference points influences the fairness judgments. Table 1 summarizes our design.
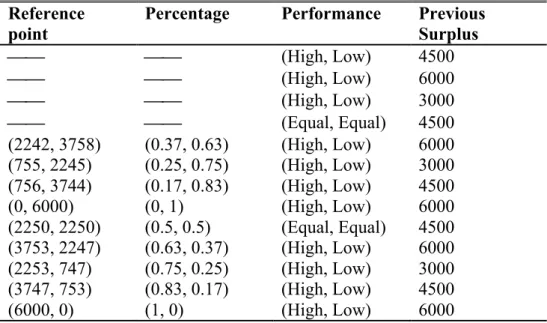
Table 1.Our Design (all amounts in points) Reference
point Percentage Performance Previous Surplus
⎯⎯ ⎯⎯ (High, Low) 4500 ⎯⎯ ⎯⎯ (High, Low) 6000 ⎯⎯ ⎯⎯ (High, Low) 3000 ⎯⎯ ⎯⎯ (Equal, Equal) 4500 (2242, 3758) (0.37, 0.63) (High, Low) 6000 (755, 2245) (0.25, 0.75) (High, Low) 3000 (756, 3744) (0.17, 0.83) (High, Low) 4500 (0, 6000) (0, 1) (High, Low) 6000 (2250, 2250) (0.5, 0.5) (Equal, Equal) 4500 (3753, 2247) (0.63, 0.37) (High, Low) 6000 (2253, 747) (0.75, 0.25) (High, Low) 3000 (3747, 753) (0.83, 0.17) (High, Low) 4500 (6000, 0) (1, 0) (High, Low) 6000
After answering the question in each vignette, subjects also completed the post-experimental questionnaire, in which they reported the factors that influenced their fair distribution decisions, and answered a few questions about their justice sensitivity, personal traits, and personal background.
In the remainder of paper, we use abbreviations and symbols for convenience. That is, a vignette without reference point is denoted as WRP-previous surplus: WRP-3000, WRP-4500, and WRP-6000, while a vignette with reference point is denoted as V-previous high performers’ share: V-2242, V-755, V-756, V-0, V-2250, V-3753, V-2253, V-3747, and V-6000.
CHAPTER 4
RESEARCH HYPOTHESES
In this study, first we determine whether the reference points influence the fairness judgments. If so, next we will show the effects of counter-intuitive reference points on the fairness judgments. Finally, we will examine how the asymmetry of reference points shapes the fairness judgments. Therefore, in this chapter we propose some hypothesis regarding these issues.
Hypothesis 1: Fairness Judgments and Existence of Reference Points
Experimental literature on the effects of reference points in negotiations find that current contracts, expired contracts, expectations, historical contractual conditions, norms, and previous agreements can act as a reference point and significantly influence the negotiation process and negotiation outcomes. (see, for instance, Gupta and Livne, 1989; Blount et al., 1996; Bohnet and Zeckhauser, 2004; Abeler et al., 2009; Herweg and Schmidt, 2013; Bartling and Schmidt, 2014; Fehr et al., 2014). Similar to the previous studies, we investigate whether the firm’s previous policy, which serve as a reference point in our vignette study, influence the fairness judgments in negotiations. Therefore, these results strongly support our following hypothesis:
Hypothesis 1a: The average high performer’s shares in V1 are not different from
Hypothesis 1b: The variances of fairness judgments in V1 are not different from
each other. Moreover, the variances of fairness judgments in the high performer’s share are greater than the variance of fairness judgments in the equal performer’s share.
Hypothesis 1c: The average equal performer’s share in V1 is similar to the average
equal performer’s share in V3.
Hypothesis 1d: The variances of fairness judgments in the equal performer’s share do not differ from each other.
Hypothesis 1e: The average high performer’s shares in V1 are lower than the
average high performer’s shares in V2.
Hypothesis 1f: The variances of fairness judgments in V1 are higher than the
variances of fairness judgments in V2.
Hypothesis 2: Fairness Judgments and Counter-Intuitive Reference Points Existing empirical and theoretical studies on the investigation of reference point effects emphasis the importance of salient reference points in negotiations. (Koop and Johnson, 2010; Balakrishnan, Gomez, and Vohra, 2011; Herweg and Schmidt, 2013). In our study, we want to moderate the salience of reference points by introducing counter-intuitive reference points. Therefore, one may intuitively suggest that a counter-intuitive reference point influences negotiations in a similar way with a less salient reference point. As a result, decreasing salience of reference points may lead to reduce the use of reference points in negotiations. This result implies the following hypothesis:
Hypothesis 2a: The average high performer’s shares in V3 are similar to the average
Hypothesis 2b: The variances of fairness judgments in V3 are similar to the
variances of fairness judgments in V1.
Hypothesis 2c: The average high performer’s shares in V3 are lower than the
average high performer’s shares in V2.
Hypothesis 2d: The variances of fairness judgments in V3 are higher than the
variances of fairness judgments in V2.
Hypothesis 3: Fairness Judgments and Asymmetry of Reference Points
Recent vignette study on the fairness judgments in a bargaining with claims environment, conducted by Gächter and Riedl (2006), suggests that the difference in the asymmetry of claims influence the fairness judgments. Furthermore, they report that the asymmetry of the claims increases the heterogeneity in fairness judgments. Specifically, Gächter and Riedl (2006) point out that the asymmetry of claims increases the average high performer’s share and the variance of fairness judgments. These results give rise to our last hypothesis:
Hypothesis 3a: The asymmetry of salient reference points increases the average high performer’s share.
Hypothesis 3b: The asymmetry of salient reference points increases the variance of fairness judgments.
Hypothesis 3c: The asymmetry of counter-intuitive reference points increases the average high performer’s share.
Hypothesis 3d: The asymmetry of counter-intuitive reference points increases the variance of fairness judgments.
CHAPTER 5
RESULTS
In this chapter, we first review subjects’ background information and then analyze the results of the fairness judgments. In order to test our hypotheses, we use non-parametric tests and classical test of hypothesis. Namely, we use the paired t-test, Wilcoxon sign rank test, Kruskal -Wallis test, and Multivariate test of means, while assessing the fairness judgments on averages, medians, and distributions. Moreover, we check for the equality of variances of fairness judgments across the vignettes by using the one-sample variance comparison test.
5.1 Subjects’ background information
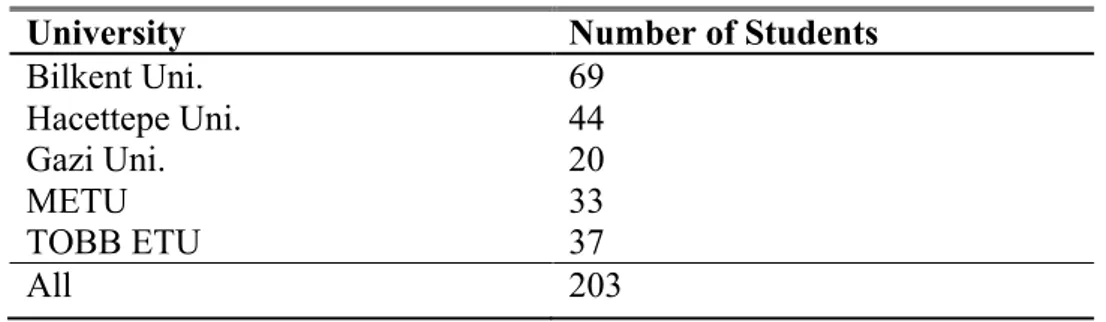
Our vignette study was conducted among the undergraduate and graduate students of economics, business administration, nutrition and dietetics, international relations, and engineering of Bilkent University, Hacettepe University, Gazi University, Middle East Technical University, and TOBB University of Economics and Technology. A total of 203 students participate in our vignette study; their participation was anonymous and voluntary. Nevertheless, a total of 7 students were omitted because the amounts that they proposed for Person A and B did not add up to 9000 points in each vignette. The details about sample sizes are given in Table 2.
Table 2. Sample Sizes
University Number of Students
Bilkent Uni. 69 Hacettepe Uni. 44 Gazi Uni. 20 METU 33 TOBB ETU 37 All 203
The age of students ranged from 18 to 29 (mean 21.3) and 40 percent of students were male. It took students approximately 30 minutes to read general instructions, answer the questions in each vignette and fill in the post-experimental questionnaire. Moreover, we test for the order effects. However, Kruskal-Wallis test reports that there is no significant order effect on subjects’ fairness judgments (p = 0.8799; p = 0.7205; p = 0.6660; p = 0.0058; p = 0.8153; p = 0.1621; p = 0.5196; p = 0.1148; p = 0.6700; p = 0.1759; p = 0.1879; p = 0.3165; p = 0.3940). Therefore, we pooled the all data in our analysis.
5.2 Fairness Judgments
Result 1: Fairness Judgments and Existence of Reference Points
To test our hypothesis 1, we first look at the average high and equal performers’ shares separately in the vignettes without reference points. We then compare the average high and equal performers’ shares in the vignettes without reference point (V1) to in the vignettes with salient reference point (V2). We further analyze the
variances of fairness judgments in V1 and V2. Roughly speaking, we observe that the
reference points shape subjects’ fairness judgments. Our results are summarized as follows:
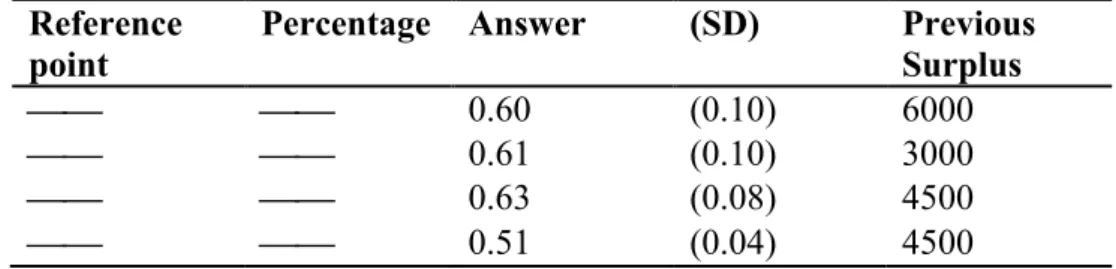
Result 1a: Contrary to our hypothesis 1a, the average high performer’s shares are considerably larger than the equal-split. However, as stated in our hypothesis 1a, they are identical across the vignettes: %63 in WRP-4500, % 60 in WRP-6000, and %61 in WRP-3000.
Supports for result 1a: Figure 1 provides a graphical support for our result 1a. It depicts the distribution of fairness judgments in vignettes without reference point. As we can see from figure 1, in WRP-4500 the high performer’s share ranges from %33 to %99, with a peak at around %70, while in WRP-6000 and WRP-3000 the high performer’s share range from %13 to %100 and %33 to %100, with peaks at around %50. On the other hand, the equal performer’s share in WRP-4500 ranges from %17 to %100, with a peak at %50. Furthermore, pair-wise comparisons using Wilcoxon signed-rank test (WSR) reports that the null hypothesis that the distributions of fairness judgments in WRP-6000 and WRP-3000 are the same cannot be rejected (p=0.8573), while the other null hypotheses of equal distributions can be rejected (p < 0.0001).
Figure 1. Fairness judgments in V1
0 20 40 60 80 10 0 Fre qu en cy 0 .2 .4 .6 .8 1 High performer's share
Vignette without reference point WRP-4500 0 20 40 60 80 Fre qu en cy 0 .2 .4 .6 .8 1 High performer's share
Vignette without reference point WRP-6000 0 20 40 60 80 Fre qu en cy 0 .2 .4 .6 .8 1 High performer's share
Vignette without reference point WRP-3000 0 50 10 0 15 0 20 0 Fre qu en cy 0 .2 .4 .6 .8 1 Equal Performer's share
Vignette without reference point WRP-4500
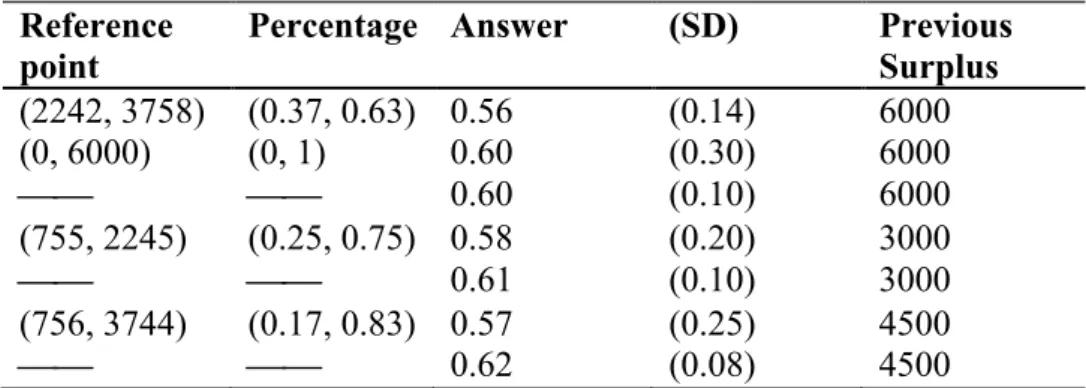
Table 3 displays the descriptive statistics of fairness judgments in V1. It
reports that the average high performer’s shares are similar across vignettes and significantly larger than the equal-split. Namely, the average high performer’s share is %63 in WRP-4500, % 60 in WRP-6000, and %61 in WRP-3000. Multivariate test of means, however, strongly rejects the null hypothesis that all means are the same (p=0.0007). On the other hand, the paired t-test reveals that the difference in the average high performer’s share between WRP-6000 and WRP-3000 is not significant (p = 0.3138), while the other differences are significant (p= 0.0002; p = 0.0103).
Table 3. Average high performer’s shares in V1
Reference point
Percentage Answer (SD) Previous
Surplus
⎯⎯ ⎯⎯ 0.60 (0.10) 6000
⎯⎯ ⎯⎯ 0.61 (0.10) 3000
⎯⎯ ⎯⎯ 0.63 (0.08) 4500
⎯⎯ ⎯⎯ 0.51 (0.04) 4500
Note: Table reports answers on averages and standard deviations in parentheses.
Result 1b: As stated in our hypothesis 1b, the variances of fairness judgments in V1
are very similar to each other. That is, the standard deviation is % 8 in WRP-4500, %10 in WRP-3000 and WRP-6000. Moreover, the variances of fairness judgments in the high performer’s share are higher than the variance of fairness judgments in the equal performer’s share.
Supports for result 1b: According to Table 3, the variances of fairness judgments in the high performer’s share are considerably higher than in the equal performer’s share. To be precise, in WRP-6000 and WRP-3000 standard deviations of fairness judgments in the high performer’s share are %10 and in WRP-4500 it is %8, while in
WRP-4500 the standard deviation of fairness judgments in equal performer’s share is %4. Furthermore, comparisons across vignettes using One-sample variance test reports that the difference in the variances of fairness judgments in the high performer’s share between WRP-6000 and WRP-3000 is not significant (chi2, p = 0.5051), while the other differences are highly significant (chi2, p = 0.0001; p = 0.0004).
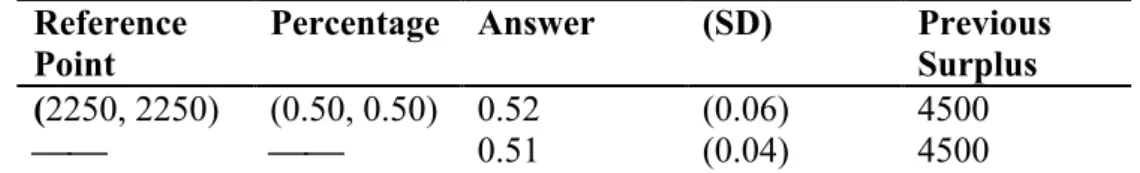
Result 1c: As hypothesized, the average equal performer’s shares in V-2250 and in WRP-4500 are very similar. That is, in V-2250 the average equal performer’s share is %52, while in WRP-4500 it is %51.
Supports for result 1c: Figure 2 provides a graphical support for our result 1b. It depicts the distributions of fairness judgments in the equal performer’s share. In WRP-4500 the equal performer’s share ranges from %17 to %100, with a peak at %50, while in V-2250 the equal performer’s share ranges from %40 to %80, with a peak at %50. In addition, 160 subjects assigned the equal performers half of surplus in WRP-4500, whereas 182 subjects assigned the equal performers half the surplus in V-2250. Moreover, WSR test reports that null hypothesis of equal distribution can be rejected (p = 0.0019).
Figure 2. Fairness judgments in WRP-4500 and V-2250
0 50 10 0 15 0 20 0 Fre qu en cy 0 .2 .4 .6 .8 1
Equal Performer's share Vignette without reference point
0 50 10 0 15 0 20 0 Fre qu en cy 0 .2 .4 .6 .8
Equal performer's share Vignette with reference point (2250, 2250)
Table 4 reports the descriptive statistics of fairness judgments in the equal performer’s share. It indicates that average equal performer’s shares across vignettes are very similar. That is, the equal performer’s share in V-2250 is %52, which is 1 percentage point higher than in WRP- 4500. The paired t-test also reports that the equal performer’s share in V-2250 is not statistically different from equal performer’s share in WRP-4500 (p = 0.0962).
Table 4. Average equal performer’s shares in V1 and V2
Reference
Point Percentage Answer (SD) Previous Surplus
(2250, 2250) (0.50, 0.50) 0.52 (0.06) 4500
⎯⎯ ⎯⎯ 0.51 (0.04) 4500
Note: Table reports answers on averages and standard deviations in parentheses.
Result 1d: As stated in our hypothesis 1d, the variance of fairness judgments in V1
and V2 are identical. Namely, in V-2250 the standard deviation is %6, whereas in
WRP-4500 the standard deviation is %4.
Supports for 1d: According to Table 4, the variance of fairness judgments in V-2250 is very similar to in WRP-4500. More clearly, the standard deviation in V-V-2250 is %6, only 2 percentage points higher than in WRP-4500. However, the one-sample variance comparison test indicates that the equality of variances of fairness judgments can clearly be rejected (chi2, p < 0.0001).
Result 1e: As hypothesized, the average high performer’s shares in V1 are fairly
lower than the average high performer’s shares in V2. Namely, the average high
performer’s share is %60 in 3000, % 61 in 6000, and % 63 in WRP-4500, while it is %61 in V-3753, %74 in V-0, %70 in V-2253, and %74 in V- 3747.
Supports for result 1e: Figure 3, 4, and 5 allow us to support our result 1c. From figure 3, we can observe that the high performer’s share in both WRP-4500 and V-3747 range from %33 to %99. However, in WRP-4500 there is a peak at around %70, whereas in V-3747 there is a peak at %80. Moreover, WSR test rejects the null hypothesis of equal distributions (p = 0.0205).
Figure 3. Fairness judgments in WRP-4500 and V-3747
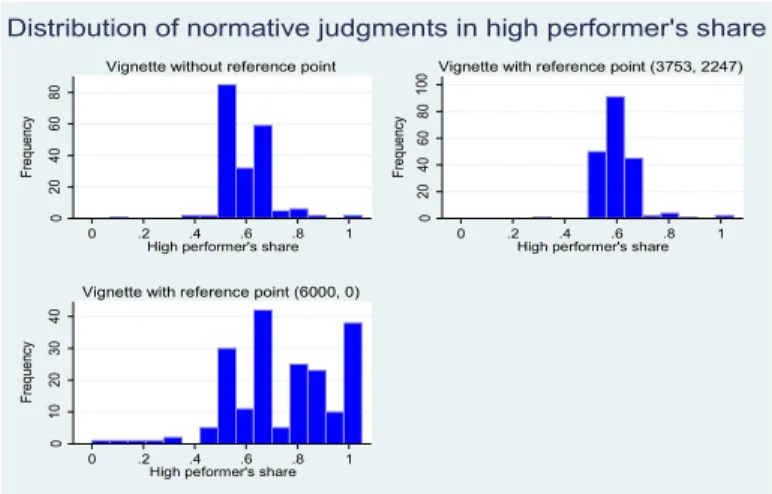
From Figure 4, we can see that the distributions of fairness judgments differ across the vignettes. In WRP-6000 the high performer’s share ranges from %13 to % 100, with a peak at around %50, while in V-6000 the high performer’s share ranges %0 to %100, with a peak at around %70. Another interesting observation is that in contrast to WRP-6000, in V-6000 33 subjects thought that the high performer should receive the all surplus. WSR test suggests that both distributions are not the same (p <0.0001). As we can also observe from Figure 1d, similar to WRP-6000 the high performer’s share in V-3753 ranges from %33 to %100. However, for V-3753 there is a peak at %60. WSR test also reveals that the null hypothesis of equal distributions cannot be rejected. (p = 0.2871). 0 20 40 60 80 10 0 Fre qu en cy 0 .2 .4 .6 .8 1
High performer's share Vignette without reference point
0 20 40 60 80 Fre qu en cy 0 .2 .4 .6 .8 1
High performer's share Vignette with reference point (3747, 753)
Figure 4. Fairness judgments in WRP-6000, V-3753, and V-6000
From Figure 5, we can observe that the distributions of fairness judgments in WRP-3000 and in V-2253 are different from each other. In WRP-3000 the high performer’s share ranges from %33 to %100, with a peak at around %50, while in V-2253 the high performer’s share ranges from %0 to %99, with a peak at around %70. Moreover, WSR test confirms that the distributions of fairness judgments in WRP-3000 and V-2253 are not the same (p < 0.0001).
Figure 5.Fairness judgments in WRP-3000 and V-2253
Table 5 shows the descriptive statistics of fairness judgments in V1 and V2. It
reports that the average high performer’s shares in V1 are fairly lower than in V1.
0 20 40 60 80 Fre qu en cy 0 .2 .4 .6 .8 1
High performer's share
Vignette without reference point
0 20 40 60 80 10 0 Fre qu en cy 0 .2 .4 .6 .8 1
High performer's share
Vignette with reference point (3753, 2247)
0 10 20 30 40 Fre qu en cy 0 .2 .4 .6 .8 1
High peformer's share
Vignette with reference point (6000, 0)
Distribution of normative judgments in high performer's share
0 20 40 60 80 Fre qu en cy 0 .2 .4 .6 .8 1
High performer's share Vignette without reference point
0 20 40 60 80 Fre qu en cy 0 .2 .4 .6 .8 1
High Performer's share Vignette with reference point (2253, 747)
That is, in WRP-4500 the average high performer’s share is %61, which is 13 percentage points lower than in V-3747. In WRP-3000 the average high performer’s share is %60, which is 10 percentage points lower than in V-2253. In WRP-6000 the average high performer’s share is %60, which is 14 percentage points higher than in V-6000. Apart from these results, the paired t-test reports that the difference in the average high performer’s shares between WRP-6000 and V-3753, which is 1 percentage point, is not significant (p=0.1567), while the other differences are significant (p < 0.0001 for all comparisons).
Table 5. Average high performer’s shares in V1 and V2
Reference point
Percentage Answer (SD) Previous
Surplus (3753, 2247) (0.63, 0.37) 0.61 (0.07) 6000 (6000, 0) (1, 0) 0.74 (0.20) 6000 ⎯⎯ ⎯⎯ 0.60 (0.10) 6000 (2253, 747) (0.75, 0.25) 0.70 (0.11) 3000 ⎯⎯ ⎯⎯ 0.61 (0.10) 3000 (3747, 753) (0.83, 0.17) 0.74 (0.12) 4500 ⎯⎯ ⎯⎯ 0.62 (0.08) 4500
Note: Table reports answers on averages and standard deviations in parentheses.
Result 1f: Contrary to our hypothesis 1e, the variances of fairness judgments in V1
are lower than the variances of fairness judgments in V2. The standard deviation is
%10 in WRP-3000, WRP-6000, and %8 in WRP-4500, while it is %7 in V-3753, %20 in V-0, %11 in V-2253, and % 12 in V- 3747.
Supports for result 1f: Table 5 displays that the variances of fairness judgments in V2 are significantly higher than in V1. (The only exception is the variance of fairness
judgments in V-3753, which is fairly lower than the variance of fairness judgments in WRP-6000.) Specifically, we compare standard deviations of fairness judgments
in V2 to in V1. First of all, in V-6000 standard deviation is %20, while in WRP-6000
the standard deviation is %10. One-sample variance comparison test strongly rejects the equality of variances of fairness judgments (chi2, p < 0.0001). Moreover, in V-2253 the variance of fairness judgments seems to be very similar to the variance in WRP-3000. Namely, the standard deviation in V-2253 is %11, which is only 1 percentage point greater than in WRP-3000. Yet, One-sample variance comparison test indicates that the difference in the variances of fairness judgments between V-2253 and WRP-3000 is significant (p = 0.0255). Finally, the difference in standard deviation between V-3747 and WRP- 4500 is %4. One sample variance comparison test confirms that the difference is significant (chi2, p = 0.0009).
In conclusion, the data partially support our hypothesis 1a, which states that the average high performer’s shares in V1 are not different from each other and do
not differ from the equal split. We show that the average high performer’s shares are identical across vignettes and significantly larger than the equal-split. Moreover, the data does not confirm our hypothesis 1f, which indicates that the variances of the fairness judgments in V1 are higher than the variances of the fairness judgments in
V2. Consequently, our findings allow us to reject this hypothesis. On the other hand,
our data strongly supports our hypotheses 1b, 1c, 1d and 1e.
Result 2: Fairness Judgments and Counter-Intuitive Reference Points
To test our hypothesis 2, we compare the average high performer’s shares in the vignettes with counter-intuitive reference point (V2) to in the vignettes without
reference point (V1) and the vignettes with salient reference point (V3). Moreover,
we find that subjects do not take into account the counter-intuitive reference points, while making their decisions. Our results are summarized as follows:
Result 2a: As stated in our hypothesis 2a, the average high performer’s shares in V3
are very similar to the average share high performer’s shares in V1. That is, the
average high performer’s share is %56 in V-2242, %60 in V-0, %58 in V-755, and %57 in V-756; on the other hand, it is %60 in WRP-3000, % 61 in WRP-6000, and % 63 in WRP-4500.
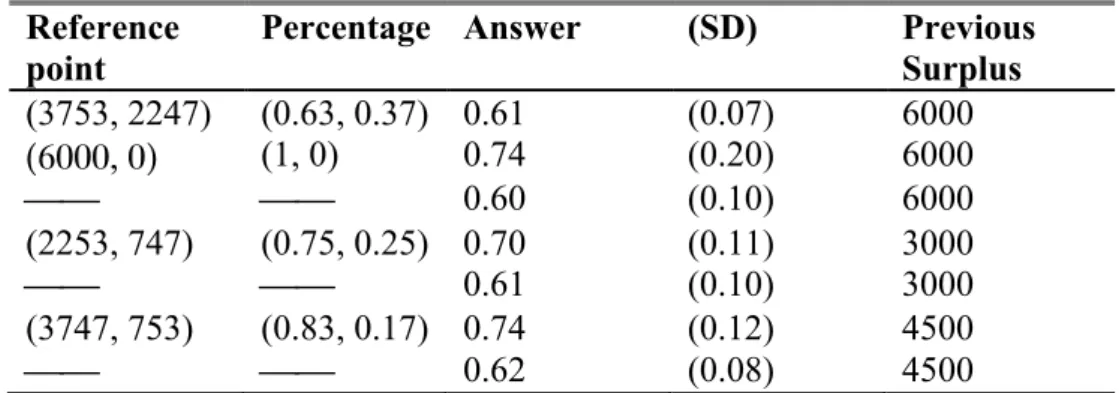
Supports for result 2a: Figure 6, 7 and 8 help us to support our result 2a. As we can see from Figure 6, the high performer’s share in V-755 ranges from %11 to %100, whereas the high performer’s share in WRP-3000 ranges from %33 to %100. However, for both vignettes there is a peak at about %50. One of interesting findings that the Figure 6 shows us is that in V-755 49 subjects thought that the high performer should receive less than half the surplus. However, in WRP-3000 only 3 subjects consider that the high performer should get less than half the surplus. Moreover, WSR test reports that the null hypothesis of the equal distributions cannot be rejected (p = 0.5514).
Figure 6. Fairness judgments in V-755 and WRP-3000
0 10 20 30 40 Fre qu en cy 0 .2 .4 .6 .8 1
High performer's share Vignette with reference point (755, 2245)
0 20 40 60 80 Fre qu en cy 0 .2 .4 .6 .8 1
High performer's share Vignette without reference point
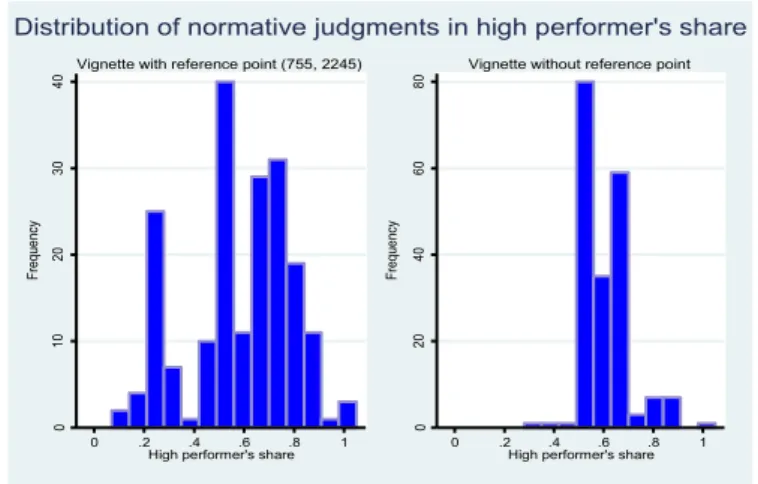
From Figure 7, we can observe that in V-2242 the high performer’s share ranges from %0 to %100, while in WRP-6000 the high performer’s share ranges from %13 to %100. However, for both vignettes there is a peak at around %50. Another important result is that compared to WRP-6000, in V-2242 58 subjects assigned the high performer less than half the surplus. Furthermore, WSR test indicates that the null hypothesis of equal distributions can be rejected (p < 0.0001).
Figure 7. Fairness judgments in V-2242 and WRP-6000
From Figure 8, we can explore that in V-0 the high performer’s share ranges from %0 to %100, whereas in WRP-6000 the high performer ranges from %13 to %100. However, for both vignettes there is a peak at around %50. One further important point is that in V-0 11 subjects thought that the high performer should receive nothing, while 28 subjects thought that the high performer should receive the all surplus. Yet, WSR test reports that both distributions are the same (p = 0.7042).
0 20 40 60 Fr eq ue nc y 0 .2 .4 .6 .8 1
High performer's share Vignette with reference point (2242, 3758)
0 20 40 60 80 Fr eq ue nc y 0 .2 .4 .6 .8 1
High performer's share Vignette without reference point
Figure 8. Fairness judgments in V-0 and WRP-6000
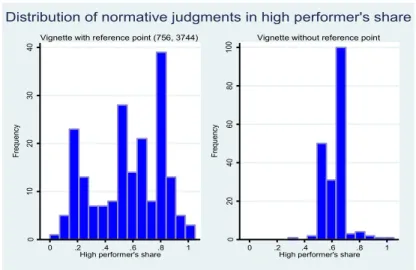
From Figure 9, we can see that the high performer’s share in V-756 ranges from about %10 to %100, with a peak at %80, while the high performer’s share in WRP-4500 ranges from about % 33 to %99, with a peak at around %70. One further interesting observation is that in V-756 64 subjects thought that the high performer should get less than half the surplus, while only 3 subjects thought that the high performer should get less than half the surplus. Furthermore, WSR test indicates that the distributions of fairness judgments in V-756 and WRP-4500 are not the same (p = 0.0205).
Figure 9. Fairness judgments in V-756 and WRP-4500
0 10 20 30 40 50 Fr eq ue nc y 0 .2 .4 .6 .8 1
High performer's share Vignette with reference point (0, 6000)
0 20 40 60 80 Fr eq ue nc y 0 .2 .4 .6 .8 1
High performer's share Vignette without reference point
Distribution of normative judgments in high performer's share
0 10 20 30 40 Fre qu en cy 0 .2 .4 .6 .8 1
High performer's share
Vignette with reference point (756, 3744)
0 20 40 60 80 10 0 Fre qu en cy 0 .2 .4 .6 .8 1
High performer's share
Vignette without reference point
Table 6 displays the descriptive statistics of fairness judgments in V1 and V3.
It shows that the average high performer’s shares in V3 are similar to the average
high performer’s share in V1. That is, the average high performer’s share in V-0 is
%60, which is exactly the same as the average high performer’s share in WRP-6000. The paired t-test also indicates that the difference in fairness judgments between WRP-6000 and V-0 is not significant. (p = 0.7042). Table 6 also reports that the difference between V-755 and WRP-3000, which equals 3 percentage points, is not significant either (p = 0. 0768). However, the paired t-test suggests that the differences between V-2242 and WRP-6000 as well as V-756 and WRP-4500 are significant (p < 0.0001; p = 0.0009).
Table 6. The average high performer’s shares in V1 and V3
Reference point
Percentage Answer (SD) Previous
Surplus (2242, 3758) (0.37, 0.63) 0.56 (0.14) 6000 (0, 6000) (0, 1) 0.60 (0.30) 6000 ⎯⎯ ⎯⎯ 0.60 (0.10) 6000 (755, 2245) (0.25, 0.75) 0.58 (0.20) 3000 ⎯⎯ ⎯⎯ 0.61 (0.10) 3000 (756, 3744) (0.17, 0.83) 0.57 (0.25) 4500 ⎯⎯ ⎯⎯ 0.62 (0.08) 4500
Note: Table reports answers on averages and standard deviations in parentheses.
Result 2b: Contrary to our hypothesis, the variances of fairness judgments in V3 are
not similar to the variances of fairness judgments in V1. In fact, they are higher in V3
than in V1. Namely, the standard deviation is %14 in V-2242, %30 in V-0, %20 in
V-755, and %25 in V-756; on the other hand, it is %10 in WRP-3000, WRP-6000, and %8 in WRP-4500.
Supports for result 2b: According to Table 6, the variances of fairness judgments in V3 are considerably higher than variances of fairness judgments in V1. In particular,
we compare standard deviations of fairness judgments in V3 to in V1. First of all, the
standard deviation in V-0 is 20 percentage points higher than the standard deviation in WRP-6000. Compared to the difference between V-0 and WRP-6000, the difference in standard deviation between V-2242 and WRP-6000 is very small, namely 4 percentage points. Yet, One sample comparison test reports that the difference is significant (chi2, p <0.0001). Moreover, the standard deviation in 755-V is twice as high than in WRP-3000. Finally, the standard deviation in 756-755-V is roughly three times as high than in WRP-4500. In addition to these results, the pair-wise comparisons using One-sample variance comparison test indicates that the variances of fairness judgments in V3 are significantly different from variances of
fairness judgments in V1 (chi2, p < 0.0001 for all comparisons).
Result 2c: As stated in our hypothesis 2c, the average high performer’s shares in V3
are fairly lower than in V2. That is, the average high performer’s share is %56 in
V-2242, %60 in V-0, %58 in V-755, and %57 in V-756; on the other hand, the average high performer’s share is %61 in V-3753, %74 in V-0, %70 in V-2253, and %74 in V- 3747.
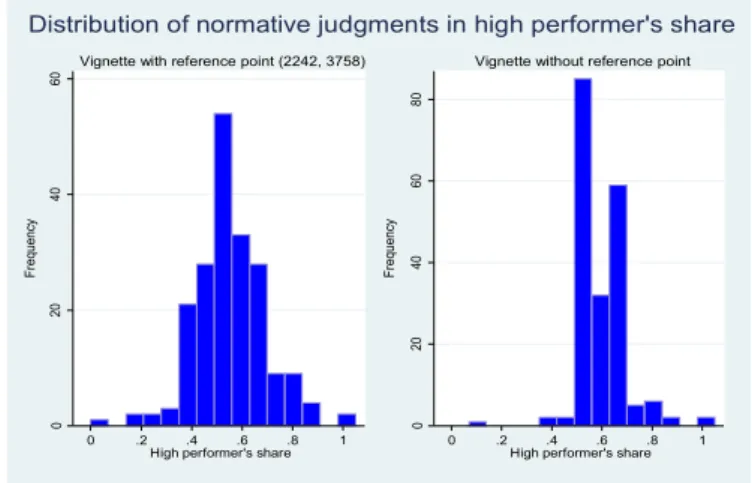
Supports for result 2c: Figure 10, 11, 12, and 13 provide supports for our result 2c. From Figure 10, we can observe that in V-2242 the high performer’s share ranges from about %0 to %100, with a peak at around %50, while in V-3753 the high performer’s share ranges from about %33 to %100, with a peak at %60. Another important result is that in V-2242 58 subjects consider that the high performer should get less than half the surplus, while in V- 3753 only 1 subject thought that the high
performer deserve less than half the surplus. Moreover, WSR test confirms that both distributions are not the same ( p < 0.0001 for all comparisons).
Figure 10. Fairness judgments in V-2242 and V-3753
From Figure 11, the high performer’s share in V-755 ranges from about %11 to %100, with a peak at around %50, whereas the high performer’s share in V-2253 ranges from %0 to %98, with a peak at around %70. One further interesting result is that Figure 2f presents to us is that in V-755 49 subjects thought that the high performer should receive less than half the surplus. However, in V-2253 only 3 subjects assigned the high performer less than half the surplus. Moreover, WSR test reports that the null hypothesis of the equal distributions can be rejected (p <0.0001).
Figure 11. Fairness judgments in V-755 and V-2253
0 20 40 60 Fre qu en cy 0 .2 .4 .6 .8 1
High performer's share Vignette with reference point (2242, 3758)
0 20 40 60 80 10 0 Fre qu en cy 0 .2 .4 .6 .8 1
High performer's share Vignette with reference point (3753, 2247)
Distribution of normative judgments in high performer's share
0 10 20 30 40 Fre qu en cy 0 .2 .4 .6 .8 1
High performer's share Vignette with reference point (755, 2245)
0 20 40 60 80 Fre qu en cy 0 .2 .4 .6 .8 1
High Performer's share Vignette with reference point (2253, 747)
From Figure 12, we can see that the high performer’s share in V-756 ranges from about %7 to %100, while the high performer’s share in V- 3747 ranges from about % 33 to %99. However, for both vignettes there is a peak at %80. One further interesting observation is that in V-756 64 subjects thought that the high performer should get less than half the surplus, while in V- 3747 only 4 subjects thought that the high performer should get less than half the surplus. Furthermore, WSR test indicates that the distributions of fairness judgments in V-756 and WRP-4500 are not the same (p < 0.00001).
Figure 12. Fairness judgments in V-756 and V-3747
From Figure 13, we can observe that for V-0 and V-600, the high performer’s share ranges from %0 to %100. However, in V-0 there is peak at around %50, whereas in V-6000 there is a peak at %60. Another interesting result is that in V-0 11 subjects thought that the high performer should receive nothing, while in V-6000 only 1 subject thought that the high performer should receive nothing. Moreover, 28 subjects in V-0 and 33 subjects in V-6000 assigned the high performer all surplus. In addition to these results, the WSR test reports that both distributions are not the same (p < 0.0001). 0 20 40 60 80 Fre qu en cy 0 .2 .4 .6 .8 1
High performer's share Vignette with reference point (3747, 753)
0 10 20 30 40 Fre qu en cy 0 .2 .4 .6 .8 1
High performer's share Vignette with reference point (756, 3744)
Figure 13. Fairness judgments in V-0 and V-6000
Table 7 displays the descriptive statistics of fairness judgments in V2 and V3.
It reports that the average high performer’s shares in V2 are fairly lower than in V3.
More clearly, the differences in average high performer’s share between V2 and V3
range from 5 percentage points to 17 percentage points. The paired t-test also confirms that the average high performer’s shares in V2 are significantly lower than
the average high performer’s shares in V3 (p < 0.0001).
Table 7. The average high performer’s shares in V2 and V3
Reference point
Percentage Answer (SD) Previous
Surplus (3753, 2247) (0.63, 0.37) 0.61 (0.07) 6000 (2242, 3758) (0.37, 0.63) 0.56 (0.14) 6000 (2253, 747) (0.75, 0.25) 0.70 (0.11) 3000 (755, 2245) (0.25, 0.75) 0.58 (0.20) 3000 (3747, 753) (0.83, 0.17) 0.74 (0.12) 4500 (756, 3744) (0.17, 0.83) 0.57 (0.25) 4500 (6000, 0) (1, 0) 0.74 (0.20) 6000 (0, 6000) (0, 1) 0.60 (0.30) 6000
Note: Table reports answers on averages and standard deviations in parentheses.
Result 2d: As stated in our hypothesis 2d, the variances of fairness judgments in V3
are higher than in V2. The standard deviation is %14 in V-2242, %30 in V-0, %20 in
0 10 20 30 40 50 Fre qu en cy 0 .2 .4 .6 .8 1
High performer's share Vignette with reference point (0, 6000)
0 10 20 30 40 Fre qu en cy 0 .2 .4 .6 .8 1
High peformer's share Vignette with reference point (6000, 0)
V-755, and %25 in V-756; on the other hand, it is %7 in V-3753, %11 in V-0, %12 in V-2253, and %20 in V- 3747.
Supports for result 2d: According to Table 7, the variances of fairness judgments in V3 are significantly higher than variances of fairness judgments in V2. Specifically,
we compare standard deviations of fairness judgments in V2 to in V3. First of all, the
standard deviation in 2242-V is twice as high than in 3753-V. Namely, in 2242-V it is %14, while in 3753-V it is %7. Moreover, the standard deviation in 755-V, which is %20, is roughly twice as high than in 2253-V. Similarly, this relationship is observed between 756-V and 3747-V. Finally, the standard deviation in 0-V is one and a half times high than in 6000-V. That is, in 0-V it is %30, while in 6000-V it is %15. Apart from these results comparisons across vignettes using One-sample variance comparison test clearly shows that the equality of variances of fairness judgments in V2 and V3 can be rejected (chi2, p < 0.0001 for all comparisons).
In conclusion, the data supports our hypothesis 2a, 2c, and 2d. However, our data does not confirm our hypothesis 2b, which states that the variances of fairness judgments in V3 are similar to the variances of fairness judgments in V1. Indeed, we
find that they are higher in V3 than in V2.
Result 3: Fairness Judgments and Asymmetry of Reference Points
To test our hypothesis 3, we compare the average high performer’s share across the vignettes with reference point. In addition to this, we analyze the variances of fairness judgments in these vignettes. As a result, we find that the asymmetry of salient reference point has a concave relationship with the average high performer’s share; on the other hand, the asymmetry of counter-intuitive reference point does not affect the subjects’ fairness judgments. Our results are summarized as follows:
Result 3a: Contrary to our hypothesis 3a, there is a concave relationship between the average high performer’s share and the asymmetry of salient reference point. Namely, the average high performer’s share is %52 in V-2250, % 61 in V-3753, %70 in V-2253, and %74 in V-3747 and V-6000.
Supports for result 3a
:
The figure 14 allows us to support our result 3a. It shows the distribution of fairness judgments in V2. In V-3753 the high performer’s shareranges from %33 to %100, with a peak at %60. On the other hand, in 2253 and V-3747 high performer’s shares range from % 0 to %98, with peaks at roughly %75 and %80, while in V-6000 the high performer’s share ranges from %0 to %100, with a peak at roughly % 70. We can infer from this result that as the asymmetry of reference points increases, the range of high performer’s share extends. Another important observation is that in V-6000 33 subjects assigned the high performer to all amounts of surplus, whereas only 1 subject in V-3753 and none of the subjects in the other vignettes assigned the high performer to all amounts of surplus. From this observation, we can conclude that even when the reference point is strongly asymmetric, some of the subjects take into account the reference point, and split the surplus according to it.
Figure 14. Fairness Judgments in V2
Table 9 displays the descriptive statistics of fairness judgments in V2. It
shows the asymmetry of salient reference points increases the average high performer’s share; however, at some point increases in the asymmetry of reference points are not associated with increases in the average high performer’s share. As we can see from Table-6, the difference in the average high performer’s share between V-2250 and V-2253 is highly significant, namely it is %18; on the other hand, the average high performer’s shares in V-3747 and V-6000 are the same. The paired t-test also confirms that the average high performer’s share in V-3747 is not statistically different from the average high performer’s share in V-6000 (p = 0.5843). However, Multivariate test of means suggests that all means significantly differ across the vignettes (p < 0.0001).
0 20 40 60 80 10 0 F re qu en cy 0 .2 .4 .6 .8 1
High performer's share Vignette with reference point (3753, 2247)
0 20 40 60 80 F re qu en cy 0 .2 .4 .6 .8 1
High Performer's share Vignette with reference point (2253, 747)
0 20 40 60 80 F re qu en cy 0 .2 .4 .6 .8 1
High performer's share Vignette with reference point (3747, 753)
0 10 20 30 40 F re qu en cy 0 .2 .4 .6 .8 1
High peformer's share Vignette with reference point (6000, 0)