AGRICULTURAL RESEARCH COMMUNICATION CENTRE www.arccjournals.com/www.legumeresearch.in
[1-6]
*Corresponding author’s e-mail: [email protected]
1Department of Field Crops, Faculty of Agriculture, Bingol University, Bingol-Turkey.
2Department of Crop and Animal Production, Genc Vocational School,Bingol University, Bingol, Turkey.
3Department of Biosystems Engineering, Faculty of Engineering, Nevsehir Haci Bektas Veli University, Nevsehir-Turkey. 4Department of Energy Systems Engineering, Faculty of Technology, Adiyaman University, Adiyaman-Turkey.
Legume Research,
Print ISSN:0250-5371 / Online ISSN:0976-0571
Determination of energy balance of common vetch (Vicia sativa L.),
hungarian vetch (Vicia pannonica C.) and narbonne vetch
(Vicia narbonensis L.) production in Turkey
Kagan Kokten*1, Erdal Cacan2, Osman Gokdogan3 and Mehmet Firat Baran4
Department of Field Crops, Faculty of Agriculture, Bingol University, Bingol-Turkey.
Received: 12-08-2016 Accepted: 01-10-2016 DOI:10.18805/lr.v0i0.6842
ABSTRACT
The aim of this study is to determine an energy balance of common vetch, hungarian vetch and narbonne vetch production during the production season of 2015 in Bingol province of Turkey. The energy input in common vetch, hungarian vetch and narbonne vetch production have been calculated as 13060.72 MJ ha-1, 15767.22 MJ ha-1and 14769.73 MJ ha-1,
respectively. The energy output in common vetch, hungarian vetch and narbonne vetch production have been calculated as 42048.22 MJ ha-1, 10051.33 MJ ha-1 and 11963.62 MJ ha-1, respectively. Energy usage efficiency, specific energy, energy
productivity and net energy values related to common vetch, Hungarian vetch and Narbonne vetch production have been determined as 3.22, 0.64, 0.81; 5.46 MJ kg-1, 29.98 MJ kg-1, 21.98 MJ kg-1; 0.18 kg MJ-1, 0.03 kg MJ-1, 0.05 kg MJ-1 and
28987.50 MJ ha-1, -5715.89 MJ ha-1, -2806.11 MJ ha-1 respectively for each type. The total renewable energy input applied
in common vetch, hungarian and narbonne vetch was 26.85, 20.42 and 29.69 per cent, respectively.
Key words: Common vetch, Energy balance, Hungarian vetch, Narbonne vetch, Specific energy, Turkey. INTRODUCTION
Vetch species have a great importance in terms of providing for the good quality coarse and concentrate fodder need for stock breeding. Due to its richness in variety, adaptation ability, grass and seed productivity and other similar reasons, vetch is being planted and produced at higher levels in our coastal and central regions. In transition regions with an annual precipitation level of 400 mm or more, where grain-fallow system is practised, hungarian vetch (Vicia
pannonica C.), hairy vetch (Vicia villosa R.), narbonne vetch
(Vicia narbonensis L.) and common vetch (Vicia sativa L.) is being cultivated as sole crop or together with barley, oat and triticale to produce fodder or seed (Iptas ve Yilmaz, 1998; Buyukburc and Iptas, 2001; Buyukburc and Karadag, 2002; Buyukburc et al., 2004). Among these varieties, hungarian vetch, hairy vetch and narbonne vetch are particular winter crops. On the other hand, common vetch has a lower winter resistance than the other vetch varieties therefore it is planted during summer months (Acikgoz, 2001; Buyukburc et al., 2004). The total size of pasture area in the world is 3.40 billion hectare. Turkey’s total pasture area size is 14.60 million ha, total size of forage plant area is 1.87 m ha, while the amount of production is 38.91 m tons. The total area of vetch in Turkey is 499 043 ha and production of 4.49 m
tons which contributes 27% in total forage production in the country. (Anonymous, 2014; Baran, 2016).
Energy efficiency analysis is closely associated with economic and ecological aspects of the chosen farming systems. Energy efficiency and energy balance can be accepted as a vital tool to define the environmental impacts of farming systems. Determination of the energy efficiency makes it possible to compare different farming systems in environment friendly production as well as sustainability of non-renewable natural resources (Celik et al., 2010). To determine energy efficiency, energy input-output analyses are usually conducted. These analyses determine how efficiently energy is used (Pervanchon et al., 2002; Beigi et
al., 2016). Energy usage efficiency and related efficiency
have been carried out by researchers on common vetch, hungarian vetch and narbonne vetch. Some of these researches may be listed as those on the energy usage research of vetch (Baran, 2016), corn (Ozturk et al., 2006), canola (Unakitan et al., 2010), soybean (Mandal et al., 2002), sesame (Akpinar et al., 2009), potato (Mohammadi et al., 2008),bar ley (Mobtaker et al., 2010), sugar beet (Haciseferogullari et al., 2003), chick pea (Marakoglu et
al., 2010), sunflower (Uzunoz et al., 2008)etc. This study
analysis of common vetch, hungarian vetch and narbonne vetch production in Turkey.
MATERIALS AND METHODS
This study has been performed for the whole Bingol province of Turkey (E41o-20´-39o-56o; N39o-31´; 36o-28o
1151 m above sea level(Anonymous, 2016a). The daily difference between h ighest temper ature and lowest temperature has nearly 200C. The annual average temperature
of the province is 12.1 0C while the annual average
precipitation level is 873.70 mm (Anonymous, 2016b).Soil structure of the province is clay-loam and loamy(Ates and Turan, 2015).The researches performed on trials area have 627 (common vetch ), 255 (h un gar ian vetch ) an d 285(narbonne vetch) square meters, located at Bingol in 2015 (Hun gar ian vetch 2014-2015 pr oduction season ). Randomized Complete-Block Design with three replicates has been performed in this study.Human labour, machinery, chemical fertilizers, diesel fueland seed energy have beencomputed inputs.Common vetch, hungarian vetch and narbonneyieldshave been computedas output.In Table 1, the agricultural production inputs, energy equivalents of input and outputhave beenusedas energy values. By adding energy equivalents of all inputs in MJ unit, the total energy equivalents have beencomputed.) The energy ratio (energy usage efficiency), energy productivity, specific energy and net energy have been computedby using the following equations (Mandal et al., 2002; Mohammadi et al., 2008 and Mohammadi et al. 2010)
Energy efficiency =
Energy output (MJ ha-1) / Energy input (MJ ha-1) (1) Energy productivity =
Yield output (kg ha-1) / Energy input (MJ ha-1) (2) Specific energy =
Energy input (MJ ha-1) / Yield output (kg ha-1) (3) Net energy =
Energy output (MJ ha-1) - Energy input (MJ ha-1) (4)
Kocturk and Engindeniz (2009) reported that the input energy can also be classified into direct, indirect, renewable andnon-renewable forms(Mandal et al., 2002; Singh et al., 2003)”. Total fuel consumption of each parcel
has beencomputed as l ha-1. Full tank method has been used
to measure the amount of fuel used (Gokturk, 1999; El Saleh, 2000; Sonmete, 2006). Labor time of each parcel (ha h-1)
has been calculated by proportion the total time computed for in area of the trial to the areas amount. Using the effective labour time (tef), while experiments in parcelsh ave beendone(Sonmete, 2006; Guzel, 1986; Ozcan, 1986). Measuringthe time spent duringagricultural operations in the parcels have been performed with the aid of chronometer (Sonmete, 2006). For calorific values of common vetch, hungarian vetch and narbonne vetch IKA brand C200 model bomb calorimeter device has been used. For measuring purposes, the amount of fuel (~0.1 g) has been combusted in side th e calor imeter bomb. Th e device has been given a calorific value in MJ kg-1 unit. For
samples, reading of the calorific value has been measured repetitively for 3 times and then the average value have been reported in common vetch, hungarian vetch and narbonne vetch study.
RESULTS and DISCUSSION
The amounts of Common vetch, Hungarian vetch and Narbonne vetch produced per hectare during the 2015 production season have been determined as 2394 kg, 526 kg and 672 kg on average, respectively. The energy balances of common vetch, Hungarian vetch and Narbonne vetch production related to this study are given in Table 2. These findings suggest that the highest energy inputs in common vetch production are as follows: diesel fuel energy by 30.94%, machinery energy by 23.74%, chemical fertilizers energy by 18.47%, human labour energy by 13.40% and seed energy by 13.45%. It can also be suggested that the highest energy inputs in Hungarian vetch production are as follows: diesel fuel energy by 31.51%, machinery energy by 24.17%, chemical fertilizers energy by 23.90%, human labour energy by 10.72% and seed energy by 9.70%. Finally the highest energy inputs in Narbonne vetch production are as follows: diesel fuel energy by 30.10%, seed energy by 24.11%, machinery energy by 23.09%, chemical fertilizers energy by 17.12% and human labour energy by 5.59%. It can be concluded that the highest energy inputs in common vetch, Hungarian vetch and Narbonne vetch production are as
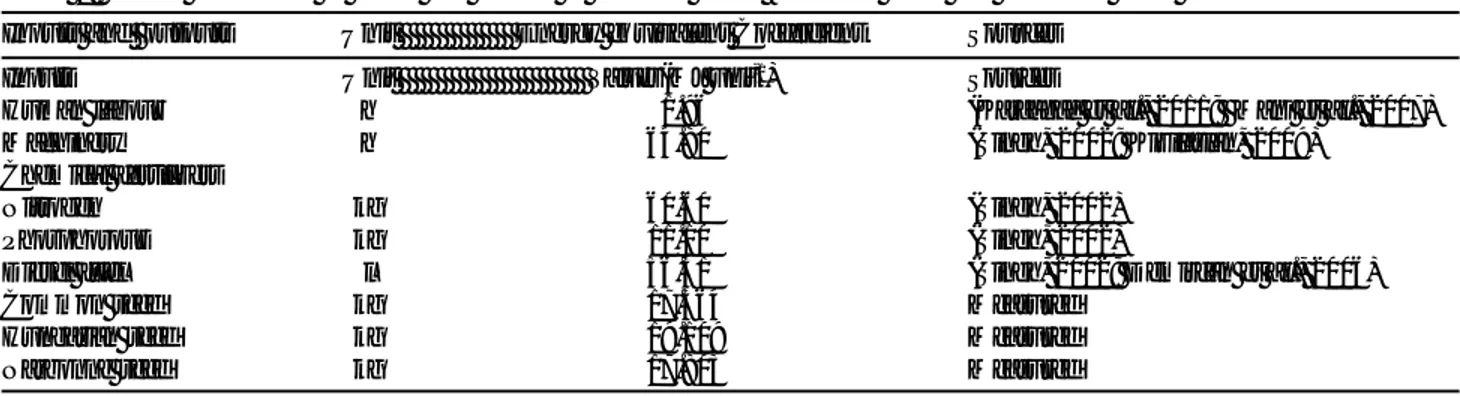
Table 1: Energy equivalents of inputs and outputs in common vetch, hungarian vetch and Narbonne vetch production Inputs and outputs Unit Energy equivalent Coefficient Sources
Inputs Unit Values(MJ unit-1) Sources
Human labour h 1.96 (Karaagac et al., 2011; Mani et al., 2007)
Machinery h 64.80 (Singh, 2002; Kizilaslan, 2009)
Chemical fertilizers
Nitrogen kg 60.60 (Singh, 2002)
Phosphorous kg 11.10 (Singh, 2002)
Diesel fuel l 56.31 (Singh, 2002; Demircan et al., 2006)
Common seed kg 17.564 Measured
Hungarian seed kg 19.109 Measured
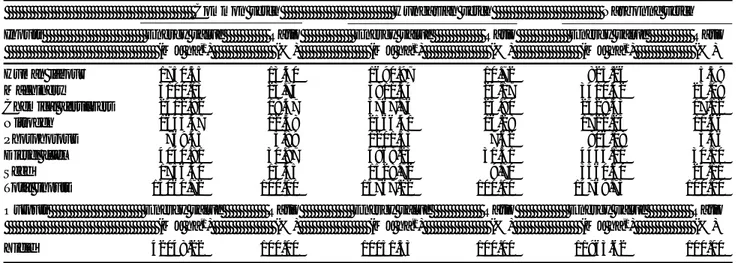
Table 2: Energy balance in common vetch, hungarian vetch and narbonne vetch production
Common vetch Hungarian vetch Narbonne vetch Inputs Energy value Ratio Energy value Ratio Energy value Ratio (MJ ha-1) (%) (MJ ha-1) (%) (MJ ha-1) (%) Human labour 1750.55 13.40 1690.97 10.72 825.26 5.59 Machinery 3100.03 23.74 3811.54 24.17 3410.42 23.09 Chemical fertilizers 2412.92 18.47 3767.76 23.90 2528.33 17.12 Nitrogen 1643.47 12.58 2566.41 16.28 1722.25 11.66 Phosphorous 769.45 5.89 1201.35 7.62 806.08 5.46 Diesel fuel 4040.81 30.97 4968.23 31.51 4445.11 30.10 Seed 1756.40 13.45 1528.72 9.70 3560.60 24.11 Total inputs 13060.72 100.00 15767.22 100.00 14769.73 100.00
Outputs Energy value Ratio Energy value Ratio Energy value Ratio
(MJ ha-1) (%) (MJ ha-1) (%) (MJ ha-1) (%)
Yield 42048.22 100.00 10051.33 100.00 11963.62 100.00
follows: diesel fuel energy, machinery energy and chemical fertilizers energy.
Human labour and diesel fuel energy have been utilized for tractor and farm operations. As Table 3 indicates, the amount of chemical fertilizers used for common vetch, Hungarian vetch and Narbonne vetch production were 96.44, 150.58 and 101.04 kg ha-1. Common vetch yield, energy
input, energy output, energy use efficiency, specific energy, energy productivity and net energy used for common vetch production have been calculated as 2394 kg ha-1, 13060.72
MJ ha-1, 42048.22 MJ ha-1, 3.22, 5.46 MJ kg-1, 0.18kg MJ-1
and 28987.50 MJ ha-1, respectively. In Hungarian vetch
production, Hungarian vetch yield, energy input, energy output, energy efficiency, specific energy, energy productivity and net energy have been calculated as 526 kg ha-1, 15767.22
MJ ha-1, 10051.33 MJ ha-1, 0.64, 29.98 MJ kg-1, 0.03 kg MJ-1
and -5715.89 MJ ha-1, respectively. And in Narbonne vetch
production, Narbonne vetch yield, energy input, energy output, energy efficiency, specific energy, energy productivity and net energy have been calculated as 672 kg ha-1, 14769.73
MJ ha-1, 11963.62 MJ ha-1, 0.81, 21.98 MJ kg-1, 0.05 kg MJ-1
and -2806.11 MJ ha-1, respectively.
The distribution of input energies, applied in accordance with the direct, indirect, renewable and non-renewable energy groups during the production of common
vetch, Hungarian vetch and Narbonne vetch, are given in Table 4. The total energy input applied in common vetch, Hungarian vetch and Narbonne vetch production could be classified as 44.34%, 42.23% and 35.68% direct energy, respectively. The total energy input applied in common vetch, Hungarian vetch and Narbonne vetch production could be classified as 55.66%, 57.77% and 64.32% indirect energy, respectively. The total energy input applied in common vetch, Hungarian vetch and Narbonne vetch production could be classified as 26.85%, 20.42% and 29.69% renewable energy, respectively. The total energy input applied in common vetch, Hungarian vetch and Narbonne vetch production could be classified as 73.15%, 79.58% and 70.31% non-renewable energy, respectively. Similarly, it has been determined that the ratio of non-renewable energy was higher than the ratio of renewable energy and the ratio of indirect energy was higher than the ratio of direct energy in barley (Baran and Gokdogan, 2014), wheat (Ghorbanie et al., 2011), maize (Vural and Efecan, 2012), sesame (Akpinar et al., 2009), rice (Pisghar-Komleh et al., 2011) etc.
In this research, the energy balance analysis of common vetch, Hungarian vetch and Narbonne vetch production has been conducted and then compared to each other. The acquired findings suggest that common vetch production is profitable in terms of energy use efficiency, with an efficiency value of 3.22. In contrast, however,
Table 3: Energy balance calculations in common vetch, hungarian vetch and narbonne vetch production
Common vetch Hungarian vetch Narbonne vetch
Computes Unit Values Values Values
Yields kg ha-1 2394 526 672
Energy input MJ ha-1 13060.72 15767.22 14769.73
Energy output MJ ha-1 42048.22 10051.33 11963.62
Energy use efficiency - 3.22 0.64 0.81
Specific energy MJ kg -1 5.46 29.98 21.98
Energy productivity kg MJ-1 0.18 0.03 0.05
Hungarian vetch and Narbonne vetch production is not profitable in terms of energy use efficiency, with respective values of 0.64 and 0.81. Based on the assessment of trial results, common vetch production is more profitable than Hungarian vetch and Narbonne vetch production. In previous studies, Baran and Gokdogan (2014) calculated energy output / input ratio as 5.44 for barley, Ghorbanie et al. (2011) calculated energy output / input ratio as 2.56; 1.97 for wheat, Vural and Efecan (2012) calculated energy output / input ratio as 0.76 for maize, Akpinar et al. (2009) calculated energy output / input ratio as 1.80; 1.40 for sesame, Pisghar-Komleh et al. (2011) calculated energy output / input ratio as 1.53 etc.
Several previous studies related to common vetch, Hungarian vetch and Narbonne vetch production concluded
that diesel energy, machinery energy and chemicals fertilizers energy have the highest inputs. Demircan et al. (2006) noted, “Accurate fertilization management, knowing the right amount and timing of fertilization (Kitani, 1999) and proper selection of tractor and sound management of machinery are needed to reduce direct use of diesel fuel (Isik and Sabanci, 1991), thus saving non-renewable energy sources without impairing the yield or profitability, whilst improving the energy use efficiency in sweet cherry production”. These assertions may be effectively applied for common vetch, Hungarian vetch and Narbonne vetch production with the purpose of lowering the amounts of related inputs.
ACKNOWLEDGEMENT
We thank to PhD student Murat Kadir Yesilyurt (Bozok University) for measurements help in these studies.
REFERENCES
Açikgöz E. (2001). Yembitkileri. Uludag Üniversitesi Ziraat Fakültesi Tarla Bitkileri Bölümü, 3. Baski, Bursa (In Turkish). Akpinar, M G, Ozkan B, Sayin, C, Fert C. (2009). An input-output energy analysis on main and double cropping sesame
production. Journal of Food, Agriculture & Environment 7: 464-467.
Anonymous, (2014). Gida Tarim ve Hayvancilik Bakanligi Tarla Bitkileri Arastirmalari Dairesi Baskanlig i Çayir Mera ve Yem Bitkileri Arastirmalari Çalisma Grubu, 5 March 2014, (In Turkish).
Anonym. (2016a). Bingöl Il Kültür ve Turizm Müdürlügü. http://www.bingolkulturturizm.gov.tr/TR,56989/ilin-cografi-konumu.html (19 July 2016, In Turkish).
Anonymous. (2016b). Bingöl Il Kültür ve Turizm Müdürlügü. http://www.bingolkulturturizm.gov.tr/TR,56989/ilin-cografi-konumu.html (21 July 2016, In Turkish).
Ates K, Turan V. (2015). Bingöl ili Merkez ilçesi tarim topraklarinin bazi özellikleri ve verimlilik düzeyleri. Türkiye
Tarimsal Arastirmalar Dergisi 2: 108-113 (In Turkish).
Baran, M F. (2016). Energy analysis of summeryy vetch production in Turkey: A Case study for Kirklareli
province.American-Eurasian J. Agric. & Environ. Sci 16: 209-215.
Baran, M F, Gokdogan, O. 2014. Energy input-output analysis of barley production in Thrace region of Turkey.
American-Eurasian J. Agric. & Environ. Sci 14: 1255-1261.
Beigi M, Torki-Harchegani M, Ghanbarian D. (2016). Energy use efficiency and economical analysis of almond production: a case study in Chaharmahal-Va-Bakhtiari province, Iran. Energy Efficiency 9: 745–754.
Büyükburç U, Iptas S. (2001). Tokat ekolojik kosullarinda bazi koca fig (Vicianarbonensis L.) hatlarinin verim ve verim ögeleriüzerinde bir arastirma. Turkish Journal of Agriculture and Forestry 25: 79-88 (In Turkish).
Büyükburç U, Karadag Y. (2002). The Amount of N03"-N transferred to soil by legumes, forage and seed yield, and the forage quality of annual legume + Triticale Mixtures. Turkish Journal of Agriculture and Forestry 26: 281-288.
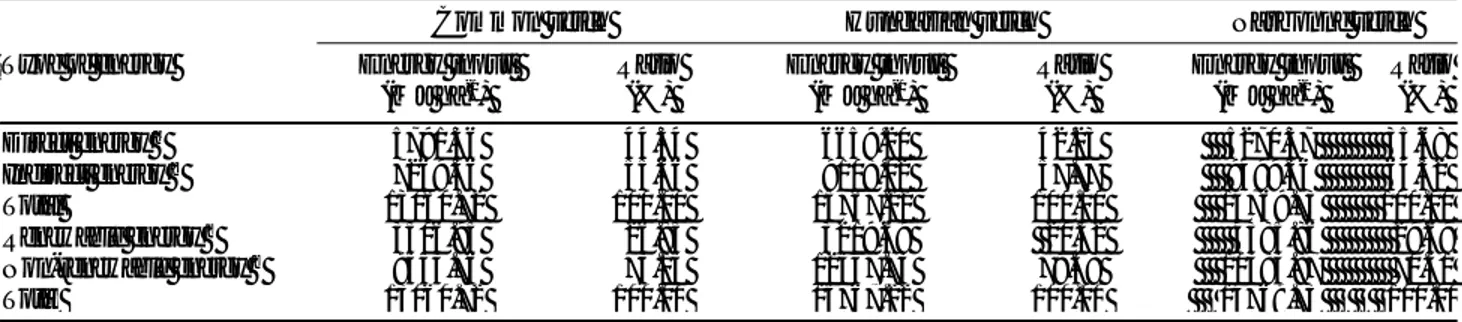
Table 4: Energy inputs in the form of direct, and indirect renewable and non-renewable energy for common vetch, hungarian vetch and
narbonne vetchproduction
a Includes human labour and diesel fuel; b Includes seed, chemical fertilizers and machinery; c Includes human labour and seed; d Includes diesel fuel, chemical fertilizers and machinery.
Common vetch Hungarian vetch Narbonne vetch Type of energy Energy input
(MJ ha-1) Ratio (%) Energy input (MJ ha-1) Ratio (%) Energy input (MJ ha-1) Ratio (%) Direct energy a 5791.36 44.34 6659.20 42.23 5270.37 35.68 Indirect energy b 7269.36 55.66 9108.02 57.77 9499.36 64.32 Total 13060.72 100.00 15767.22 100.00 14769.73 100.00 Renewable energy c 3506.95 26.85 3219.69 20.42 4385.86 29.69 Non-renewable energy d 9553.76 73.15 12547.73 79.58 10383.87 70.31 Total 13060.72 100.00 15767.22 100.00 14769.73 100.00
Büyükburç U, Iptas S, Karadag Y, Acar A A. (2004). Tokat-Kazova kosullarinda kislik ekilen bazi adi fig (Vicia sativaL.) hat ve çesitlerinin tohum verimi ve bazi verim kriterlerinin belirlenmesi.Tarla Bitkileri Merkez Arastirma Enstitüsü
Dergisi 88-100(In Turkish).
Çelik Y, Peker K, Oguz C. (2010). Comparative analysis of energy efficiency in organic and conventional farming systems: A case study of black carrot (Daucus carotaL.) production in Turkey. Philipp Agric Scientist 93: 224-231. Demircan V, Ekinci K, Keener H M, Akbolat D, Ekinci C. (2006). Energy and economic analysis of sweet cherry production
in Turkey: A case study from Isparta province. Energy Conversion and Management 47:1761-1769.
El Saleh Y. (2000). Suriye ve Türkiye’de mercimek ve nohut hasadinda mekanizasyon olanaklarinin belirlenmesi üzerine bir arastirma. Doktora Tezi, Çukurova Üniversitesi Fen Bilimleri Enstitüsü (Yayimlanmamis) Adana (In Turkish). Ghorbani R, Mondani F, Amirmoradi S, Feizi H, Khorramdel S, Teimouri M, Sanjani S, Anvarkhah S, Aghel H. (2011). A case study of energy use and economical analysis of irrigated and dryland wheat production systems. Applied
Energy 88: 283-288.
Göktürk B. (1999). Kuru soganin hasada yönelik bazi özelliklerinin saptanmasi, kazici biçakli tip hasat makinesinin gelistirilmesi ve diger hasat yöntemleri ile karsilastirilmasi üzerine bir arastirma. Doktora Tezi, Trakya Üniversitesi Fen Bilimleri Enstitüsü (Yayimlanmamis), Tekirdag (In Turkish).
Güzel E. (1986). Çukurova Bölgesinde yerfistiginin söküm ve h armanlanmasinin mekanizasyonu ve bitk inin mekanizasyona yönelik özelliklerinin saptanmasi üzerine bir arastirma. Türkiye Zirai Donatim Kurumu Mesleki Yayinlari, Yayin No: 47 Ankara (In Turkish).
Haciseferogullari H, Acaroglu M, Gezer I. (2003). Determination of the energy balance of the sugar beet plant. Energy
Sources 25: 15-22.
Iptas S, Yilmaz M. (1998). Tokat sartlarinda yetistirilen degisik Macarfigi + arpa karisim oranlarinin verim ve kaliteye etkileri. Ege Tarimsal Arastirma Enstitüsü Dergisi 8: 106-114.
Isik A, Sabanci A. (1991). A research on determining basic management data and developing optimum selection models of farm machinery and power for the mechanization planning in the irrigated farming of the Çukurova region.
Turkish Journal Agric. Forestry15: 899-920.
Karaagaç M A, Aykanat S, Çakir B, Eren O, Turgut M M, Barut Z B, Öztürk H H. (2011). Energy balance of wheat and maize crops production in Haciali undertaking. 11th International Congress on Mechanization and Energy in
Agriculture Congress, Istanbul, Turkey, 388-391.
Kizilaslan, H. (2009). Input-output energy analysis of cherries production in Tokat province of Turkey. Applied Energy
86: 1354-1358.
Kitani, O. (1999). Energy for biological systems. In: The International Commission of Agricultural Engineering, editor, CIGR Handbook of Agricultural Engineering: Energy and Biomass Engineering, Vol. V. American Society of Agricultural Engineers 13-42.
Kocturk O M, Engindeniz S. (2009). Energy and cost analysis of sultana grape growing: A case study of Manisa, west Turkey. African Journal of Agricultural Research 4: 938-943.
Mani I, Kumar P, Panwar J S, Kant K. (2007). Variation in energy consumption in production of wheat-maize with varying altitudes in hill regions of Himachal Prades, India. Energy 32: 2336-2339.
Mandal K G, Saha K P, Ghosh P K, Hati K M, Bandyopadhyay K K. (2002). Bioenergy and economic analysis of soybean based crop production systems in central India. Biomass and Bioenergy 23: 337-345.
Marakoglu T, Ozbek O, Carman K. (2010). Application of reduced soil tillage and non-tillage agriculture techniques in Harran plain (Second crop maize and sesame growing). Journal of Agricultural Machinery Science 6: 229-235. Mobtaker H G, Keyhani, A, Mohammadi A, Rafiee S, Akram A. (2010). Sensitivity analysis of energy inputs for barley
production in Hamedan Province of Iran. Agriculture, Ecosystems and Environment 137: 367-372.
Mohammadi A, Tabatabaeefar A, Shahin S, Rafiee S, Keyhani A. (2008). Energy use and economical analysis of potato production in Iran a case study: Ardabil province. Energy Conversion and Management 49: 3566-3570. Mohammadi A, Rafiee S, Mohtasebi S S, Rafiee H. (2010). Energy inputs-yield relationship and cost analysis of kiwifruit
production in Iran. Renewable Energy 35: 1071-1075.
Özcan M T. (1986). Mercimek hasat ve harman yöntemlerinin is verimi, kalitesi, enerji tüketimi ve maliyet yönünden karsilastirilmasi ve uygun bir hasat makinasi gelistirilmesi üzerine arastirmalar. Türkiye Zirai Donatim Kurumu Yayinlari, Yayin No: 46. Ankara (In Turkish).
Öztürk H H, Ekinci K, Barut Z B. (2006). Energy analysis of the tillage systems in second crop corn production. Journal
of Sustainable Agriculture 28: 25-37.
Pervanchon F, Bockstaller C, Girardin P. (2002). Assessment of energy use in arable farming systems by means of an agro ecological indicator: the energy indicator. Agricultural Systems 72: 149–172.
Pishgar-Komleh S H, Sefeedpari P, Rafiee S. (2011). Energy and economic analysis of rice production under different farm levels in Gulian province of Iran. Energy 36: 5824-5831.
Singh J M. (2002). On farm energy use pattern in different cropping systems in Haryana, India. International Institute of Management University of Flensburg, Sustainable Energy Systems and Management. Master of Science Thesis Germany.
Singh H, Mishra D, Nahar N M, Ranjan M. (2003). Energy use pattern in production agriculture of a typical village in Arid Zone India (Part II). Energy Conversion and Management 44: 1053-1067.
Sonmete M H. (2006). Fasulyenin hasat-harman mekanizasyonu ve gelistirme olanaklari. Doktora Tezi, Selçuk Üniversitesi Fen Bilimleri Enstitüsü (Yayimlanmamis) Konya (In Turkish).
Unakitan G, Hurma H, Yilmaz F. (2010). An analysis of energy use efficiency of canola production in Turkey. Energy 35: 3623-3627.
Uzunöz M, Akçay Y, Esengün K. (2008). Energy input-output analysis of sunflower seed (Helianthus annuus L.) oil in Turkey. Energy Sources, Part B: Economics, Planning and Policy 3: 215-223.
Vural H, Efecan I. (2012). An analysis of energy use and input costs for maize production in Turkey. Journal of Food,