ORIGINAL PAPER
Central composite design and response surface methodology
for the optimization of Ag
+-HPLC/ELSD method for triglyceride
profiling
Fatma Nur Arslan1,2 · Huseyin Kara2
Received: 16 July 2016 / Accepted: 29 December 2016 / Published online: 21 January 2017 © Springer Science+Business Media New York 2017
robust Ag+-HPLC/ELSD method for triglyceride profiling
and is also suitable for a number of applications and ana-lytical method developments for vegetable oils.
Keywords Silver ion high performance liquid
chromatography · Vegetable oil · Response surface methodology · Evaporative light scattering detector · Analysis of variance
Abbreviations
Ag+-HPLC Silver ion high performance liquid
chromatography ANOVA Analysis of variance
AOCS American oil chemical society CCD Central composite design
ELSD Evaporative light scattering detector Eq Equation
HPLC High performance liquid chromatography NP-HPLC Normal phase high performance liquid
chromatography
RP-HPLC Reverse phase high performance liquid chromatography
RSM Response surface methodology TAG Triacylglycerol
Introduction
Triacylglycerols (TAGs) are the main constituents (~95%) in fats and oils and derived from the esterification of glyc-erol with three fatty acids (FAs). The chemical, physical and nutritional properties of fats and oils are associated with the structure and configuration of FAs in TAG mol-ecules. Chemically, all fats and oils are described as esters of glycerin and FAs; even so, their physical properties vary
Abstract The study presents the application of central
composite design (CCD) and response surface methodol-ogy (RSM) for the optimization of silver-ion normal phase HPLC/ELSD (Ag+-HPLC/ELSD) method parameters to
profile the isomers of triglycerides in vegetable oils. The significance of a second-order polynomial model for pre-dicting the optimal values of Ag+-HPLC/ELSD method
parameters was evaluated by the analysis of variance, ANOVA, and 3D response surface plots for the interactions between three variables were constructed. Three experi-mental parameters were chosen as independent variables which are the flow rate of mobile phase, temperature of
column compartment and concentration of sample. A
mul-tivariate five-level CCD and RSM were used to confirm a quadratic model as a functional relationship between the response values (Rs, N, α and k′) and variables. The opti-mum values of parameters were found to be a flow rate of 1.25 mL min−1, temperature of column compartment
of 20 °C, and sample concentration of 5 × 10⁻² mg µL−1.
Regression analysis with an R2 values indicated as an
ade-quate correlation between the experimental and predicted response values. ANOVA test results were also confirm that the models can be successfully used to predict the opti-mum parameters of Ag+-HPLC/ELSD method. Therefore,
the proposed model provides an efficient, automated, and
* Fatma Nur Arslan [email protected] Huseyin Kara [email protected]
1 Department of Chemistry, Faculty of Science, University of Karamanoglu Mehmetbey, 70100 Karaman, Turkey 2 Department of Chemistry, Faculty of Science, University
extensively. This is attributed to two major reasons; (i) the ratios of FAs vary over wide ranges, and (ii) the composi-tion of TAGs vary for all fats and oils. TAGs are character-ized by the total carbon number (CN), type and position/ configuration of FAs, and also the number, position, and configuration of double bonds (DBs) in FAs [1–3]. There-fore, the knowledge of TAG structures is highly desirable for research studies on lipids.
The main possibilities of analysis for TGs are the follow-ing as: (i) silver-ion high performance liquid chromatogra-phy (Ag+-HPLC) [4, 5], (ii) mass spectroscopy (MS) [6],
(iii) enzymatic hydrolysis followed by analytical techniques [7, 8], (iv) derivatization after hydrolysis followed by chi-ral HPLC [9] and (v) nuclear magnetic resonance (NMR) [10]. Among these techniques, Ag+-HPLC method is a
powerful technique for TGs separation. The principle of the method is based on the capability of unsaturated com-pounds to generate weak reversible-complexes by transition a silver-ions. In Ag+-HPLC technique, silver-ions are
inte-grated into the stationary phase interacting with π electrons of DBs during analysis. The separation mechanism is based on specific silver-ion/double bond interactions. The elution order is associated to an increasing unsaturation degree and position/configuration of fatty acid DBs [4, 10]. Several analytical methodologies related to analysis of TGs; such as thin-layer chromatography (TLC) [11, 12], reserved-phase HPLC (RP-HPLC) [13–16], non-aqueous RP-HPLC [17, 18], normal-phase HPLC (NP-HPLC) [19], high-tem-perature gas–liquid chromatography (HT-GLC) [20–22] and Ag+-HPLC have been also reported. GLC technique
has some problems due to the fact that the trans-esterifica-tion of polyunsaturated TAGs isn’t always quantitative and there is less information about whole composition of TAGs [23, 24]. The chromatographic separation of TAG isomers most usually covers HPLC with reversed-phase and silver-ion techniques with UV, RID, MS or ELSD detector sys-tems [17, 19, 25]. However, most of these HPLC methods are very time-consuming and laborious and require the use of large amounts of chemicals so as to may be dangerous for the environment. Hence, it is very important to optimize the method conditions, minimizing the operational cost whilst maximizing the separation performance of triglycer-ides [4, 26–28].
Herein, a central composite calibration design (CCD) with five levels and three factors was applied to optimize the experimental parameters of normal phase Ag+-HPLC/
ELSD analyses and to achieve an excellent separation for triglyceride profiling. With response surface methodology (RSM), the interaction of method parameters on separa-tion of TAGs isomers was evaluated with a planned set of experiments in detail. The relationships between the responses and levels of each variables were illustrated by expressing the polynomial equations in the figure of a
three-dimensional (3D) surface plots. For triglyceride pro-filing analysis, RP-HPLC/RID technique was also applied and obtained results were compared with normal phase Ag+-HPLC/ELSD results by using statistical tests.
Experimental
Chemicals, reagents and samples
HPLC grade solvents n-hexane, isopropanol, acetone and acetonitrile, were purchased from VWR International (Poole, UK) and Sigma–Aldrich (St. Louis, USA). TAG standard materials (LLnLn, LLLn, LLL, OLLn, PLLn, OLL, PLL, OOL, POL, StLL, PPL, OOO, StOL and PLSt) were purchased from Sigma–Aldrich (St. Louis, USA). The following triglyceride abbreviations are used in this study: P, palmitic acid (C16:0); St, stearic acid (C18:0); O, oleic acid (C18:1, ∆9); L, linoleic acid (C18:2, ∆9, 12) and Ln, linolenic acid (C18:3, ∆9, 12, 15). The refined and cold-pressed oil samples were purchased from a local market in Konya, Turkey and subsequently stored at room tempera-ture. Vegetable oil samples were dissolved in hexane to pre-pare at concentrations of 0.8 × 10⁻², 2.5 × 10⁻², 5 × 10⁻²,
7.5 × 10⁻² and 9.2 × 10⁻² mg µL−1. Prior to analyses the
solutions were degassed in ultrasonic bath for 20 min and analyses were repeated at least three times.
Ag+-HPLC/ELSD application for triglyceride analysis
Normal phase Ag+-HPLC/ELSD analyses were performed
using an Agilent 1200 series HPLC system (Agilent Tech-nologies Inc., USA), consisting of a G1311A model qua-ternary pump, a G1328B model standard auto-sampler, a G1316A model thermostatted column compartment and a 385 model evaporative light scattering detector (ELSD). Different lengths of peek tubing and other connection appa-ratus were also used to afford links among the system parts. The data were recorded using an Agilent ChemStation 2001–2010 data processor.
For Ag+-HPLC/ELSD chromatographic separation, a
ChromSpher 5 lipids Ag+-HPLC column (250 × 4.6 mm, 5 µm
id; Varian Inc.) was used. As a mobile phase hexane (solvent A) and hexane: isopropanol: acetonitrile (75:22.5:2.5, v/v/v) mix (solvent B) were used in the following gradient mode: 0–10 min 0% B; 10–32 min 0–18% B; 32–37 min 18–35% B; 37–38 min 35–100% B and 38–41 min 100–0% B. The mobile phase was prepared fresh every day before analyses. Silver-ion column was conditioned at 100 µL min−1 of the initial mobile
phase composition over night and at 1 mL min−1 for 2 h before
the first analysis. The signals were sequentially recorded by ELSD system. ELSD settings for nebulisation and evapora-tion temperatures were set as 80 and 40 °C, respectively. Also,
the flow rate of nebulizer gas was set to 1.5 standard litres per minute [26]. To achieve the efficient separations for triglyc-eride lipids, Ag+-HPLC/ELSD parameters was optimised by
using central composite design (CCD) and response surface methodology (RSM). This applications and procedures were given in detail in “Central composite design and response sur-face methodology study” section.
Central composite design and response surface methodology study
In order to determine the effects of method parameters, RSM was applied using the experimental design generated by excel database (Microsoft, 2007). CCD resulting in 14 pos-sible combinations of both independent factors and 9 cen-tral points were used in the model. Factors or independent
variables are experimental variables that can be changed
independently of each other. Typical independent variables include the pH, temperature, concentration of reagents, flow rate, mobile phase composition, and elution strength, among others [30–33]. The variables selected for the optimization study were the concentration (mg µL−1), temperature (°C)
and flow rate of mobile phase (mL min−1) and each
varia-ble was studied at five levels (−1.68, −1, 0, +1, +1.68). The range and levels of these variables are given in Table 1.
This allows the quadratic terms to interfere in the model for estimation of the optimum of factors. The total number of experiment is calculated based on;
where f is the number of factors and N is the replica-tion of centre point. The α value is defined as the distance between axial and centre points, α = (2f)1/4. As inscribed
CCD is a scaled down of circumscribed CCD, the factorial design is further divided by α, demonstrating a 1/α coded level. So, coded value of 0.5946 is generated from 1/1.6818 [29–31]. The coefficients indicate the behaviour of differ-ent factors on the response where various models can be described [31]. The quadratic model:
a = � √N × Nf −Nf 2 (1) y = 𝛽0+𝛽1⋅ X1+𝛽2⋅ X2+𝛽3⋅ X3+𝛽11⋅ X12+𝛽22⋅ X 2 2+𝛽33⋅ X 2 3+𝛽12⋅ X1⋅ X2+𝛽13⋅ X1⋅ X3+𝛽23⋅ X2⋅ X3+𝛽123⋅ X1⋅ X2⋅ X3
where “y” represents the response value, β0 is a con-stant which shows where the line intersects the y-axis and allows the average impact of the factors, β1, β2 and
β3 are regression coefficients, β12, β13, β23 and β123 are the regression coefficients for the interaction of variables [32]. The response surface plots were originated using MATLAB R2007b (MathWorks, United States) software and the relationship between the responses and levels of each variables could be illustrated by expressing the polynomial equation in the figure of a three-dimensional (3D) surface plots.
RP-HPLC/RID application for triglyceride analysis (AOCS Ce 5b-89 method)
Reverse phase HPLC/RID analyses were performed using an Agilent 1200 series HPLC system (Agilent Tech-nologies Inc., USA). For the RP-HPLC/RID separation, ACE-5 C18 column (250 × 4 mm i.d., 5 µm) and the mobile phase, a mixture of acetone:acetonitrile (50:50, v/v) was used as stationary and mobile phase, respec-tively. The mobile phase was run under isocratic condi-tions at a flow rate of 1.5 mL min−1 for duration of 40 min
and chromatograms were recorded with a G1362A model refractive index detector (RID).
Statistical analysis and validation/quality of the experimental model
The data were recorded by Agilent ChemStation 2001 data processor. The software MATLAB R2007b (Math-Works, USA), Excel database (Microsoft, 2007) and OriginPro 8 (OriginLab, USA) were applied for statisti-cal statisti-calculations. Analysis of variance was employed to determine the model quality and significance of vari-ous factors on the separation efficiency considering the sum of squares and residual sum of squares. The analysis included the F test, related probability values, coefficient of determination R2 which measures the goodness of fit
of regression model.
Table 1 Coded and actual
levels of variables for central composite design (CCD) matrix
Factors (variables), Xi Levels of the factors
−1.68 −1 0 +1 +1.68
Mobile phase flow rate (mL min−1), X
1 0.58 0.75 1 1.25 1.42
Column temperature (°C), X2 16.6 20 25 30 33.4
Sample concentration (mg 5 µL−1), X
Results
Optimization of Ag+-HPLC/ELSD method parameters
by using CCD and RSM, method validation and statistical analysis
Normal phase silver-ion HPLC (Ag+-HPLC) technique is
commonly employed in analysis of TAG molecules. The separation principle of technique is based on specific sil-ver-ion/DB interactions and the elution sequence is con-nected to a raise degree of unsaturation and position of DBs in FAs. However, it is well-known that the silver-ion normal-phase chromatography systems suffer from a lower repeatability of retention times for TAGs in comparison to reversed-phase systems. Herein, the maximum atten-tion has been paid to the optimizaatten-tion study for chromato-graphic performance in terms of separation of TAGs iso-mers using Ag+-HPLC/ELSD technique.
Conventionally, optimization studies have been carried out by monitoring the impact of one factor at a time on an experimental response value. While only one parameter is changed, others are kept at a stable level. This optimi-zation procedure doesn’t describe the complete effects of parameters, since it doesn’t include the interactive effects among the studied factors and it is the increase in the number of experiments necessary to perform the research [32–34]. To overcome this problem, the improving of ana-lytical methods has been carried out by using experimental design techniques. Several applications of the CCD in the optimization of chromatographic or analytical procedures can be found in the literature, such as optimization of the chromatographic separations of pharmaceuticals by HPLC [35], improving the chiral separation of drugs by affinity electrokinetic chromatography [36], the simultaneous sepa-ration of substances in food products [37]. Thus, CCD is still the second-order experimental design most utilized for the development and optimization of analytical procedures.
A complete 23 experiment of the CCD were conducted in this study (Table 2). The coded/experimental values of CCD and four predicted/calculated response values are given in Table 2. To evaluate the outcome of CCD experi-ments, the peak resolution values (Rs), number of theoreti-cal plates (N), selectivity (α) and retention factors (k’) were used as a response values (R). The experiments were per-formed in three replicates in order to fit the second-order polynomial model. The coefficients of proposed model were evaluated by using regression analysis and tested for significance.
All of the experiments of CCD were required to estimate of the full model by using the polynomial model given in Eq. 1. The different responses which were obtained from the CCD study (Table 2) were subjected to multiple regression using the excel database, and the coefficients
of polynomial models were obtained. The equation for N value was given in Eq. 2, as an instance.
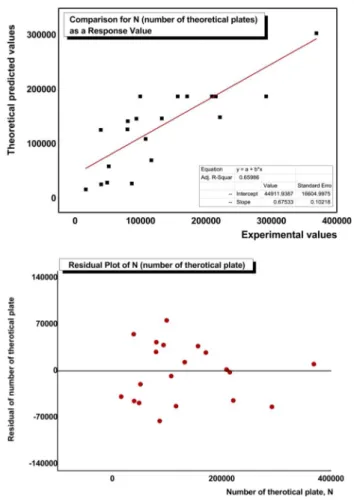
Compared results of the experimental and predicted val-ues for N response valval-ues were also given in Fig. 1. The predicted values from the empirical model match well with the observed ones within the experimental values. Regres-sion analysis results with an R2 values point out suitable
correlations between the values. The plots of residuals ver-sus predicted responses are also shown in Fig. 1. As can be seen from the plots of residuals, the distributions of residu-als are random without any trends. Results shows that the fitted models present maximum approach to the relation-ship between the factors and responses and sufficient to evaluate the effect of factors.
In CCD studies, it is necessary to check the fitted-model to guarantee that it provides an adequate estimation to the real analysis systems. If the fitted-model shows an inad-equate fit, proceeding with the determination and optimi-zation of the fitted response surface likely could result in poor data. Also, the residuals play an important role in evaluation of the model adequacy [38]. Herein, the impacts of factors were also adopted to assess the adequacy of preferred model. To evaluate the effect of factors, normal probability plots were drawn for N response values (Fig. 2). As given in Fig. 2, the normality possibilities are satisfac-tory, because the residual plots cluster around the diagonal line. The qualities of the fitted model’s significance were also checked by normal distribution graphs. The quality of the fitted quadratic model’s statistical significance was also checked by one-way ANOVA test (Table 3). From the ANOVA of the empirical second-order polynomial model for N response value, the Fexperimental value for the model is 3.00, indicating that the model is significant. The proposed CCD model is also significant and adequate with experi-mental conditions for all response values. This is an expres-sion to the quality of response surface models’ robust.
Effect of mobile phase flow rate and column compartment temperature
The chromatographic resolution of TAGs in Ag+-HPLC
systems is significantly affected by flow rate of mobile phase and temperature [39]. In this regard, the influence of flow rate and temperature factors on Rs, N, α and k′ val-ues was investigated between 0.58 and 1.42 mL min−1 flow
(2) yN = −2540548.457 + 2752594.448 ⋅ X1+ 114992.663⋅ X2+ 21132342.19 ⋅ X3− 282575.3878 ⋅ X1⋅ X1− 1154.69412 ⋅ X2⋅ X2− 59907897.64 ⋅ X3⋅ X3− 78668.56055 ⋅ X1⋅ X2− 468902.3196 ⋅ X2⋅ X3− 25261722.71 ⋅ X1⋅ X3+ 811697.7135 ⋅ X1⋅ X2⋅ X3
Table
2
Centr
al com
posite design (CCD) matr
ix and r esults wit h fiv e le vels/t hr ee f act ors f or op timization s tudy of Ag +-HPL C/EL SD me thod par ame ters Exp. no Var iables f or t he centr al com
posite design (CCD) matr
ix wit h fiv e le vels and t hr ee f act ors
X1 Mobile phase flo
w rate (mL min −1) X2 Column tem -per atur e (°C) X3 Sam ple concentr ation (mg µL −1) Response v alue, Rs Response v alue, N Response v alue,α Response v alue, k ′ Exper iment al Pr edicted Exper iment al Pr edicted Exper iment al Pr edicted Exper iment al Pr edicted 1 −1 (0.75) −1 (20) −1 (2.5 × 10 −2) 1.76 2.35 107,921 110,040 1.02 1.03 7.66 7.56 2 1 (1.25) −1 (20) −1 (2.5 × 10 −2) 4.30 3.84 368,804 304,229 1.03 1.03 10.95 10.74 3 −1 (0.75) 1 (30) −1 (2.5 × 10 −2) 1.39 2.16 80,151 127,573 1.02 1.03 7.83 7.71 4 1 (1.25) 1 (30) −1 (2.5 × 10 −2 ) 1.52 1.24 49,154 29,882 1.03 1.03 10.11 9.89 5 −1 (0.75) −1 (20) 1 (7.5 × 10 −2) 1.49 2.16 51,616 59,674 1.03 1.04 7.65 7.58 6 1 (1.25) −1 (20) 1 (7.5 × 10 −2) 1.87 1.49 86,806 28,169 1.03 1.03 10.84 10.67 7 −1 (0.75) 1 (30) 1 (7.5 × 10 −2) 2.02 2.87 93,783 147,143 1.03 1.04 7.72 7.64 8 1 (1.25) 1 (30) 1 (7.5 × 10 −2) 0.95 0.75 40,016 26,682 1.02 1.02 11.12 10.93 9 0 (1.00) 0 (75) 0 (5.0 × 10 −2) 1.88 1.69 215,066 188,145 1.02 1.02 8.63 8.66 10 −1.68 (0.58) 0 (85) 0 (5.0 × 10 −2) 5.11 3.58 221,398 149,947 1.05 1.04 6.18 6.26 11 1.68 (1.1.42) 0 (90) 0 (5.0 × 10 −2 ) 1.68 2.65 39,305 126,650 1.04 1.04 10.85 11.18 12 0 (1.00) −1.68 (16.6) 0 (5.0 × 10 −2) 2.85 2.78 80,666 142,545 1.05 1.04 9.23 9.42 13 0 (1.00) 1.68 (33.4) 0 (5.0 × 10 −2) 2.08 1.59 116,779 70,795 1.03 1.03 9.04 9.26 14 0 (1.00) 0 (25) −1.68 (0.8 × 10 −2) 1.61 1.43 132,563 147,579 1.02 1.02 8.69 8.94 15 0 (1.00) 0 (25) 1.68 (9.2 × 10 −2) 0.83 0.46 16,478 17,355 1.03 1.02 9.17 9.33 16 0 (1.00) 0 (25) 0 (5.0 × 10 −2) 1.92 1.69 209,130 188,145 1.02 1.02 8.61 8.66 17 0 (1.00) 0 (25) 0 (5.0 × 10 −2) 1.35 1.69 171,297 188,145 1.01 1.02 8.59 8.66 18 0 (1.00) 0 (25) 0 (5.0 × 10 −2 ) 1.35 1.69 171,297 188,145 1.01 1.02 8.59 8.66 19 0 (1.00) 0 (25) 0 (5.0 × 10 −2) 1.35 1.69 171,297 188,145 1.01 1.02 8.59 8.66 20 0 (1.00) 0 (25) 0 (5.0 × 10 −2) 1.55 1.69 156,940 188,145 1.02 1.02 8.57 8.66 21 0 (1.00) 0 (25) 0 (5.0 × 10 −2) 1.87 1.69 99,623 188,145 1.03 1.02 8.96 8.66 22 0 (1.00) 0 (25) 0 (5.0 × 10 −2) 1.86 1.69 292,104 188,145 1.02 1.02 8.72 8.66 23 0 (1.00) 0 (25) 0 (5.0 × 10 −2) 1.97 1.69 209,373 188,145 1.02 1.02 8.74 8.66
rates and temperature between 16.6 and 33.4 °C, by using CCD. By contrast with other chromatographic systems, the retention of TAG isomers in silver-ion HPLC column increases with enhanced temperature. The retention times of TAG peaks are highly decreased with an increase in the flow rate of mobile phase. Thus, the excellent isomeric separation of TAGs and an improvement was observed at lower column temperature, higher flow rate applications. By using the second-order polynomial equations, three dimensional (3D) views of response surface plots were drawn for N response values and given in Fig. 3. By draw-ing these plots, the optimum values and impacts of factors could be determined and these graphs are widely used to achieve better understandings of the inter-relationship between experimental variables. The relationships between flow rate of mobile phase (X1) and temperature of column compartment (X2) for N response values are illustrated in Fig. 3a.
As can be seen in the response surface graphs in Fig. 3a, the maximum response values were obtained at high flow rate experiments. When the flow rate was set at high rates (1.00–1.42 mL min−1), it has observed that the response
values were significantly high. The response surface graphs indicated that increase of the flow rate has an important effect, and it influences all of the response values. This may be due to the requirement of enough time for specific silver-ion/double bond interactions between π electrons of silver-ion stationary phase and double bounds of TAGs eluted with mobile phase. Hence, for all column compart-ment temperature applications the 1.25 mL min−1 flow rate
application was selected as optimum value.
Effect of column compartment temperature and concentration
It is well known, the ideal column temperature could ensure a good separation and selectivity of TAGs isomers [4, 39]. The impact of temperature and concentration factors on all response values was investigated between 0.8 × 10⁻² and
9.2 × 10⁻² mg µL−1 concentration and temperature between
16.6 and 33.4 °C. The best resolution for most of the TAG isomers was obtained at lower sample concentrations. The similar results were obtained for all temperature applica-tions. However, the retention times are highly decreased with an increase in the temperature of column compart-ment. Therefore, the excellent separations were detected at concentration of 5.0 × 10⁻² mg µL−1 and 20 °C applications.
The inter-relationships between temperature of col-umn compartment (X2) and sample concentration (X3) for N response values, are illustrated with response sur-face graphs in Fig. 3b. As can be seen in the response surface graphs in Fig. 3b, the greatest response val-ues were obtained at lower temperature and sample Fig. 1 Comparison of theoretical and experimental data and residual
plots of N response values, obtained from ANOVA test for optimiza-tion study of Ag+-HPLC/ELSD method parameters
Fig. 2 Normal distribution curves showing the effect of significant
factors of Ag+-HPLC/ELSD method parameters on number of theo-retical plates, N response values
concentration applications. The 3D-surface graph indi-cated that decrease of temperature and concentration has a significant effect on the response values. For excellent separations, avoiding the excessive sample loading to
chromatographic column and selection of the optimum temperature are very crucial for interaction between sil-ver-ion stationary phases and sample.
Table 3 ANOVA test for
validating and confirming the experimental design model
P = 0.05; df1/df2 = 9/13
a F
critical = 2.71
ANOVA test for validating and confirming the experimental design model for N response value
F value P value
Model 9 112,969,036,123.76 12,552,115,124.86 3.00a 0.03544552
Residual 13 54,311,737,857.40 4,177,825,989.03 Lack of fit 5 54,311,737,857.37 10,862,347,571.47
Pure error 8 0.0310 0.0039 Fvalue > Fcritical
Total 22 167,280,773,981.10
Fig. 3 Three-dimensional 3D response surface plots showing the effects of flow rate, concentration and column temperature on Ag+-HPLC/ ELSD method parameters for number of theoretical plates, N response values
Effect of mobile phase flow rate and concentration
The separation of TAG isomers is considerably affected by flow rate of mobile phase and sample concentration. Fig-ure 3c represents the combined effect of mobile phase flow rate (X1) and sample concentration (X3) on the N response
values, respectively. The response values were increased with decreased flow rates and concentrations. Thus, the improved separations of TAGs were performed at concen-tration of 5.0 × 10⁻² mg µL−1 and 1.25 mL min−1 flow rate
applications.
The TAG analyses of refined vegetable oils were car-ried out by using the optimized Ag+-HPLC/ELSD method
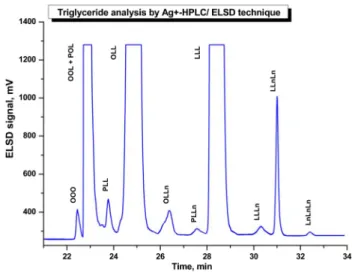
parameters. The TAG profiles obtained from HPLC sys-tem under optimized conditions are illustrated in Fig. 4
and obtained results are given in Table 4. The retention of TAGs in silver-ion method is governed principally by
the number of DBs; however certain separation occurs for TAGs differing only in the length of FA chains. The reten-tion order within these groups with the regular DB number in analysed vegetable oil in this study analysis is the fol-lowing: OOO < OOL + POL < PLL < OLL < OLLn < PLL n < LLL < LLLn < LLnLn < LnLnLn.
As given in Table 4, the vegetable oils have different TAG profiles. The major TAG isomer in sunflower oil, OLL, was present at 30.46%; in corn, canola and soybean oil, OOL + POL, was present at 22.43, 29.21 and 22.90% respectively and in olive oil, OOO, was present at 48.64%, in agreement with the previous reports. Thus, the method proposed Ag+-HPLC/ELSD method is an appropriate
tech-nique for the determination of TAG profile in vegetable oils and is sensitive, rapid and precise. Furthermore, the method may be a significant parameter to detect the adulteration of vegetable oils during quality-control applications.
Triglyceride analysis by RP-HPLC/RID technique (AOCS Ce5b-89 method)
As it is well known, unsaturated TAGs differing in the num-ber of DBs could be well separated by using Ag+-HPLC
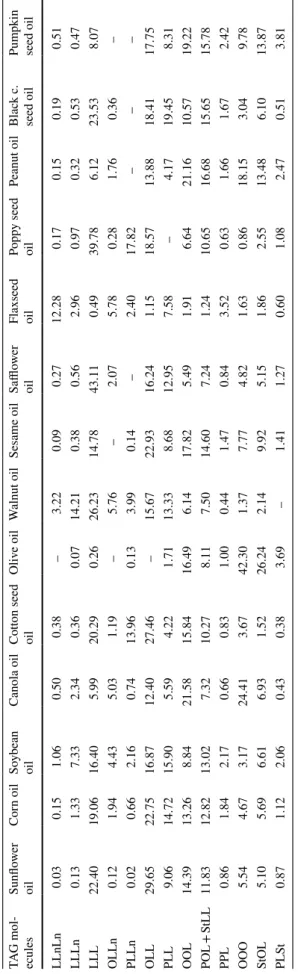
mode; whereas TAGs with the same number of DBs were eluted at the same retention time. However, the TAGs with different ECN values could be well separated on the C18 column by using RP-HPLC mode and with this method, the larger ECN values result in longer retention times on stationary phase. Herein, the TAG analyses of refined and cold-pressed vegetable oils were carried out by using the standard AOCS Ce5b-89 RP-HPLC/RID method and obtained results are given in Table 5.
As given in Table 5, the main TAG isomer, OLL, in refined sunflower, corn, soybean oil and cottonseed oils was present at 29.65, 22.75, 16.87, 27.46% respectively. Likewise, OLL, in cold-pressed sesame, peanut and Fig. 4 Triglyceride profiles of refined corn oil obtained from normal
phase Ag+-HPLC/ELSD system under optimized conditions by CCD
Table 4 Triglyceride analysis
results for refined vegetable oils by using Ag+-HPLC/ELSD method, %
Means within a column are significantly different (P < 0.01) Values are reported as means ± SD of three replicate analyses (n = 3) P palmitic acid, St stearic acid, O oleic acid, L linoleic acid, Ln linolenic acid
TAG molecules Sunflower oil Corn oil Canola oil Soybean oil Olive oil
OOO 5.47 ± 0.17 4.69 ± 0.19 25.10 ± 0.34 3.61 ± 0.10 48.15 ± 0.25 OOL + POL 25.67 ± 0.24 24.43 ± 0.31 29.21 ± 0.22 22.90 ± 0.33 29.46 ± 0.19 PLL 8.55 ± 0.22 14.50 ± 0.34 5.47 ± 0.03 15.42 ± 0.14 1.57 ± 0.02 OLL 30.46 ± 0.32 22.49 ± 0.27 13.14 ± 0.31 16.04 ± 0.13 0.43 ± 0.003 OLLn 0.11 ± 0.002 2.04 ± 0.14 5.05 ± 0.11 4.27 ± 0.09 0.11 ± 0.002 PLLn 0.01 ± 0.001 0.56 ± 0.01 0.79 ± 0.03 2.79 ± 0.01 0.13 ± 0.001 LLL 21.62 ± 0.28 19.63 ± 0.18 6.10 ± 0.22 16.47 ± 0.22 0.25 ± 0.02 LLLn 0.11 ± 0.006 1.25 ± 0.002 3.01 ± 0.10 7.12 ± 0.06 0.06 ± 0.001 LLnLn 0.07 ± 0.001 0.12 ± 0.001 0.94 ± 0.03 1.05 ± 0.01 0.12 ± 0.003 LnLnLn 0.13 ± 0.002 0.19 ± 0.001 0.15 ± 0.02 1.38 ± 0.02 0.01 ± 0.001
Table 5 T rig ly cer ide anal ysis r esults f or r
efined and cold-pr
essed v eg et able oils b y using s tandar d A OCS Ce 5b-89 me thod, % Means wit hin a column ar e significantl y differ ent (P < 0.01) Values ar e r epor ted as means ± SD of t hr ee r eplicate anal yses (n = 3) P palmitic acid, St stear ic acid, O oleic acid, L linoleic acid, Ln linolenic acid TA G mol -ecules Sunflo wer oil Cor n oil So ybean oil Canola oil Co tton seed oil Oliv e oil W alnut oil Sesame oil Safflo wer oil Flaxseed oil Popp y seed oil Peanut oil Blac k c. seed oil Pum pkin seed oil LLnLn 0.03 0.15 1.06 0.50 0.38 – 3.22 0.09 0.27 12.28 0.17 0.15 0.19 0.51 LLLn 0.13 1.33 7.33 2.34 0.36 0.07 14.21 0.38 0.56 2.96 0.97 0.32 0.53 0.47 LLL 22.40 19.06 16.40 5.99 20.29 0.26 26.23 14.78 43.11 0.49 39.78 6.12 23.53 8.07 OLLn 0.12 1.94 4.43 5.03 1.19 – 5.76 – 2.07 5.78 0.28 1.76 0.36 – PLLn 0.02 0.66 2.16 0.74 13.96 0.13 3.99 0.14 – 2.40 17.82 – – – OLL 29.65 22.75 16.87 12.40 27.46 – 15.67 22.93 16.24 1.15 18.57 13.88 18.41 17.75 PLL 9.06 14.72 15.90 5.59 4.22 1.71 13.33 8.68 12.95 7.58 – 4.17 19.45 8.31 OOL 14.39 13.26 8.84 21.58 15.84 16.49 6.14 17.82 5.49 1.91 6.64 21.16 10.57 19.22 POL + StLL 11.83 12.82 13.02 7.32 10.27 8.11 7.50 14.60 7.24 1.24 10.65 16.68 15.65 15.78 PPL 0.86 1.84 2.17 0.66 0.83 1.00 0.44 1.47 0.84 3.52 0.63 1.66 1.67 2.42 OOO 5.54 4.67 3.17 24.41 3.67 42.30 1.37 7.77 4.82 1.63 0.86 18.15 3.04 9.78 StOL 5.10 5.69 6.61 6.93 1.52 26.24 2.14 9.92 5.15 1.86 2.55 13.48 6.10 13.87 PL St 0.87 1.12 2.06 0.43 0.38 3.69 – 1.41 1.27 0.60 1.08 2.47 0.51 3.81
pumpkin seed oils was present mainly at 22.93, 21.16 and 19.22% respectively. The main OOO isomer of TAGs in refined canola and olive oils was determined as 24.41 and 42.30%; LLL isomer in walnut, safflower, poppy seed and black cumin seed oils, was detected as 26.23, 43.11, 39.78 and 23.53%, respectively. Finally, LLnLn was detected as major TAGs for flaxseed oil and determined as 12.28% and obtained data were in agreement with the previous reports. The data means of Ag+-HPLC/ELSD and standard
Ce5b-89 RP-HPLC/RID analyses were also compared using Student’s t test. In comparing the data obtained by using the optimized Ag+-HPLC/ELSD method and RP-HPLC/
RID standard method, null hypothesis (H0) was used at 95 and 99% confidence levels (p = 0.05; p = 0.01). H0
sug-gested that there is no significant difference between the mean averages of method data at 99% confidence level. The statistical test results showed that all t values calcu-lated from experiments were smaller than the tcritical values
(texperimental < tcritical). Therefore, it is very clear that there is
no significant difference between the data obtained by two methods for TAGs.
Conclusion
The study describes the application of central composite calibration design (CCD) and response surface method-ology (RSM) to optimize the Ag+-HPLC/ELSD method
parameters and to achieve an excellent separation and detection of triglyceride isomers. The experimental param-eters of Ag+-HPLC/ELSD method were optimized by
using a statistical five levels/three factors experimental design. The proposed design provides a better understand-ing to the importance of the inter-relationship among three experimental factors To show the empirical relationship between inter-relationships of the experimental factors, the polynomial equations are obtained for response val-ues (Rs, N, α and k′) by using RSM. The optimum valval-ues were found to be a flow rate of 1.25 mL min−1,
tempera-ture of column compartment of 20 °C, and concentration of 5.0 × 10⁻² mg µL−1. Also, the experimental and
pre-dicted values for all response values were compared, and the predicted values from empirical model match well with the observed ones within experimental values. Regression analysis with an R2 values indicated as an adequate
cor-relation between the experimental and predicted response values. ANOVA test results were also show that the models can be successfully used to predict the optimum parameters of Ag+-HPLC/ELSD method. Thus, the proposed models
provides an efficient, automated, and robust methods for triglyceride profiling and is suitable for a great number of research applications and analytical method developments for vegetable oils, in a very short time period.
Acknowledgements The present study is a part of Ph.D thesis
enti-tled “Integration of retarded and pre-concentrated SPE systems to FIA-HPLC systems for vegetable oil analysis and improvement of its applications”. The research was supported by TUBITAK project with 112T373 project number and Selcuk University Coordinators of Scientific Research with 12401045 and 11201063 project numbers, and Karamanoglu Mehmetbey University Scientific Research Project Centre with 14-M-16 project number.
Compliance with ethical standards
Conflict of interest The authors declare no conflict of interest.
References
1. L. Zhang, P. Li, X. Sun, X. Wang, B. Xu, X. Wang, F. Ma, Q. Zhang, X.J. Ding, Agric. Food Chem. 62, 8745 (2014)
2. D. Naviglio, R. Romano, F. Pizzolongo, A. Santini, A. De Vito, L. Schiavo, G. Nota, S.S. Musso. Food Chem. 102, 399–405 (2007)
3. R.D. O’Brien, Fats and Oils, CRC Press LLC Taylor & Francis Group (2004)
4. M. Lísa, H. Velínská, M. Holcˇapek, Anal. Chem. 81, 3903– 3910 (2009)
5. L. Mondello, P.Q. Tranchida, V. Stanek, P. Jandera, G. Dugo, P. Dugo, J. Chromatogr. A 1086, 91–98 (2005)
6. F. Gosetti, U. Chiuminatto, E. Mazzucco, E. Robotti, G. Cala-brese, M.C. Gennaro, E. Marengo, J. Chromatogr. A 1218, 6308–6318 (2011)
7. J. Dutta, A.K. Das, S. Saha. J. Chromatogr. A 154, 33–37 (1978) 8. N.U. Olsson, P. Kaufmann, J. Chromatogr. A 600, 257–266
(1992)
9. M. Biba, E.L. Regalado, N. Wua, C.J. Welch, J. Chromatogr. A
1363, 250–256 (2014)
10. M. Holcapeka, H. Dvoráková, M. Lísa, A.J. Girón, P. Sandra, J. Cvacka, J. Chromatogr. A 1217, 8186–8194 (2010)
11. A. Adel, Y. Shehata, J.M. Man, A.J. Craig, Can. Inst. Food Sci. Technol. J 5, 13–21 (1972)
12. J. Fontecha, H. Goudjil, J.J. Ríos, M. J. Fraga, M. Juarez, Int. Dairy J. 15, 1217–1224 (2005)
13. S. Morera Pons, A.I. Castellote Bargallo, M.C. Lo ́pez Sabater, J. Chromatogr. A 823, 475–482 (1998)
14. D. Gastaldi, C. Medana, V. Giancotti, R. Aigotti, F. Dal Bello, C. Baiocchi, Eur. J. Lipid Sci. Technol. 113, 197–207 (2011) 15. X. Zou, J. Huang, Q. Jin, Z. Guo, Y. Liu, L. Cheong, X. Xu, X.
Wang, J. Agric. Food Chem. 61, 7070–7080 (2013)
16. S. Morera, A.I. Castellote, O. Jauregui, I. Casals, M.C. Lopez-Sabater, Eur. J. Clin. Nutr. 57, 1621–1626 (2003)
17. I. Ten-Doménech, E. Beltrán-Iturat, J.M. Herrero-Martínez, J.V. Sancho-Llopis, E.F. Simó-Alfonso, J. Agric. Food Chem. 63, 5761–5770 (2015)
18. P. Dugo, O. Favoino, P.Q. Tranchida, G. Dugo, L. Mondello, J. Chromatogr. A 1041, 135–142 (2004)
19. S.N. Fedosov, N.A. Fernandes, M.Y. Firdaus, J. Chromatogr. A
1326, 56–62 (2014)
20. A.A.Y. Shehata, J.M. Man, J.C. Alexander, Can. Inst. Food Technol. 4, 61–67 (1971)
21. J.K. Grob, J. Chromatogr. A 178, 387–392 (1979)
22. R.B. Watts, R.D.H. Wehr, J. Chromatogr. A 66, 239–247 (1972) 23. J.L. Bernal, M.T. Martín, L. Toribio, J. Chromatogr. A 1313,
24–36 (2013)
24. M. Buchgraber, F. Ulberth, E. Anklam, J. Agric. Food Chem. 48, 3359–3363 (2000)
25. E.J.C. Van der Klift, G. Vivó-Truyols, F.W. Claassen, F.L. Van Holthoon, T.A. Van Beek, J. Chromatogr. A 1178, 43–55 (2008) 26. F.N. Arslan, University of Selçuk, Institute of Science,
Depart-ment of Chemistry, Konya, Ph.D. thesis, 2015
27. P.Q. Tranchida, P. Donato, G. Dugo, L. Mondello, P. Dugo, TrAC. Trends Anal. Chem. 26, 191–205 (2007)
28. K. Wagner, T. Miliotis, G. Marko-Varga, R. Bischoff, K.K. Unger, Anal. Chem. 74, 809–820 (2002)
29. L.B. Abdulra’uf, G.H. Tan, Food Chem. 177, 267–273 (2015) 30. E. Ghasemi, F. Raofie, N.M. Najaf, Food Chem. 126, 1449–1453
(2011)
31. T.Z.E. Lee, C. Krongchai, N. Lu, S. Kittiwachana, S.F. Sim, Int. J. Ind. Chem. 6, 185–191 (2015)
32. R.G. Brereton, Analyst 122, 1521–1529 (1997)
33. T. Lundstedt, E. Seifert, L. Abramo, B. Thelin, Å. J. Nyström, Pettersen, R. Bergman, Chemometr. Intell. Lab. 42, 3–40 (1998) 34. M.A. Bezerra, R.E. Santelli, E.P. Oliveira, L.S. Villar, L.A.
Escaleira, Talanta 76, 965–977 (2008)
35. T. Mirza, H.I.S. Tan, J. Pharm. Biomed. 25, 39–52 (2001) 36. M.A.M. Gomez, R.M.V. Camanas, S. Sagrado, M.J.M.
Hernan-dez, Electrophoresis 26, 4116–4126 (2005)
37. M.E.P. Hows, D. Perrett, J. Kay, J. Chromatogr. A 768, 97–104 (1997)
38. A. Walia, P. Mehta, S. Guleria, C. K. Shirkot, 3 Biotechnol. 5, 1053–1066 (2015)
39. S. Kadivar, N. De Clercq, B.P. Nusantoro, T.T. Le, K. Dewet-tinck, J. Agric. Food Chem. 617, 896–7903 (2013)