M. Sc. THESIS
JULY 2016
INVESTIGATION OF CONCRETE BARRIERS WITH RECYCLED RUBBER, STEEL SLAG AND ROOF TILE
Thesis Advisor: Asst. Prof. Dr. Adem EREN
IZMIR KATIP CELEBI UNIVERSITY GRADUATE SCHOOL OF NATURAL AND APPLIED SCIENCES ENGINEERING
Ali KURAR
IZMIR KATIP CELEBI UNIVERSITY GRADUATE SCHOOL OF NATURAL AND APPLIED SCIENCES
JULY 2016
INVESTIGATION OF CONCRETE BARRIERS WITH RECYCLED RUBBER, STEEL SLAG AND ROOF TILE
M. Sc. THESIS Ali KURAR (Y120104002)
Department of Civil Engineering
TEMMUZ 2016
İZMİR KÂTİP ÇELEBİ ÜNİVERSİTESİ FEN BİLİMLERİ ENSTİTÜSÜ
GERİ DÖNÜŞTÜRÜLMÜŞ KAUÇUKLU, ÇELİKHANE CÜRUFLU VE KİREMİT TOZLU BETON BARİYERLERİN İNCELENMESİ
YÜKSEK LİSANS TEZİ Ali KURAR (Y120104002)
İnşaat Mühendisliği Ana Bilim Dalı
v
Assoc. Prof. Dr. Erdal AKYOL ... Pamukkale University
Thesis Advisor : Asst. Prof. Dr. Adem EREN ... Izmir Katip Celebi University
Jury Members : Prof. Dr. Lutfullah GUNDUZ ... Izmir Katip Celebi University
Ali Kurar, a M.Sc. student of IKCU Graduate School of Natural and Applied Sciences, successfully defended the thesis entitled “INVESTIGATION OF CONCRETE BARRIERS WITH RECYCLED RUBBER, STEEL SLAG AND ROOF TILE”, which he prepared after fulfilling the requirements specified in the associated legislations, by the jury whose signatures are below.
Date of Submission : June 21st, 2016 Date of Defense : July 13rd, 2016
vii
ix FOREWORD
I would like to thank the following people who helped me to build this study. I would like to thank my wife and my parents for their continuous support and trust in every area of my life. Thanks for always being there for me, believing in me, and motivating me to set out on my own path.
I am also thankful my supervisor Adem EREN for his guidance and being a source aspiration. Furthermore, I would like to thank Lütfullah Gündüz for his advises. Lastly, I would like to thank my great friends and technicians in our laboratory for technical and motivational contributions for this thesis project.
July 2016 Ali KURAR (Civil Engineer)
xi TABLE OF CONTENTS FOREWORD ... ix TABLE OF CONTENTS ... xi ABBREVIATIONS ... xiii LIST OF TABLES ... xv
LIST OF FIGURES ... xvii
SUMMARY ... xxi ÖZET ... xxiii 1. INTRODUCTION ... 1 1.1 Purpose of Thesis ... 4 1.2 Literature Review ... 4 2. EXPERIMENTAL STUDY ... 9 2.1 Methodology ... 9 2.2 Materials ... 9 2.2.1 Cement ... 9
2.2.2 Steel slag as course aggregate ... 10
2.2.3 Roof tile fine aggregate ... 12
2.2.4 Recycled rubber ... 14
2.2.5 Textile waste fiber ... 14
2.3 Mix Design ... 15
2.4 Test Method ... 19
2.4.1 Flexural strength test ... 19
2.4.2 Compressive strength test ... 20
3. TEST RESULTS AND DISCUSSION ... 23
3.1 Flexural Strength Test Results ... 23
3.1.1 Flexural Strength Test Results of Group 1 (55% SSCA) ... 23
3.1.2 Flexural strength result of Group 2 (55% RTFA) ... 31
3.2 Compressive Strength Test Results ... 38
3.2.1 Compressive strength test results of Group 1(55% SSCA) ... 38
3.2.2 Compressive strength results of Group 2 (55% RTFA) ... 45
3.3 Change in compressive strength according to cement ratios ... 52
3.3.1 Change in compressive strength of Group 1 (55% SSCA) according to cement ratios ... 52
3.3.1 Change in compressive strength of Group 2 (55% RTFA) according to cement ratios. ... 54
3.4. Comparison of Flexural and Compressive Strength Results. ... 56
3.4.1. Comparison of flexural and compressive strength results in Group 1 (55% SSCA) ... 56
3.4.1 Comparison of flexural and compressive strength results in Group 2 (55% RTFA) ... 59
3.5. Change between Dry Unit Weight and Recycled Rubber Ratio. ... 62
3.5.1 Change between dry unit weight and recycled rubber ratio in Group 1 (55% SSCA). ... 62
3.5.1 Change between dry unit weight and recycled rubber ratio in Group 2 (55% RTFA) ... 65
xii
4. CONCLUSION ... 69 REFERENCES ... 71
xiii ABBREVIATIONS
ACI : American Concrete Institute
ASTM : American Society for Testing Materials CS : Control Sample
OPC : Ordinary Portland Cement RR : Recycled Rubber
RTFA : Roof Tile Fine Aggregate SSCA : Steel Slag Coarse Aggregate TS : Turkish Standard
xv LIST OF TABLES
Page
Table 2. 1 : Mechanical and physical properties of cement used ... 10
Table 2. 2 : The main chemical components of SSCA. ... 11
Table 2. 3 : Mixing ratio of Group 1 (55% SSCA). ... 16
Table 2. 4 : Mixing ratio of Group 1 (55% RTFA) ... 17
Table 2. 5 : Components of control specimens (CS), Group 1(55% SSCA. ... 18
Table 2. 6 : Components of control specimens (CS), Group 2 (55% RTFA). ... 18
Table 3. 1 : Flexural Strength Test Results of Group 1 (55% SSCA)... 25
Table 3. 2 : Flexural strength result of Group 2 (55% RTFA). ... 32
Table 3. 3 : Compressive strength test results of Group 1 (55% SSCA). ... 39
xvii LIST OF FIGURES
Page
Figure 1.1 : Guardrail (URL 1). ... 2
Figure 1.2 : Concrete Barrier (URL 2). ... 2
Figure 1.3 : Wire Rope Barrier (Yeginobali, Atahan et al.)... 3
Figure 1.4 : Other types of barriers ((Yeginobali, Atahan et al.). ... 3
Figure 2.1: A specific gravity test with Le Chatelier's balloon. ... 10
Figure 2.2 : A specific gravity test with Le Chatelier's balloon (Steel Slag). ... 11
Figure 2.3 : XRD powder pattern of steel slag. ... 12
Figure 2.4 : XRD powder pattern of roof tile. ... 13
Figure 2.5 : A specific gravity test for roof tile with Le Chatelier's balloon. ... 13
Figure 2.6 : Recycled rubber. ... 14
Figure 2.7 : Textile waste fiber. ... 15
Figure 2.8 : Flexural strength test scheme (URL 3) ... 19
Figure 2.9 : Flexural strength test. ... 20
Figure 2.10 : Compressive strenght test. ... 21
Figure 2.11 : Compressive strenght test. ... 21
Figure 2.12 : Internal structure of specimens after failure. ... 21
Figure 3.1 : OPC 35% series, Group 1 ( 55% SSCA and 35% RTFA) flexural strength test results. ... 26
Figure 3.2 : OPC 38% series, Group 1 ( 55% SSCA and 35% RTFA) flexural strength test results. ... 26
Figure 3.3 : OPC 40% series, Group 1 ( 55% SSCA and 35% RTFA) flexural strength test results. ... 26
Figure 3.4 : OPC 43% series, Group 1 ( 55% SSCA and 35% RTFA) flexural strength test results. ... 27
Figure 3.5 : OPC 45% series, Group 1 ( 55% SSCA and 35% RTFA) flexural strength test results. ... 27
Figure 3.6 : Group 1 (55% SSCA), OPC 35% and OPC 38% , 7th day flexural strength test results. ... 28
Figure 3.7 : Group 1 (55% SSCA), OPC 40% and OPC 43% , 7th day flexural strength test results. ... 28
Figure 3.8 : Group 1 (55% SSCA), OPC 43% , 7th day flexural strength test results. ... 28
Figure 3.9 : Group 1 (55% SSCA), OPC 35% and OPC 38% , 14th day flexural strength test results. ... 29
Figure 3.10 : Group 1 (55% SSCA), OPC 40% and OPC 43% , 14th day flexural strength test results. ... 29
Figure 3.11 : Group 1 (55% SSCA), OPC 45% , 14th day flexural strength test results. ... 29
Figure 3.12 : Group 1 (55% SSCA), OPC 35% and OPC 38% , 28th day flexural strength test results. ... 30
Figure 3.13 : Group 1 (55% SSCA), OPC 40% and OPC 43% , 28th day flexural strength test results. ... 30
xviii
Figure 3.14 : Group 1 (55% SSCA), OPC 45%, 28th day flexural strength test results. ... 30 Figure 3.15 : OPC 35% series, Group 2 ( 55% RTFA and 35% SSCA) flexural
strength test results. ... 33 Figure 3.16 : OPC 38% series, Group 2 ( 55% RTFA and 35% SSCA) flexural
strength test results. ... 33 Figure 3.17 : OPC 40% series, Group 2 (55% RTFA and 35% SSCA) flexural
strength test results. ... 33 Figure 3.18 : OPC 43% series, Group 2 ( 55% RTFA and 35% SSCA) flexural
strength test results. ... 34 Figure 3.19 : OPC 45% series, Group 2 ( 55% RTFA and 35% SSCA) flexural
strength test results. ... 34 Figure 3.20 : Group 2 (55% RTFA, 35% SSCA), OPC 35% and OPC 38% , 7th day flexural strength test results. ... 35 Figure 3.21 : Group 2 (55% RTFA, 35% SSCA), OPC 40% and OPC 43% , 7th day flexural strength test results. ... 35 Figure 3.22 : Group 2 (55% RTFA, 35% SSCA), OPC 45%, 7th day flexural
strength test results. ... 35 Figure 3.23 : Group 2 (55% RTFA, 35% SSCA), OPC 35% and OPC 38% , 14th
day flexural strength test results... 36 Figure 3.24 : Group 2 (55% RTFA, 35% SSCA), OPC 40% and OPC 43% , 14th
day flexural strength test results... 36 Figure 3.25 : Group 2 (55% RTFA, 35% SSCA), OPC 40% and OPC 43% , 14th
day flexural strength test results... 36 Figure 3.26 : Group 2 (55% RTFA, 35% SSCA), OPC 35% and OPC 38% , 28th
day flexural strength test results... 37 Figure 3.27 : Group 2 (55% RTFA, 35% SSCA), OPC 40% and OPC 43% , 28th
day flexural strength test results... 37 Figure 3.28 : Group 2 (55% RTFA, 35% SSCA), OPC 45%, 28th day flexural
strength test results. ... 37 Figure 3.29 : OPC 35% series, Group 1 ( 55% SSCA and 35% RTFA) compressive
strength test results. ... 40 Figure 3.30 : OPC 38% series, Group 1 ( 55% SSCA and 35% RTFA) compressive strength test results. ... 40 Figure 3.31 : OPC 40% series, Group 1 ( 55% SSCA and 35% RTFA) compressive strength test results. ... 40 Figure 3.32 : OPC 43% series, Group 1 ( 55% SSCA and 35% RTFA) compressive
strength test results. ... 41 Figure 3.33 : OPC 45% series, Group 1 ( 55% SSCA and 35% RTFA) compressive strength test results. ... 41 Figure 3.34 : Group 1 (55% SSCA, 35% RTFA), OPC 35% and OPC 38% , 7th day flexural strength test results. ... 42 Figure 3.35 : Group 1 (55% SSCA, 35% RTFA), OPC 40% and OPC 43% , 7th day flexural strength test results. ... 42 Figure 3.36 : Group 1 (55% SSCA, 35% RTFA), OPC 45%, 7th day flexural
strength test results. ... 42 Figure 3.37 : Group 1 (55% SSCA, 35% RTFA), OPC 35% and OPC 38%, 14th
day flexural strength test results... 43 Figure 3.38 : Group 1 (55% SSCA, 35% RTFA), OPC 40% and OPC 43%, 14th
xix
Figure 3.39 : Group 1 (55% SSCA, 35% RTFA), OPC 45%, 14th day flexural strength test results. ... 43 Figure 3.40 : Group 1 (55% SSCA, 35% RTFA), OPC 35% and OPC 38%, 28th
day flexural strength test results. ... 44 Figure 3.41 : Group 1 (55% SSCA, 35% RTFA), OPC 40% and OPC 43%, 28th
day flexural strength test results. ... 44 Figure 3.42 : Group 1 (55% SSCA, 35% RTFA), OPC 45%, 28th day flexural
strength test results. ... 44 Figure 3.43 : OPC 35% series, Group 2 ( 55% RTFA and 35% SSCA) compressive strength test results. ... 47 Figure 3.44 : OPC 38% series, Group 2 ( 55% RTFA and 35% SSCA) compressive strength test results. ... 47 Figure 3.45 : OPC 40% series, Group 2 ( 55% RTFA and 35% SSCA) compressive strength test results. ... 47 Figure 3.46 : OPC 43% series, Group 2 ( 55% RTFA and 35% SSCA) compressive strength test results. ... 48 Figure 3.47 : OPC 43% series, Group 2 ( 55% RTFA and 35% SSCA) compressive strength test results. ... 48 Figure 3.48 : Group 1 (55% SSCA, 35% RTFA), OPC 35% and OPC 38%, 7th day
flexural strength test results. ... 49 Figure 3.49 : Group 1 (55% SSCA, 35% RTFA), OPC 40% and OPC 43%, 7th day
flexural strength test results. ... 49 Figure 3.50 : Group 1 (55% SSCA, 35% RTFA), OPC 45% , 7th day flexural
strength test results. ... 49 Figure 3.51 : Group 1 (55% SSCA, 35% RTFA), OPC 35% and OPC 38%, 14th
day flexural strength test results. ... 50 Figure 3.52 : Group 1 (55% SSCA, 35% RTFA), OPC 40% and OPC 43%, 14th
day flexural strength test results. ... 50 Figure 3.53 : Group 1 (55% SSCA, 35% RTFA), OPC 45%, 14th day flexural
strength test results. ... 50 Figure 3.54 : Group 1 55% SSCA, 35% RTFA), OPC 35% and OPC 38%, 28th day
flexural strength test results. ... 51 Figure 3.55 : Group 1 (55% SSCA, 35% RTFA), OPC 40% and OPC 43%, 28th
day flexural strength test results. ... 51 Figure 3.56 : Group 1 (55% SSCA, 35% RTFA), OPC 45%, 28th day flexural
strength test results. ... 51 Figure 3.57 : Change in compressive strength of Group 1 ( 55% SSCA), 2% RR
according to cement ratios. ... 53 Figure 3.58 : Change in compressive strength of Group 1 ( 55% SSCA), 3% RR
according to cement ratios. ... 53 Figure 3.59 : Change in compressive strength of Group 1 ( 55% SSCA), 3% RR
according to cement ratios. ... 53 Figure 3.60 : Change in compressive strength of Group 1 ( 55% SSCA), 3% RR
according to cement ratios. ... 54 Figure 3.61 : Change in compressive strength of Group 2 (55% RTFA), 2% RR
according to cement ratios. ... 55 Figure 3.62 : Change in compressive strength of Group 2 (55% RTFA), 3% RR
according to cement ratios. ... 55 Figure 3.63 : Change in compressive strength of Group 2 (55% RTFA), 4% RR
xx
Figure 3.64 : Change in compressive strength of Group 2 (55% RTFA), 5% RR according to cement ratios. ... 56 Figure 3.65 : Group 1 ( 55% SSCA), OPC 35% comparison of flexural and
compressive strength results. ... 57 Figure 3.66 : Group 1 ( 55% SSCA), OPC 38% comparison of flexural and
compressive strength results. ... 57 Figure 3.67 : Group 1 ( 55% SSCA), OPC 40% comparison of flexural and
compressive strength results. ... 58 Figure 3.68 : Group 1 (55% SSCA), OPC 43% comparison of flexural and
compressive strength results. ... 58 Figure 3.69 : Group 1 ( 55% SSCA), OPC 45% comparison of flexural and
compressive strength results. ... 58 Figure 3.70 : Group 2 ( 55% RTFA), OPC 35% comparison of flexural and
compressive strength results. ... 60 Figure 3.71 : Group 2 ( 55% RTFA), OPC 38% comparison of flexural and
compressive strength results. ... 60 Figure 3.72 : Group 2 ( 55% RTFA), OPC 40% comparison of flexural and
compressive strength results. ... 60 Figure 3.73 : Group 2 (55% RTFA), OPC 43% comparison of flexural and
compressive strength results. ... 61 Figure 3.74 : Group 2 ( 55% RTFA), OPC 45% comparison of flexural and
compressive strength results. ... 61 Figure 3.75 : Change between dry unit weight and recycled rubber ratio in Group 1
(55% SSCA) , OPC 35%. ... 63 Figure 3.76 : Change between dry unit weight and recycled rubber ratio in Group 1
(55% SSCA) , OPC 38%. ... 63 Figure 3.77 : Change between dry unit weight and recycled rubber ratio in Group 1
(55% SSCA) , OPC 40%. ... 63 Figure 3.78 : Change between dry unit weight and recycled rubber ratio in Group 1
(55% SSCA) , OPC 43%. ... 64 Figure 3.79 : Change between dry unit weight and recycled rubber ratio in Group 1
(55% SSCA) , OPC 45%. ... 64 Figure 3.80 : Change between dry unit weight and recycled rubber ratio in Group 2
(55% RTFA) , OPC 35%. ... 66 Figure 3.81 : Change between dry unit weight and recycled rubber ratio in Group 2
(55% RTFA) , OPC 38%. ... 66 Figure 3.82 : Change between dry unit weight and recycled rubber ratio in Group 2
(55% RTFA) , OPC 40%. ... 66 Figure 3.83 : Change between dry unit weight and recycled rubber ratio in Group 2
(55% RTFA) , OPC 43%. ... 67 Figure 3.84 : Change between dry unit weight and recycled rubber ratio in Group 2
xxi
INVESTIGATION OF CONCRETE BARRIERS WITH RECYCLED RUBBER, BLAST FURNACE SLAGS AND METAKAOLIN
SUMMARY
The purpose of aggregating rubber is to increase concrete’s flexibility, elasticity, and capacity to absorb energy. In some application of concrete, it is desired that concrete should have low unit weight, high toughness and impact resistance. Although concrete is the most commonly used construction material, it does not always fulfill these requirements. In order to improve elastic properties of concrete and recycle the waste materials, new applications have been realized recently. One of these applications is the utilization of discarded tires in order to use together with aggregate. For this purpose, this research will conduct investigating the physical and mechanical properties of the concrete which is obtained from incorporating pieces of discarded tires. It is thought that rubberized concrete would be an ideal material for Jersey barriers which are subjected to immediate effects of impact. Rubberized concrete could prevent life casualties and damaging the vehicles by absorbing the impact energy. In the study, metakaolin from granulated waste roof tile, furnace slag and synthetic textile fibers were studied to replace partially the cement which is valuable material in concrete satisfying TS EN 1317 concrete specifications. In this study 40 different mixtures where prepared. Flexural and compressive strength of each mixture for period of 7, 14 and 28 days was determined. Flexural and compressive strength values for each mixture were compared with control specimen strength
xxiii
GERİ DÖNÜŞTÜRÜLMÜŞ KAUÇUKLU, YÜKSEK FIRIN CÜRUFLU VE KİREMİT TOZLU BETON BARİYERLERİN İNCELENMESİ
ÖZET
Kauçuk agreganın amacı betonun esneklik, elastikiyet ve kapasitesini artırmaktır. Betonun bazı uygulamalarında, düşük birim ağırlığı, yüksek dayanıklılık ve darbe direncine sahip olması arzu edilir. Betonun en yaygın olarak kullanılan yapı malzemesi olmasına rağmen, her zaman bu şartları yerine getirmez. Betonun elastik özelliklerini geliştirmek ve atık maddeleri geri dönüştürmek için, son zamanlarda yeni uygulamalar gerçekleştirilmektedir. Bu uygulamalardan biri agrega ile birlikte atık lastik kullanılmasıdır. Bu amaç için bu kapsamda, atılmış lastik parçaları ile elde edilen betonun fiziksel ve mekanik özelliklerini araştıran bir araştırma yürütülmüştür. Kauçuğun beton içinde, ani darbe etkilerine maruz kalan Jersey tipi bariyerler için ideal bir malzeme olacağı düşünülmüştür. Kauçuklu betonun yaşam kayıplarını önlemede ve araçlara zarar veren darbe enerjisini absorbe etmede fayda sağlayabilir. Ancak çalışmanın asıl amacı kauçuk ile birlikte ve değerli bir malzeme olan çimentoyu azaltıp onun yerine geçecek ve TS EN 1317 beton standartlarını sağlayacak şekilde metakaolen yerine öğütülmüş atık kiremit tozu, fırın curufu ve atık sentetik tekstil lifleri kullanarak beton elde etmektir.Bu çalışmada toplam 40 değişik karışım yapılmıştır. Her bir karışımın 7,14 ve 28 günlük eğilme ve basınç dayanım değerleri bulunmuştur. Bu değerler, kontrol numunesi dayanım değerleri ile karşılaştırılmıştır.
1 1. INTRODUCTION
Increasing number of vehicles in traffic cause an increase in accidents. Amount of accidents could be decreased by taking some measures but stop the occurrence. An important portion of those accidents happens by changing lane due to driver’s oblivion. One of the measures that prevent the catastrophic event for this kind of accidents is side barriers. In spite of the advantage of using barriers, there is a significant additional cost for construction. Prior expectation of the barriers is to push the vehicle in the nearest lane as soon as it hits the barrier. Furthermore, it prevents the vehicle jump to reverse lane. It is expected that the barriers are stable and immobilized as accidents occur. The aim of this scientific research is to improve these properties of the barriers. However most of the previous studies have dealt with effect of changing barrier geometry rather than its compound.
Barrier type: Generally, there are used 4 types of barriers (Yeginobali, Atahan et al.). Guardrail: It consists of steel bay, ray and connective elements. Bays are fixed over road base (Figure 1.1).
Concrete Barrier: There are in form of prefabricate or cast in-situ. They are concrete members shaped according to special geometries. They can be temporary or permanently. Currently used types of concrete barrier are as listed below:
• GM, New Jersey, an F-type and the like, • Single inclined types,
• Plain wall or hollow spaces.
Wire Rope Barrier: It consists of steel wire ropes mounted on weak posts. Bays are fixed over road base. (Figure 1.3).
Other types of barriers: There is the least used type of barriers and are made of wood, soil, stone or other materials (Yeginobali, Atahan et al.).
2
Figure 1.1 : Guardrail (URL 1).
3
Figure 1.3 : Wire Rope Barrier (Yeginobali, Atahan et al.).
4 1.1 Purpose of Thesis
Aim of rubber usage as an aggregate to absorb energy and increase elasticity of concrete. At some applications, concrete is preferred to have low unit weight, high strength and impact resistance. Even that kind of concrete is commonly used, structural materials doesn’t always fulfill these conditions. Nowadays, new applications are being carried out in order to increase the elastic characteristics of concrete and to reuse waste materials. Recycled rubber is used, in one of these applications together with aggregates. The study that an investigation physical and mechanical property of concrete that was obtained from recycled rubber pieces was carried out. It is thought that rubber inside the concrete subjected to sudden impact load is an ideal material for Jersey type barrier. Recycled rubber concrete prevents vehicle damage due to impact loads. In this study, roof tile, steel slag and textile waste fiber waste material are used to substitute cement. Aim of this study is to design a lighter concrete for barriers using recyclable materials. In this way, characteristics of concrete are improved, loss of lives and damages to vehicles are reduced and also cost of barrier is reduced.
1.2 Literature Review
A Jersey (concrete) barrier or Jersey wall is a modular concrete or plastic barrier employed to separate lanes of traffic. It is designed to minimize vehicle damage in cases of incidental contact while still preventing the crossover case of a head-on collision. They can be cast in place or precast concrete barriers. They are designed as partially or fully reinforced steel. Prefabrication, in order to reduce the surface roughness in recent years, but using modern methods such as casting in-place slip form paver, have become more common. Prefabricated barrier in the road are placed temporarily or permanently to the desired location. The most commonly used it formed in type to be effective against the facing surface impact traffic. The systematic use of concrete barriers on roads developing the surface of the formed barrier since 1950 the year began in our country, including the United States and other it has influenced practices in the country. (Yeginobali, Atahan et al.).
Concrete barriers protect the vehicles which get out of the road the road by directing the vehicle to the nearest lane and minimizing the possibility of serious injuries. On
5
the other hand, these concrete obstacles on the highway and the tips of the entry barriers must be protected in an effective manner. Unrepaired concrete barriers may be reason of dangerous environment on the roadsides (Rys and Russell, 1999).
Concrete barrier impacts are the third most common fixed-object impact, after trees and embankments (Sicking et al., 1994). In order to determine suitable warrants for installing these barriers, it is critical to ascertain the distribution of real-world impact conditions (Mak and Sicking, 2003). Detailed barriers of actual crashes provide the best quantitative and qualitative information on the distribution of real-world vehicle trajectories (Solomon and Boyd, 1986).
Slag is a waste material from the production of steel and iron and has high content of CaO. It has been used for many years in civil engineering field. Aplication of blast furnace slag with high puzolanic activity and CaO content (40-50%) into concrete provided acceptable results. Generally there isn’t any standard for usage of steel slag but for blast furnace slag -ASTM C33 standard- (Qasrawi, Shalabi et al. 2009). Maslehudet. al. studied concrete comprised of using steel slag as aggregate and crushed limestone. In the study steel slag was used as coarse aggregate. It was seen that concrete comprised of steel slag had better strength than concrete comprised of crushed limestone. It was observed that when steel slag aggregate is used, flexural strength increases (Qasraw of Shalabi et al., 2009).
V. Subathra Devia and B. K. Gnanavel , obtained different mixtures by using steel slag as coarse and fine aggregate,. Optimum mixing ratio was obtained in this study. By carrying out slump test, workability was observed. Simultaneously, compressive strength, tensile strength, flexural strength and durability tests were carried out. In the end its resistance to HCl and H2SO4 was investigated and observe that there was
a minor mass loss. (Devi, V. S., & Gnanavel, B. K. (2014).)
There are two main reasons to use of roof tile powder in self-compacting concrete.. First, roof tile powder is a waste material widely available in the world. Usage of it in concrete will have positive effect to environment. Second, roof tile is a puzolanic material and has high content of silica. Since it is a puzolanic material it can be used as bonding or filling material in concrete (Herbudiman and Saptaji 2013).
In the literature, some studies about behavior of the recycled rubber in concrete and asphalt can be found. Shu and Huang (2014) conducted a review study about it. They
6
stated that using recycled rubber has positive effect in asphalt but in concrete. In another word, using recycled rubber decreases compressive strength in concrete. However, this study doesn’t take into account concrete barrier behavior. In another study, Atahan and Sevim (2008) conducted a study about concrete barrier consist of shredded used tire rubber. At present study the main purpose is not decresing cement amount by using recycled and used materials.
Guoqiang Li et al (2004) studied usage of recycled rubber in concrete. In this study two types of recycle rubber were used. The first type was in shred form and the other in fibroid form. Variable contents of recycled rubber were used and compressive, splitting tensile strength test were carried out (Li, Guoqiang. et al 2004). In another study, Bignozzi et al (2006) used recycled rubber in different ratios in self-compacting concrete. They investigated mechanical and micro behavior of concrete prepared. Obtained compressive strength results were compared with values in literature (Bignozzi, M. C., & Sandrolini, F. 2006).
Ganjian et al (2009) in their study used two different types of recycled rubber. In the first mixture type, recycled rubber was used as aggregate. In the second mixture type recycled rubber was used in powder form. In some mixtures instead of recycled rubber powder, cement was used. Mechanical tests results were compared with mixtures that contained recycled rubber powder. Also, passing of water to specimens were observed (Ganjian, et al. 2009).
The reason of using recycled rubber aggregate is to increase elasticity, flexibility and capacity of the concrete for energy absorption. In some application of concrete, it is desired to have low unit weight, high strength and enough impact resistance. Although concrete is commonly used as structural material, it does not always have those conditions. Recently, it has been improved in some applications in order to increase elastic properties of concrete. It is believed that rubber in concrete will be ideal material for Jersey kind barriers which expose to sudden impacts. That kind of barriers may prevent catastrophic and hazardous events such as injuries, death, and damage of the vehicles.
For this reason, the present study was conducted about physical and mechanical properties of concrete that has waste tire rubber in.
7
In the literature, numerous studies about barriers have been done. However, most of them are about how barriers reduce the hazard of accidents, mechanical and geometrical design. In this study, the cost of barriers was studied. Reduction of cost by using recycled materials and increase of energy absorption by using recycled rubber.
9 2. EXPERIMENTAL STUDY
In this study, were observed characteristics of concrete specimens prepared by mixing cement with recyclable material steel slag, roof tile, recycled rubber and textile waste.
2.1 Methodology
The steps given below were followed:
Roof tile was used as fine aggregate in prepared mixtures. Steel slag was used as coarse aggregate.
Dry and saturated unit weight of each mixture was determined. After unmolding, specimens were cured in the water.
For each mixture void ratio was observed after 21 days of curing.
For each mixture, flexural and compressive strength tests were conducted for a period of 7, 14 and 28 days.
For each used cement ratio, control specimens were prepared and compared with other mixtures.
2.2 Materials
The materials used for test specimens consists of cement, water, textile waste fiber, coarse aggregate (steel slag), fine aggregate (roof tile) and 2 mm size of rubber particles. A standard sieve stack ranging from 0.15 mm to 1 mm was used for fine aggregate, while the sieve sizes for coarse aggregate varies from 1 mm to 4 mm. 2.2.1 Cement
The cement used was TS EN 197-1 - CEM I 42.5 R ordinary Portland cement (OPC) .type complying with TS EN 197-1:2012 from Cimentas Mark having a 28-day compressive strength of 42.5 MPa. In Table 2.1 are given results of analysis done by Cimentas and specifications limits. Cimentas is a well-known factory in Izmir for concrete production.
10
Table 2. 1: Mechanical and physical properties of cement used
Strength class
Early Compressive
strength (MPa) Standard Compressive strength (MPa) 28 days Initial setting time (min) Specific surface (cm2/g) Specific gravity (0.90) 2 days 7 days 42.5 R ≥20 - ≥42.5 ≤62.5 ≥ 60 3395 3.11
Cement content used as binder is reduced. Since cement is added to concrete as volume not as mass. Cement with high specific gravity with have low volume and it is not appropriate for concrete. Specific gravity of cement is important. CEM I 42.5 R OPC was used. Specific gravity by Le Chatelier baloon test was found out as 3.11 gr/cm3 (Figure 2.1).
Figure 2.1: A specific gravity test with Le Chatelier's balloon.
2.2.2 Steel slag as course aggregate
Steel slag course aggregate (SSCA) is a byproduct from either the transubstantiate of iron to steel in a basic oxygen furnace, or the melting of scrap to make steel in an electric arc furnace. Usage and recycling of SSCA from steel manufacturing industry is an important issue. Steel slag is a by-product widely found in steel industry Aliağa, Izmir. The main chemical components of steel slag are provided in Table 2.2. Steel slag has a specific gravity of 3.55 gr/cm3. In Figure 2.2 below is shown experiment
11
done with Le Chatelier balloon. XRD analysis was conducted by Material Engineering Department, Izmir Katip Celebi University.In Figure 2.3 below is shown XRD powder pattern of steel slag.
Table 2.2 : The main chemical components of SSCA.
Components
Al2O3 CaO Cr2O3 Fe2O3 K2O MgO MnO Na2O P2O5 SiO2 S TiO2
Content (%)
6.68 27.98 1.65 35.85 0.04 3.11 4.71 0.73 0.53 17.99 0.140 0.59
12
Figure 2.3 : XRD powder pattern of steel slag.
2.2.3 Roof tile fine aggregate
Roof tile fine aggregate (RTFA) is a waste product obtained from different brick kilns and tile factories. There are numerous brick kiln which have grown over the decades in an unplanned way in different part of the country. Tons of waste products like roof tile powder or broken pieces or flakes of bricks (brickbat) come out from these kilns and factories. So far, such materials have been used just for filling low lying areas or are dumped as waste material. Roof tile powder used in this study is obtained from Turgutlu, Izmir where fabric of tiles are widely found. In this study, roof tile powder was obtained from TUKSAD as a by-product. In Figure 2.4 below is shown XRD powder pattern of roof tile. Specific gravity of RTFA was 2.66 gr/cm3. . In Figure 2.5 below is shown experiment done with Le Chatelier balloon.
0 5 10 15 20 25 30 50 0.173 76 9.108 10 3.804 13 0.698 15 7.591 18 4.485 21 1.378 23 8.272 26 5.165 29 2.058 31 8.952 34 5.845 37 2.739 39 9.632 42 6.526 45 3.419 48 0.313 50 7.206 53 .41 56 0.993 58 7.887 61.478 64 1.673 66 8.567 69.546 72 2.354 74 9.247 77 6.141 Co un ts
13
Figure 2.4 : XRD powder pattern of roof tile.
Figure 2.5 : A specific gravity test for roof tile with Le Chatelier's balloon.
0 100 200 300 400 500 600 700 800 50 0.173 76 9.1 08 10 3.804 13 0.698 15 7.591 18 4.485 21 1.3 78 23 8.272 26 5.165 29 2.058 31 8.952 34 5.845 37 2.739 39 9.632 42 6.526 45 3.419 48 0.313 50 7.206 53 .41 56 0.993 58 7.887 61.478 64 1.673 66 8.567 69.546 72 2.354 74 9.247 77 6.141 Co u n ts
14 2.2.4 Recycled rubber
One of the most important characteristic of concrete barriers is energy absorption. In this study, in order to enhance characteristics of concrete barriers recycled rubber was used. New concrete with light unit weight than normal concrete and same strength was obtained by using recycled rubber. In this study, recycled rubber with ratio of 2, 3, 4 and 5% was used. Recycled rubber effect was investigated for each mixture. . It was obtained from recycled rubber (RR) tires. The unit weight of this recycled rubber is 600 kg/m3. Recycled rubber consists of particles same in size as 2 mm. In Figure 2.6 below shows the RR used in the mixtures.
Figure 2.6 : Recycled rubber.
2.2.5 Textile waste fiber
Generally, in concrete elastic characteristics are linearly related with flexural strength. Based on this, to increase flexural strength of concrete barriers textile waste fiber was used. Textile waste fiber at ratio of 0.5% was used for each mixture. For each mixture 0.5% Clothing fabric generally consists of composites of cotton (biodegradable material) and synthetic plastics. In this study, synthetic textile waste was used to increase flexural strength of concrete. In our country, textile waste fabrics are found in Usak. Usage of this material will have contribution both in environmental and industrial area. In Figure 2.7 below textile waste fiber used in the mixtures is shown.
15
Figure 2.7 : Textile waste fiber.
2.3 Mix Design
Mixtures prepared for study are divided into two main groups. In the first group, mixtures were prepared using 55% of SSCA. The second group of mixtures was prepared using 55% of RTFA. For each group, cement ratios in total mass was initiated as 35, 38, 40, 43 and 45%. Recycled rubber at ratios of 2, 3, 4 and 5% was added to mixtures keeping cement ratios constant in above mentioned percentages. In total, 40 specimens were prepared meaning 20 mixtures for each group. 10 control specimens were prepared for each group of mixture. In each mixture, textile waste ratio was keep constant as 0.5. Steel slag ratio for each mixture was taken as 10%. In control specimen recycled rubber was not used. Recycled rubber effect was investigated. Ratio of recycled rubber was shared according to ratio of SSCA and RTFA. Below are given w/s ratio of mixtures. In Table 2.3 below are shown mixing ratio of Group 1 (55% SSCA) and Table 2.4 Group 2 (55% RTFA).
16
Table 2. 3: Mixing ratio of Group 1 (55% SSCA).
Series Cement (% by weight) Roof Tile Fine Aggregate (RTFA) (% by weight) Steel Slag Course Aggregate (SSCA) (% by weight) Steel Slag Powder (% by weight) Recyled Rubber (% by weight) Textile waste fibers (% by weight)) w/s AK-1 35 21,9 34,4 6,3 2 0,50 0,210 AK-2 35 21,5 33,8 6,2 3 0,50 0,212 AK-3 35 21,2 33,3 6,1 4 0,50 0,212 AK-4 35 20,8 32,7 6,0 5 0,50 0,195 AK-5 38 20,8 32,7 6,0 2 0,50 0,192 AK-6 38 20,5 32,2 5,9 3 0,50 0,192 AK-7 38 20,1 31,6 5,8 4 0,50 0,197 AK-8 38 19,8 31,1 5,7 5 0,50 0,197 AK-9 40 20,1 31,6 5,8 2 0,50 0,192 AK-10 40 19,8 31,1 5,7 3 0,50 0,192 AK-11 40 19,4 30,5 5,6 4 0,50 0,192 AK-12 40 19,1 30,0 5,5 5 0,50 0,193 AK-13 43 19,1 30,0 5,5 2 0,50 0,196 AK-14 43 18,7 29,4 5,4 3 0,50 0,198 AK-15 43 18,4 28,9 5,3 4 0,50 0,189 AK-16 43 18,0 28,3 5,2 5 0,50 0,189 AK-17 45 18,4 28,9 5,3 2 0,50 0,189 AK-18 45 18,0 28,3 5,2 3 0,50 0,195 AK-19 45 17,7 27,8 5,1 4 0,50 0,195 AK-20 45 17,3 27,2 5,0 5 0,50 0,189
17
Table 2. 4: Mixing ratio of Group 1 (55% RTFA)
Series Cement (% by weight) Roof Tile Fine Aggregate (RTFA) (% by weight) Steel Slag Course Aggregate (SSCA) (% by weight) Steel Slag Powder (% by weight) Recyled Rubber (% by weight) Textile waste fibers (%by weight)) w/s AK-21 35 34,4 21,9 6,3 2 0,5 0,210 AK-22 35 33,8 21,5 6,2 3 0,5 0,231 AK-23 35 33,3 21,2 6,1 4 0,5 0,226 AK-24 35 32,7 20,8 6,0 5 0,5 0,212 AK-25 38 32,7 20,8 6,0 2 0,5 0,212 AK-26 38 32,2 20,5 5,9 3 0,5 0,226 AK-27 38 31,6 20,1 5,8 4 0,5 0,212 AK-28 38 31,1 19,8 5,7 5 0,5 0,202 AK-29 40 31,6 20,1 5,8 2 0,5 0,203 AK-30 40 31,1 19,8 5,7 3 0,5 0,198 AK-31 40 30,5 19,4 5,6 4 0,5 0,208 AK-32 40 30,0 19,1 5,5 5 0,5 0,212 AK-33 43 30,0 19,1 5,5 2 0,5 0,212 AK-34 43 29,4 18,7 5,4 3 0,5 0,208 AK-35 43 28,9 18,4 5,3 4 0,5 0,209 AK-36 43 28,3 18,0 5,2 5 0,5 0,212 AK-37 45 28,9 18,4 5,3 2 0,5 0,189 AK-38 45 28,3 18,0 5,2 3 0,5 0,212 AK-39 45 27,8 17,7 5,1 4 0,5 0,212 AK-40 45 27,2 17,3 5,0 5 0,5 0,189
18
Table 2. 5: Components of control specimens (CS), Group 1(55% SSCA.
Table 2. 6: Components of control specimens (CS), Group 2 (55% RTFA).
Series Cement (% by weight) Roof Tile Fine Aggregate (RTFA) (% by weight) Steel Slag Course Aggregate SSCA) (% by weight) Steel Slag Powder (% by weight) Recyled Rubber (% by weight) Textile waste fibers (% by weight)) Dry Unit Weight (kN/ m3) CS-1 35 22.6 35.5 6.5 0 0.50 22.60 CS-2 38 21.5 33.8 6.2 0 0.50 22.30 CS-3 40 20.8 32.7 6.0 0 0.50 22.90 CS-4 43 19.8 31.1 5.7 0 0.50 22.80 CS-5 45 19.1 30.0 5.5 0 0.50 21.60 Series Cement (% by weight) Roof Tile Fine Aggregate (RTFA) (% by weight) Steel Slag Course Aggregate SSCA) (% by weight) Steel Slag Powder (% by weight) Recyled Rubber (% by weight) Textile waste fibers (% by weight)) Dry Unit Weight (kN/ m3) CS-6 35 35.5 22.6 6.5 0 0.50 21.20 CS-7 38 33.8 21.5 6.2 0 0.50 21.60 CS-8 40 32.7 20.8 6.0 0 0.50 21.50 CS-9 43 31.1 19.8 5.7 0 0.50 21.80 CS-10 45 30.0 19.1 5.5 0 0.50 21.40
19 2.4 Test Method
Compressive and flexural strength of mixtures was determined according to TS EN 196-1. The mortar is placed in three steel molds that have 40 mm width. 40 mm height and 160 mm length and cured in the standard curing room with temperature 20 ± 2°C and 95% humidity until the testing time. In order to conduct the flexural test, each mortar bar was placed on two supports 10 cm apart from each other and a load P is applied until the bar breaks more or less at the middle. The average of the flexural strength values found on three bars was expressed as the flexural strength of cement mortar. The flexural strength shows the tensile resistance of the bar specimen to bending. The compressive strength test is conducted on the broken halves of the mortar bars. Since three specimens were broken in flexure, six specimens of 40 mm x 40 mm approximately 80 mm were available for this purpose. When a compressive force was applied, the mortar specimen behaved as if it were a 40 mm cube. The average of the results found by six specimens was the compressive strength of the mortar bars.
At the same time each of specimens were waited under water for 21 days. Pores of each of specimens were observed.
2.4.1 Flexural strength test
The test was conducted according to TSE EN 196-1. Specimens were taken out from curing tank at the age of 7, 14 and 28 tested immediately after removal from water. After 28 days is removed form water and it is dried in oven at 70oC. In order to conduct the flexural test, each mortar bar was placed on two supports 10 cm apart from each other, and a load P was applied until the bar was broken more or less at the middle. The average of the flexural strength values found on three bars was expressed as the flexural strength of cement mortar. The flexural strength shows the tensile resistance of the bar specimen to bending. The compressive strength test was conducted on the broken halves of the mortar bars. In the Figure 2.8 below flexural test scheme is presented. Figure 2.9 it is shown a specimen on which flexural strength test was carried on. Specimen didn’t fail during testing but specimen of normal concrete failed.
20
Figure 2.9 : Flexural strength test. 2.4.2 Compressive strength test
The test was conducted according to TSE EN 196-1.Specimens were taken out from curing tank at the age of 7,14 and 28 tested immediately after removal from water. After 28 days is removed form water and it is dried in oven at 70oC. The position of cube while testing was at right angles to that of casting position. The load was gradually applied without any shock and increased at constant rate of 0, 5 kN/sn until failure of specimen took place. It was tested on compression testing machine. In Figure 2.10 compressive strength test is shown.
21
Figure 2.10 : Compressive strenght test.
Figure 2.11 : Compressive strenght test.
23 3. TEST RESULTS AND DISCUSSION
3.1 Flexural Strength Test Results
3.1.1 Flexural Strength Test Results of Group 1 (55% SSCA)
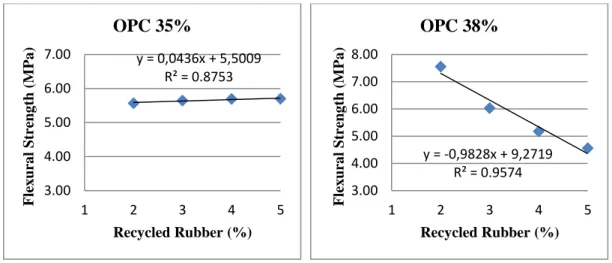
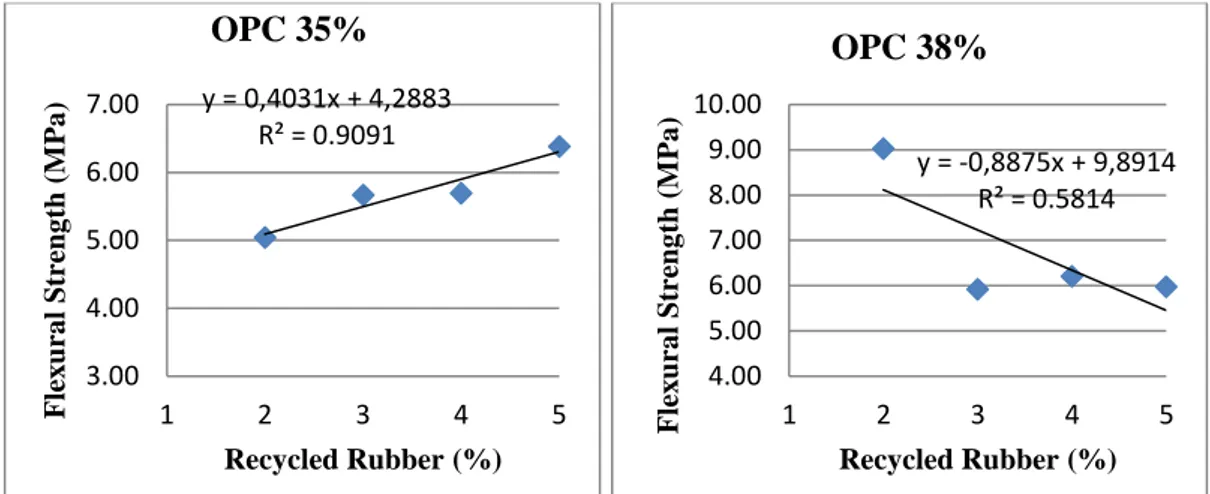
In Table 3.1, below are given flexural strength results of Group 1 (55% SSCA) specimens consisting of 55% SSCA and control specimens for 7, 14 and 28 days. OPC group with 35% (“OPC 35” here refers to the mixture containing 35% OPC, and this display will be used on next sections) have showed that when recycled rubber content is increased flexural strength is increased. Flexural strength results of 7 and 14 days specimens were lower than that of control specimens. Specimens with 5% content have higher strength than control specimens after 28 days of curing. The highest flexural strength for 28 days was 6.383 MPa and this value was obtained by AK-4 specimen (Figure 3.1, 3.6, 3.9, 3.12).
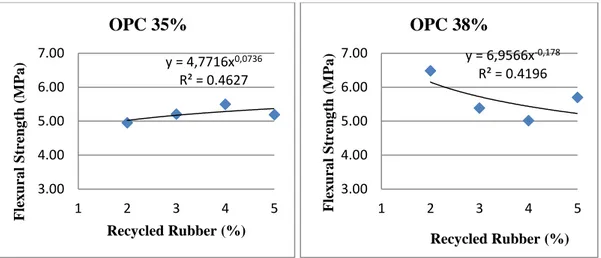
Flexural strength results of OPC 38 group compare with OPC 35 group were more irregular. It is seen that when recycled rubber content is increased flexural strength is decreased. Flexural strength result for 14 and 28 days of AK-5 (2%) specimen were greater than control specimen’s strength values. The highest flexural strength for 28 days was obtained by AK-5 (2%) and value was 9.031 MPa. Flexural strength results for 28 days of other specimens were nearly same with each other (Figure 3.2, 3.6, 3.9, 3.12).
7 days flexural strength results of OPC 40 group showed that when recycled rubber content is increased flexural strength is increased. Flexural strength results for 7 days of control specimens were the highest ones. Flexural strength results for 14 days of AK-9 and AK-10 compared with control specimens were greater. Only AK- 9 specimen after 28 days of curing had flexural strength greater than control specimen (Figure 3.3, 3.7, 3.10, 3.13).
In group OPC 43, 7 days flexural strength results of AK-14 and AK-15 specimens were lower than that of control specimens. All flexural strength results of control specimens after 14 days of curing were lower. Generally, 14 and 28 days flexural strength results showed that when recycled rubber content is increased flexural strength is decreased. Flexural strength results for 28 days of AK-13 and A-15 specimens were greater than that of control specimens (Figure 3.4, 3.7, 3.10, 3.13).
24
In OPC 45 group it is seen that when recycled rubber content is increased flexural strength is decreased. All specimens after 7 days of curing had higher flexural strength than control specimens. Only AK-17 specimen flexural strength result after 14 days of curing was greater than that of control specimen. It was seen that highest flexural strength after 28 days was obtained at control specimens (Figure 3.5, 3.8, 3.11, 3.14).
Generally, when cement ratio is increased flexural strength is expected to be increased. When flexural strength is expected to increase, recycled rubber content is increased. This situation is faced on Group 1(55% SSCA) with cement ratio 35% but is not seen in other cement ratios. The reason for this is that when cement ratio is low material is more elastic. When cement ratio is increased material become more brittle and flexural strength is decreased.
25
Table 3.1: Flexural Strength Test Results of Group 1 (55% SSCA).
Series Cement (% by weight) σf,7 σf,14 σf,28 Recyled Rubber (% by weight) Unit Weight (kN/m3) AK-1 35 4.953 5.570 5.047 2 20.60 AK-2 35 5.210 5.648 5.672 3 21.80 AK-3 35 5.500 5.695 5.695 4 21.00 AK-4 35 5.195 5.700 6.383 5 22.10 AK-5 38 6.484 7.555 9.031 2 22.00 AK-6 38 5.391 6.031 5.922 3 21.90 AK-7 38 5.016 5.180 6.211 4 21.80 AK-8 38 5.703 4.563 5.977 5 21.90 AK-9 40 4.539 7.867 6.563 2 22.00 AK-10 40 6.156 6.859 5.453 3 22.10 AK-11 40 5.805 5.453 4.688 4 22.00 AK-12 40 5.852 7.484 5.469 5 21.70 AK-13 43 5.539 7.234 6.281 2 21.70 AK-14 43 6.891 6.961 5.664 3 22.20 AK-15 43 7.109 7.578 5.898 4 21.60 AK-16 43 5.648 6.703 5.531 5 21.20 AK-17 45 6.938 8.211 6.102 2 22.10 AK-18 45 7.367 6.414 5.586 3 21.50 AK-19 45 6.352 7.500 5.843 4 21.30 AK-20 45 6.977 7.289 5.555 5 270
26
Figure 3.2 : OPC 38% series, Group 1 ( 55% SSCA and 35% RTFA) flexural strength test results.
Figure 3.3 : OPC 40% series, Group 1 ( 55% SSCA and 35% RTFA) flexural strength test results.
0.00 2.00 4.00 6.00 8.00 10.00 7 14 28 Fl exu ral S tr en gth (MP a) Curing Days CN-2 AK-5 (2% RR) AK-6 (3% RR) AK-7 (4% RR) AK-8 (5% RR) 0.00 2.00 4.00 6.00 8.00 10.00 7 14 28 Fl exu ral S tr en gth (MP a) Curing Days CS-3 AK-9 (2% RR) AK-10 (3% RR) AK-11 (4% RR) AK-12 (5% RR) 0.00 2.00 4.00 6.00 8.00 7 14 28 Fl e xu ral S tr e n gth (M Pa) Curing Days CN-1 AK-1 (2% RR) AK-2 (3% RR) AK-3 (4% RR) AK-4 (5% RR)
Figure 3.1 : OPC 35% series, Group 1 ( 55% SSCA and 35% RTFA) flexural strength test results.
27
Figure 3.4 : OPC 43% series, Group 1 ( 55% SSCA and 35% RTFA) flexural strength test results.
Figure 3.5 : OPC 45% series, Group 1 ( 55% SSCA and 35% RTFA) flexural strength test results.
0.00 2.00 4.00 6.00 8.00 7 14 28 Fl e xu ral S tr e n gth (MP a) Curing Days CS-4 AK-13 (2% RR) AK-14 (3% RR) AK-15 (4% RR) AK-16 (5% RR) 0.00 2.00 4.00 6.00 8.00 10.00 7 14 28 Fl e xu ral S tr e n gth (MP a) Curing Days CS-5 AK-17 (2% RR) AK-18 (3% RR) AK-19 (4% RR) AK-20 (5% RR)
28
Figure 3.6 : Group 1 (55% SSCA), OPC 35% and OPC 38% , 7th day flexural strength test results.
Figure 3.7 : Group 1 (55% SSCA), OPC 40% and OPC 43% , 7th day flexural strength test results.
Figure 3.8 : Group 1 (55% SSCA), OPC 43% , 7th day flexural strength test results. y = 4,7716x0,0736 R² = 0.4627 3.00 4.00 5.00 6.00 7.00 1 2 3 4 5 F lex ura l Str eng th (MP a) Recycled Rubber (%) OPC 35% y = 6,9566x-0,178 R² = 0.4196 3.00 4.00 5.00 6.00 7.00 1 2 3 4 5 F lex ura l Str eng th (MP a) Recycled Rubber (%) OPC 38% y = 0,3586x + 4,3328 R² = 0.4176 3.00 4.00 5.00 6.00 7.00 1 2 3 4 5 F lex ura l Str eng th (MP a) Recycled Rubber (%) OPC 40% y = 0,4468ln(x) + 5,7621 R² = 0.0467 4.00 5.00 6.00 7.00 8.00 1 2 3 4 5 F lex ura l Str eng th (MP a) Recycled Rubber (%) OPC 43% y = -0,0898x + 7,2227 R² = 0.0767 4.000 5.000 6.000 7.000 8.000 1 2 3 4 5 F lex ura l Str eng th (MP a) Recycled Rubber (%) OPC 43%
29
Figure 3.9 : Group 1 (55% SSCA), OPC 35% and OPC 38% , 14th day flexural strength test results.
Figure 3.10 : Group 1 (55% SSCA), OPC 40% and OPC 43% , 14th day flexural strength test results.
Figure 3.11 : Group 1 (55% SSCA), OPC 45% , 14th day flexural strength test results. y = 0,0436x + 5,5009 R² = 0.8753 3.00 4.00 5.00 6.00 7.00 1 2 3 4 5 F lex ura l Str eng th (MP a) Recycled Rubber (%) OPC 35% y = -0,9828x + 9,2719 R² = 0.9574 3.00 4.00 5.00 6.00 7.00 8.00 1 2 3 4 5 F lex ura l Str eng th (MP a) Recycled Rubber (%) OPC 38% y = 8,3265x-0,163 R² = 0.1579 4.00 5.00 6.00 7.00 8.00 9.00 1 2 3 4 5 F lex ura l Str eng th (MP a) Recycled Rubber (%) OPC 40% y = -0,0977x + 7,4609 R² = 0.113 4.00 5.00 6.00 7.00 8.00 1 2 3 4 5 F lex ura l Str eng th (MP a) Recycled Rubber (%) OPC 43% y = -0,721ln(x) + 8,2163 R² = 0.1485 4.00 5.00 6.00 7.00 8.00 9.00 1 2 3 4 5 F lex ura l Str eng th (MP a) Recycled Rubber (%) OPC 45%
30
Figure 3.12 : Group 1 (55% SSCA), OPC 35% and OPC 38% , 28th day flexural strength test results.
Figure 3.13 : Group 1 (55% SSCA), OPC 40% and OPC 43% , 28th day flexural strength test results.
Figure 3.14 : Group 1 (55% SSCA), OPC 45%, 28th day flexural strength test results. y = 0,4031x + 4,2883 R² = 0.9091 3.00 4.00 5.00 6.00 7.00 1 2 3 4 5 F lex ura l Str eng th (MP a) Recycled Rubber (%) OPC 35% y = -0,8875x + 9,8914 R² = 0.5814 4.00 5.00 6.00 7.00 8.00 9.00 10.00 1 2 3 4 5 F lex ura l Str eng th (MP a) Recycled Rubber (%) OPC 38% y = -0,4047x + 6,9594 R² = 0.4588 3.00 4.00 5.00 6.00 7.00 1 2 3 4 5 F lex ura l Str eng th (MP a) Recycled Rubber (%) OPC 40% y = -0,2016x + 6,5492 R² = 0.6263 3.00 4.00 5.00 6.00 7.00 1 2 3 4 5 F lex ura l Str eng th (MP a) Recycled Rubber (%) OPC 43% y = -0,1384x + 6,2555 R² = 0.4896 3.00 4.00 5.00 6.00 7.00 1 2 3 4 5 F lex ura l Str eng th (M P a ) Recycled Rubber (%) OPC 45%
31
3.1.2 Flexural strength result of Group 2 (55% RTFA)
In Table 3.2, below are given flexural strength results of Group 2 specimens containing 55% RTFA and control specimens for 7,14 and 28 days.
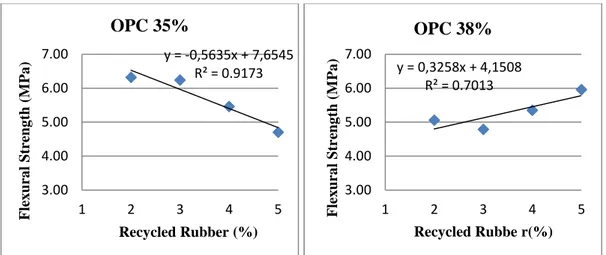
In OPC 35 group it is seen that when recycled rubber content is increased flexural strength is decreased. Based on this, flexural strength result for 7 and 14 days were greater than that of control specimens. Only AK- 24 specimen after 28 days of curing had flexural strength greater than control specimen (Figure 3.15, 3.20, 3.23, 3.26). In OPC 38 group it is seen that when recycled rubber content is increased flexural strength is increased. Flexural strength result of control specimens for 7 days was greater than flexural strength result of AK-28 specimen. AK-25 specimen had a flexural strength greater than control specimen. After 28 days, AK-25, AK- 27 and AK-28 specimen had flexural strength greater than control specimen (Figure 3.16, 3.20, 3.23, 3.26).
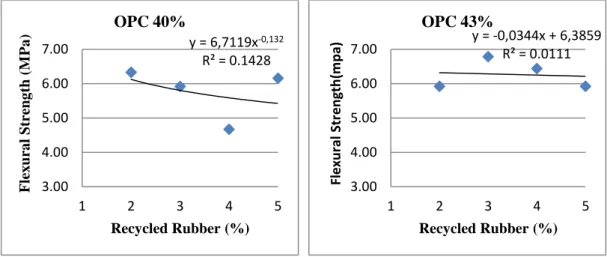
In OPC 40 group, for 7 and 14 days when recycled rubber content is increased flexural strength is decreased. For 28 days, when recycled rubber content is increased flexural strength is increased. Control specimens had the highest flexural strength according to 7 days flexural strength results. The highest flexural strength result was seen at AK-29 (2% RR) specimen according to 14 days flexural strength results. All specimens after 28 days of curing had higher flexural strength than control specimens. The highest flexural strength was seen at AK-32 (5% RR) specimen (Figure 3.17, 3.21, 3.24, 3.27).
In OPC 43 group it is seen that when recycled rubber content is increased flexural strength is decreased. All specimens after 7 days of curing had higher flexural strength than control specimens. AK-33 and AK- 34 specimens had greater flexural strength than control specimens after 14 days. After 28 days the highest flexural strength is seen at control specimens (Figure 3.18, 3.21, 3.24, 3.27).
In OPC 45 group it is seen that when recycled rubber content is increased flexural strength is decreased. All specimens after 7 days of curing had higher flexural strength than control specimens. Only AK-38 specimen had greater flexural strength than control specimens after 14 days. After 28 days the highest flexural strength is seen at control specimens (Figure 3.19, 3.22, 3.25, 3.28).
Generally when recycled rubber ratio is increased it is expected that void ratio of material and flexural strength to be increased. This situation is observed at OPC 38 and OPC 40. In this group, highest flexural strength is obtained when cement ratio is low and recycle rubber ratio is high.
32
Table 3. 2 : Flexural strength result of Group 2 (55% RTFA).
Series Cement (% by weight) σf,7 σf,14 σf,28 Recyled Rubber (% by weight) Unit Weight (kN/m3) AK-21 35 6,320 5.836 5.602 2 20.00 AK-22 35 6.245 5.039 5.547 3 20.00 AK-23 35 5.461 5.955 4.258 4 19.60 AK-24 35 4.703 5.609 6.930 5 20.70 AK-25 38 5.063 6.563 6.555 2 20.60 AK-26 38 4.789 4.688 5.484 3 20.40 AK-27 38 5.352 5.922 5.930 4 20.50 AK-28 38 5.961 4.977 6.516 5 20.30 AK-29 40 5.484 6.328 5.273 2 21.50 AK-30 40 5.195 5.914 5.766 3 20.80 AK-31 40 5.563 4.672 5.617 4 20.60 AK-32 40 5.430 6.156 6.664 5 20.50 AK-33 43 6.383 5.922 6.383 2 20.80 AK-34 43 6.391 6.781 5.703 3 20.80 AK-35 43 6.008 6.438 4.922 4 20.30 AK-36 43 6.164 5.922 5.438 5 20.20 AK-37 45 8.227 5.414 5.594 2 20.80 AK-38 45 6.925 7.641 5.186 3 20.40 AK-39 45 6.852 6.555 5.258 4 20.30 AK-40 45 5.656 6.305 4.539 5 20.80
33
Figure 3.15 : OPC 35% series, Group 2 ( 55% RTFA and 35% SSCA) flexural strength test results.
Figure 3.16 : OPC 38% series, Group 2 ( 55% RTFA and 35% SSCA) flexural strength test results.
.
Figure 3.17 : OPC 40% series, Group 2 (55% RTFA and 35% SSCA) flexural strength test results.
0.00 2.00 4.00 6.00 8.00 7 14 28 Flex u ra l S treng th (MP a) Curing Days CS-6 AK-21 (2% RR) AK-22 (3% RR) AK-23 (4% RR) AK-24 (5% RR) 0.00 1.00 2.00 3.00 4.00 5.00 6.00 7.00 7 14 28 F lex ura l Str eng th (MP a) Curing Days CS-7 AK-25 (2% RR) AK-26 (3% RR) AK-27 (4% RR) AK-28 (5% RR) 0.00 2.00 4.00 6.00 8.00 7 14 28 Fl e xu ral S tr e n gth (MP a) Curing Days CS-8 AK-29 (2% RR) AK-30 (3% RR) AK-31 (4% RR) AK-32 (5% RR)
34
Figure 3.18 : OPC 43% series, Group 2 ( 55% RTFA and 35% SSCA) flexural strength test results.
Figure 3.19 : OPC 45% series, Group 2 ( 55% RTFA and 35% SSCA) flexural strength test results.
0.00 2.00 4.00 6.00 8.00 7 14 28 F lex ura l Str eng th (MP a) Curing Days CS-9 AK-33 (2% RR) AK-34 (3% RR) AK-35 (4% RR) AK-36 (5% RR) 0.00 2.00 4.00 6.00 8.00 10.00 7 14 28 F lex ura l Str eng th (MP a) Curing Days CS-10 AK-37 (2% RR) AK-38 (3% RR) AK-39 (4% RR) AK-40 (5% RR)
35
Figure 3.20 : Group 2 (55% RTFA, 35% SSCA), OPC 35% and OPC 38% , 7th day flexural strength test results.
Figure 3.21 : Group 2 (55% RTFA, 35% SSCA), OPC 40% and OPC 43% , 7th day flexural strength test results.
Figure 3.22 : Group 2 (55% RTFA, 35% SSCA), OPC 45%, 7th day flexural strength test results. y = -0,5635x + 7,6545 R² = 0.9173 3.00 4.00 5.00 6.00 7.00 1 2 3 4 5 F lex ura l Str eng th (MP a) Recycled Rubber (%) OPC 35% y = 0,3258x + 4,1508 R² = 0.7013 3.00 4.00 5.00 6.00 7.00 1 2 3 4 5 F lex ura l Str eng th (MP a) Recycled Rubbe r(%) OPC 38% y = 0,0203x + 5,3469 R² = 0.0275 3.00 4.00 5.00 6.00 7.00 1 2 3 4 5 F lex ura l Str eng th (MP a) Recyled Rubber (%) OPC 40% y = -0,1039x + 6,6 R² = 0.5256 3.00 4.00 5.00 6.00 7.00 1 2 3 4 5 F lex ura l Str eng th ( M P a ) Recycled Rubber (%) OPC 43% y = -0,7784x + 9,6394 R² = 0.9157 4.00 5.00 6.00 7.00 8.00 9.00 1 2 3 4 5 F lex ura l Str eng th (MP a) Recycled Rubber (%) OPC 45%
36
Figure 3.23 : Group 2 (55% RTFA, 35% SSCA), OPC 35% and OPC 38% , 14th day flexural strength test results.
Figure 3.24 : Group 2 (55% RTFA, 35% SSCA), OPC 40% and OPC 43% , 14th day flexural strength test results.
Figure 3.25 : Group 2 (55% RTFA, 35% SSCA), OPC 40% and OPC 43% , 14th day flexural strength test results.
y = 0,0237x + 5,5271 R² = 0.0056 3.00 4.00 5.00 6.00 7.00 1 2 3 4 5 F lex ura l Str eng th (MP a) Recycled Rubber (%) OPC 35% y = -0,3523x + 6,7703 R² = 0.2777 3.00 4.00 5.00 6.00 7.00 1 2 3 4 5 F lex ura l Str eng th (MP a) Recycled Rubber (%) OPC 38% y = 6,7119x-0,132 R² = 0.1428 3.00 4.00 5.00 6.00 7.00 1 2 3 4 5 F lex ura l Str eng th (MP a) Recycled Rubber (%) OPC 40% y = -0,0344x + 6,3859 R² = 0.0111 3.00 4.00 5.00 6.00 7.00 1 2 3 4 5 Fl e xu ral S tr e n gth (m p a) Recycled Rubber (%) OPC 43% y = 5,4455x0,1389 R² = 0.1507 0.00 2.00 4.00 6.00 8.00 10.00 1 2 3 4 5 F lex ura l Str eng th (MP a) Recycled Rubber (%) OPC 45%
37
Figure 3.26 : Group 2 (55% RTFA, 35% SSCA), OPC 35% and OPC 38% , 28th day flexural strength test results.
Figure 3.27 : Group 2 (55% RTFA, 35% SSCA), OPC 40% and OPC 43% , 28th day flexural strength test results.
Figure 3.28 : Group 2 (55% RTFA, 35% SSCA), OPC 45%, 28th day flexural strength test results.
y = 0,2695x + 4,6406 R² = 0.1017 3.00 4.00 5.00 6.00 7.00 8.00 1 2 3 4 5 F lex ura l Str eng th (MP a) Recycled Rubber (%) OPC 35% y = 0,0328x + 6,0063 R² = 0.0069 3.00 4.00 5.00 6.00 7.00 1 2 3 4 5 F lex ura l Str eng th (MP a) Recycled Rubber (%) OPC 38% y = 0,4023x + 4,4219 R² = 0.7673 3.00 4.00 5.00 6.00 7.00 1 2 3 4 5 F lex ura l Str eng th (MP a) Recycled Rubber (%) OPC 40% y = -0,3617x + 6,8773 R² = 0.5898 3.00 4.00 5.00 6.00 7.00 1 2 3 4 5 F lex ura l Str eng th( MP a) Recycled Rubber (%) OPC 43% y = -0,3092x + 6,2264 R² = 0.8201 3.00 4.00 5.00 6.00 7.00 1 2 3 4 5 F lex ura l Str eng th (MP a) Recycled Rubber (%) OPC 45%
38 3.2 Compressive Strength Test Results
3.2.1 Compressive strength test results of Group 1 (55% SSCA)
In Table 3.3, below compressive strength results for 7, 14 and 28 days of group 1 are given.
In OPC 35 group it is seen that when recycled rubber content is increased compressive strength is increased. Compressive strength results of 7, 14 and 28 days specimens were lower than that of control specimens. The highest compressive strength is obtained at AK-4 specimen. 28 days compressive strength results was of type, R² = 0.7953 (Figure 3.29, 3.34, 3.37, 3.40).
In OPC 38 group it is seen that when recycled rubber content is increased compressive strength is increased. Compressive strength results of 14 and 28 days specimens were lower than that of control specimens. The highest compressive strength is obtained at AK-5 specimen. It was seen that compressive strength results of specimens for 28 days were nearly same with compressive strength results of control specimens. 28 days compressive strength results was of type, R² = 0.9786 (Figure 3.30, 3.34, 3.37, 3.40).
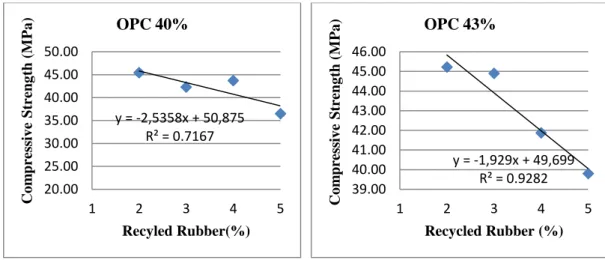
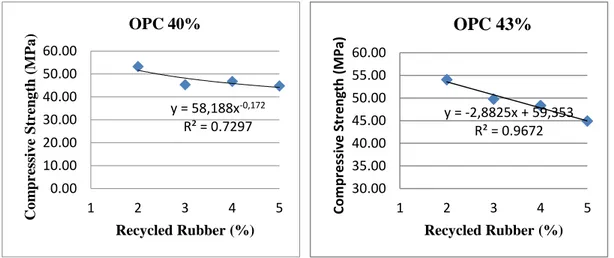
In OPC 40 group it is seen that when recycled rubber content is increased compressive strength is decreased. Compressive strength results of 7, 14 and 28 days specimens were lower than that of control specimens. For 28 days when compressive strength of control specimens was 65.548 MPa, specimen AK-9 with the highest compressive strength had compressive strength of 53.219. 28 days compressive strength results was of type, R² = 0.7297 (Figure 3.31, 3.35, 3.38, 3.41).
Results obtained for OPC 43 had the most linear relationship. Also, in this group when recycled rubber content is increased compressive strength is increased. For 28 days compressive strength of control specimens was 64.107 MPa. Specimen AK -13 with the highest compressive strength had compressive strength of 54.055. 28 days compressive strength results was of type, R² = 0.9672 (Figure 3.32, 3.35, 3.38, 3.41). In OPC 45 group it is seen that when recycled rubber content is increased compressive strength is decreased. . For 28 days when compressive strength of control specimens was 64.505 MPa. Specimen AK -17 with the highest compressive strength had compressive strength of 59.249 .28 days compressive strength results was of type, R² = 0.9383 (Figure 3.33, 3.36, 3.39, 3.42).
Generally, it is expected that compressive strength to be increased when cement ratio is increased. When recycled rubber ratio is increased, void ratio of material is increased and compressive strength is reduced. The best result is observed when OPC ratio is high and recycled rubber ratio is low. At the same time, at control specimens compressive strength was high since void ratio was low,
39
Table 3. 3 : Compressive strength test results of Group 1 (55% SSCA).
Series Cement (% by weight) σc,7 σc,14 σc,28 Recyled Rubber (% by weight) Unit Weight (kN/m3) AK-1 35 26,725 29.981 37.525 2 20.60 AK-2 35 27.554 33.523 40.999 3 21.80 AK-3 35 27.084 31.390 37.130 4 21.00 AK-4 35 28.629 34.893 42.532 5 22.10 AK-5 38 35.795 41.229 55.748 2 22.00 AK-6 38 37.629 41.524 48.672 3 21.90 AK-7 38 35.394 37.965 43.520 4 21.80 AK-8 38 30.076 33.456 39.918 5 21.90 AK-9 40 41.979 45.445 53.219 2 22.00 AK-10 40 37.421 42.316 45.316 3 22.10 AK-11 40 39.216 43.713 46.664 4 22.00 AK-12 40 35.666 36.526 44.742 5 21.70 AK-13 43 45.051 45.220 54.055 2 21.70 AK-14 43 42.416 44.900 49.746 3 22.20 AK-15 43 39.381 41.869 48.340 4 21.60 AK-16 43 39.640 39.801 44.916 5 21.20 AK-17 45 49.320 49.664 59.249 2 22.10 AK-18 45 44.663 46.787 51.833 3 21.50 AK-19 45 40.108 40.235 46.646 4 21.30 AK-20 45 37.269 37.326 46.792 5 21.70