https://doi.org/10.1007/s10967-020-07469-y
Preparation, characterization and comparative ionizing
electromagnetic radiation performances: PART II‑ceramic reinforced
polymeric composites
E. Eren Belgin1 · G. A. Aycik1
Received: 20 March 2020 / Accepted: 15 October 2020 / Published online: 29 October 2020 © Akadémiai Kiadó, Budapest, Hungary 2020
Abstract
In this study, isophytalitic unsaturated polyester based composites were prepared by reinforcing with boron carbide, silicon carbide and tungsten carbide. IEMR attenuation properties of the composites were investigated by gamma spectroscopy for different IEMR energies after density evaluation and structural characterization of the composites. Mass attenuation coef-ficients of composites were higher than lead although they were 5–7 times lighter than lead.
Keywords Ionizing electromagnetic radiation · Radiation shielding · Composite radiation shielding · Polymer composite ·
Ceramic shielding
Introduction
Ionizing electromagnetic radiation (IEMR) usage became commonplace by the developing technology especially for medical applications for both diagnosis of traumas and sev-eral diseases (radiology) and treatment of sevsev-eral diseases (nuclear medicine treatments) especially cancer [1]. Nuclear energy production, industrial and scientific applications are other important usage areas of IEMR. Biological hazards of IEMR were also recognized by the 20th century besides its usage benefits and several shielding materials have been used for protection from these hazards. Especially, charge-less gamma and X-rays with high energy have to be shielded by proper materials because of their high penetrating abil-ity through matter. IEMR interacts with absorber shield’s atoms or atomic electrons by transferring its energy while penetrating through the shield material. Thus, energy of IEMR is reduced to acceptable levels or totally depleted. The interaction of IEMR with shielding material increases with high density and closed pack crystal structure of mate-rial that increases probability of coming across IEMR with an atom. Lead is traditionally the most widely used shielding
material because of its high density while it has significant disadvantages as toxicity and heaviness.
Due to disadvantages of lead IEMR shielding it became a challenge to develop more convenient composite shielding materials during the last decades. In the literature there are reported studies about polymeric IEMR shielding materials that different polymers are reinforced with different rein-forcement materials in this manner.
Tungsten is an excellent substance for attenuating gamma rays due to its high density. However, since tungsten is unstable, it is not available in pure, solid state, therefore, there is difficulty in machining and casting. Thus tungsten or tungsten compound reinforced composite material pro-duction studies are carried out by using polymer binders [2, 3]. Nano tungsten reinforced polyethylene [4], tungsten reinforced ethylene vinyl acetate [5], tungsten reinforced epoxy [6] are some of the polymeric composites studied for this purpose.
Boron carbide reinforced composites have been examined mostly in terms of neutron shielding properties in the lit-erature. However, there are also studies on the use of boron reinforcements for gamma shielding in limited numbers. Boron fiber reinforced epoxy matrix [7], composite struc-tures containing paraffin/polyethylene and boron compounds [8], capture thermal neutrons and stop secondary gamma rays using epoxy, amide-polymer and amide-polymer-amine-added boron composites [9], development of composite materials that absorb neutron and gamma rays using steel, * E. Eren Belgin
1 Chemistry Department, Mugla Sitki Koçman University, Kotekli Campus, 48000 Mugla, Turkey
paraffin, polyethylene and boron carbide [8], examination of the neutron and secondary gamma ray attenuation properties of composites containing paraffin and boron carbide [10] are some of these studies.
In another study, where the radiation shielding proper-ties of polymer composites containing tungsten carbide and boron carbide reinforcements were examined together, it was stated that these composites could be a candidate for protec-tion against gamma ray applicaprotec-tions [11]. On the other hand, silicon carbide reinforced polymeric composites were not studied as IEMR shielding materials. In addition, in the stud-ies mentioned above, the shielding propertstud-ies of composites have been studied at different different specific gamma pho-ton energies.
In our previous studies [12–14], as well as first part of this study [15], polymer based composite shielding materials reinforced with metal oxides or minerals are also produced and characterized as alternative IEMR shielding materials. In our previous study [15], isophytalitic unsaturated polyes-ter (PES) based and metal oxide reinforced composites were produced and characterized. Since the produced composites showed good performances, this study was done as continu-ation of our previous study and unlike the previous study, composites were produced by using ceramic reinforcements (boron carbide (B4C), silicon carbide (SiC) and tungsten
carbide (WC) instead of metal oxides. Thus, in this study it is aimed to investigate effect of ceramic reinforcements on IEMR shielding performances of the composites.
IEMR attenuation properties of the composites were investigated by gamma spectrometric method for different IEMR energies after density evaluation and structural char-acterization of the composites were held. The IEMR attenua-tion performance of the ceramic loaded polymer composites has been studied at different specific gamma photon energies (by using relevant radioactive sources/mixed source) in order to understand the possible use of these composites in differ-ent areas of their possible application.
Experimental
PES used as composite matrix (1.15 g cm−3) was procured
commercially as resin form in styrene monomer. Styrene allowed preparation of a homogeneous mixture by decreas-ing viscosity of the resin. Commercially procured methyl ethyl ketone peroxide (MEKP) initiator and cobalt octaate (Coct) catalyst were used to carry out polymerization reac-tions. Three different ceramic reinforcements were used as B4C, SiC and WC. Commercially procured reinforcements’
properties are given in Table 1.
Composites were prepared via radical polymerization reactions by forming crosslinks within PES resin. Details of the production method is given in our previous study [15].
Composite designations used in the study and reinforcement loading ratios are given in Table 2.
Densities of the composites were determined experimen-tally by using an Archimedes’ measurement equipment as well as theoretically. Fourier transform infrared spectroscopy (FTIR) analysis were carried out to understand nature of inter-action between PES and reinforcements. Scanning electron microscope (SEM) was used for morphological examination of composites. Details of the characterization methods are given in our previous studies [12, 15].
A 110 cm3 well-type HPGe detector coupled with a 64 k
channel analyser and a commercial disc shaped standard mixed point gamma source (Eckert&Ziegler-Mixed) was used for IEMR attenuation performance measurements. Meas-urements were held for several photopeak energies ranging between 60 and 1836 keV that allows performance examina-tion for low (0–500 keV), intermediate (500–1100 keV) and high (> 1100 keV) IEMR energy regions. The spectra were evaluated by using the Maestro-ORTEC software program and percentage attenuation performances (F%), linear (µL) and mass (µM) attenuation coefficients of the composites were
cal-culated. Details of the gamma spectrometric measurement set up and methods are given detailed in previous articles [12–15].
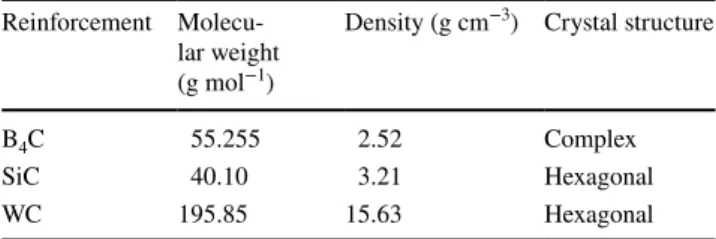
Table 1 Chemical properties of used reinforcements
Reinforcement Molecu-lar weight (g mol−1)
Density (g cm−3) Crystal structure
B4C 55.255 2.52 Complex
SiC 40.10 3.21 Hexagonal
WC 195.85 15.63 Hexagonal
Table 2 Designations and reinforcement loading ratios of the
com-posites Reinforcement
loading (%) WC reinforced composites Bcomposites4C reinforced SiC reinforced composites 50 5-WC 5-BC 5-SC 40 4-WC 4-BC 4-SC 30 3-WC 3-BC 3-SC 20 2-WC 2-BC 2-SC 10 1-WC 1-BC 1-SC
Results and discussion
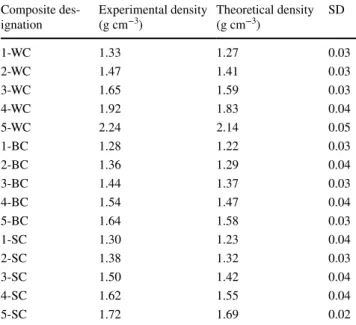
Density and microstructure of the composites Evaluated experimental and theoretical densities of compos-ites with respect to reinforcement loading ratios are given in Table 3.
As it is seen in Table 3, density of the composites were increased with increasing reinforcement loading ratios, as it was expected, due to higher densities of the reinforcements than composite matrix. The density of the composites were increased approximately 94.7%, 43.6% and 49.6% for 50% loading of WC, B4C and SiC reinforcements, respectively in proportion of the reinforcement densities. The deviation val-ues of experimental and theoretical densities were ranging between 0.02 and 0.04. Maximum deviation was observed for 5-WC composite with the value of 0.05. These deviation values were thought to be originated from weighting errors that could be done during production and characterization. Thus experimental and theoretical densities of the compos-ites were compatible with each other.
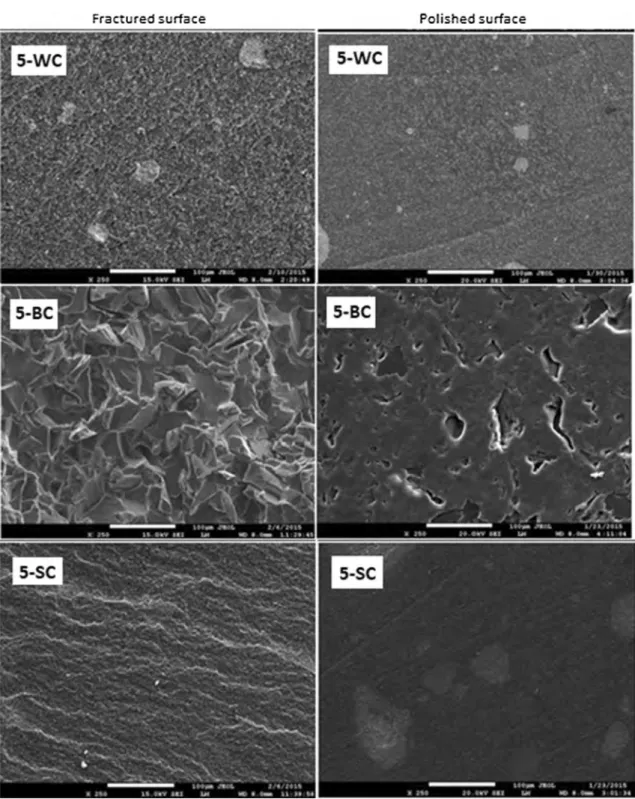
SEM studies were held for polished and fractured sur-faces of 50% loaded composites. The SEM micrographs given in Fig. 1 showed that reinforcements were dispersed homogeneously within PES which is the base requirement for production of a proper composite material.
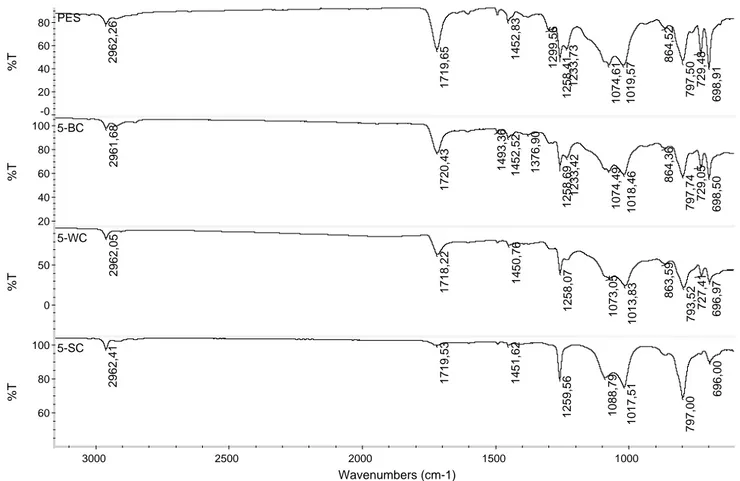
The FTIR spectrums of the 50% reinforced composites and composite matrix PES are given in Fig. 2. The same characteristic transmission bands (~ 1720, 1240, 1015, 790 cm−1) were observed for composite matrix PES and
reinforced composites. The insignificant differences between
peak locations of the composites showed that chemical structure of the PES was not change due to reinforcement loading. The bond density of the interested region of ana-lysed sample caused allowable value differences between percentage transmission value of these bands.
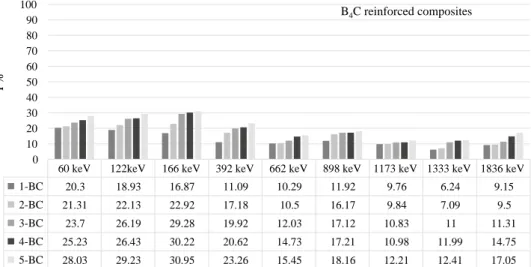
IEMR attenuation performances of the composites
F% values of the WC, B4C and SiC reinforced compos-ites were determined by gamma spectrometry and given in Figs. 3, 4 and 5, respectively.
The predominant interaction process for low (10 keV < E < 500 keV) IEMR energy region is photoelec-tric effect that first falls of rapidly then more slowly with increasing energy for photon energies above the K-binding energy of the absorber material. The photoelectric effect is approximately proportional to Z5 where Z represents atomic
number of the absorber material. When the IEMR energy rises (600 keV < E < 4 MeV) the Compton effect becomes as the process responsible for the energy loss. The Compton scattering per electron is nearly independent of Z and there-fore the scattering coefficient per atom is proportional to Z. The last of the predominant energy loss processes is pair production and it cannot occur when IEMR energy is less than 1.02 MeV. Thus it is the predominant process at high energy region and it is proportional to Z2 [16].
Thus, an increment tendency of Z% values was observed for all the composites as reinforcement loading ratio was increased but accruement of attenuation performance dif-fered as IEMR energy increased due to predominant inter-action mechanisms of IEMR with absorber material. Below 500 keV; photoelectric effect and above 1.022 MeV; pair production mechanisms were predominant while Comp-ton scattering is predominant between these energies. The dependency of these mechanisms on atomic number of the absorber were Z5, Z and Z2 with increasing IEMR energy and
according to this phenomenon, the attenuation performances of the composites were expected to show sharpest increment with increasing composite loading ratio for low energies as it is seen in Figs. 3, 4 and 5. The increments were smoother for intermediate IEMR energies while a bit rapid increment were observed at high energies.
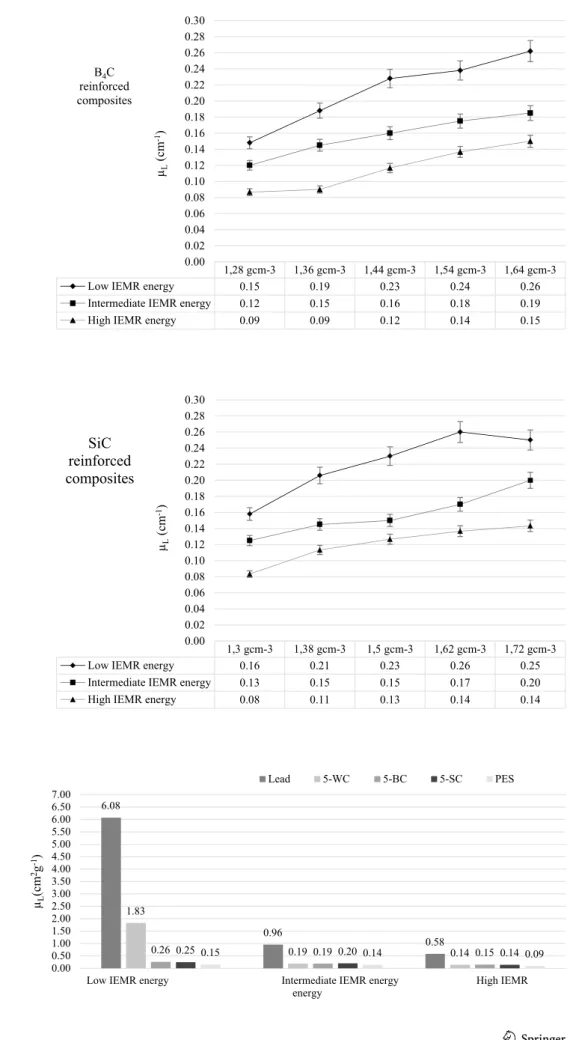
Density effect on IEMR attenuation performances of the composites
As it was mentioned before, the composite densities were increased with increasing reinforcement loading ratio since densities of the reinforcements are higher than com-posite PES matrix. Since density is an important property of a shielding material for both performance and weight, the dependence of µL values of the prepared composites on desities are shown in Figs. 6, 7 and 8. The mean values
Table 3 Experimental and theoretical densities of the composites
Composite
des-ignation Experimental density (g cm−3) Theoretical density (g cm−3) SD
1-WC 1.33 1.27 0.03 2-WC 1.47 1.41 0.03 3-WC 1.65 1.59 0.03 4-WC 1.92 1.83 0.04 5-WC 2.24 2.14 0.05 1-BC 1.28 1.22 0.03 2-BC 1.36 1.29 0.04 3-BC 1.44 1.37 0.03 4-BC 1.54 1.47 0.04 5-BC 1.64 1.58 0.03 1-SC 1.30 1.23 0.04 2-SC 1.38 1.32 0.03 3-SC 1.50 1.42 0.04 4-SC 1.62 1.55 0.04 5-SC 1.72 1.69 0.02
of the IEMR energies subsumed by low, intermediate and high energy regions were used for a more comprehensible comparison. Mean of 60, 122, 166, 392 keV results were taken as low energy result while mean of 662, 898 keV results and mean of 1173, 1333, 1836 keV results were used for intermediate and high energy regions, respectiv ely.
The same phenomenon of different predominant interaction mechanisms for different IEMR energies is manifested itself for µL values of composites. In the study, the µL values of the
composites increased with increasing density of the compos-ites for all energy regions and all composcompos-ites. This increment was more sharply (due to Z5 dependence) at low IEMR energy
region and the density became less effective on µL values for
Fig. 1 SEM micrographs (×250) of polished and fractured surfaces of composites with 50% reinforcement loading ratio
intermediate (due to Z dependence) energy and high energy (due to Z2 dependence) region as it was expected.
Reinforcement type effect on linear and mass attenuation coefficients
IEMR attenuates by the absorber material by interacting with atoms and atomic electrons of the absorber material.
This interaction leads energy loss of the IEMR while pen-etrating through the material leading low energy at the exit of the material or totally energy lost inside the material. Thus, attenuation of IEMR through the absorber material increases with increasing probability of coming across of IEMR with an atom. This probability increases as density and molecular weight of the absorber material increases. Crystal structure of the material is also a parameter that
698,91 729,48 797,50 864,52 1019,57 1074,61 1233,73 1258,41 1299,56 1452,83 1719,65 2962,26 PES -0 20 40 60 80 %T 698,50 729,05 797,74 864,36 1018,46 1074,49 1233,42 1258,69 1376,90 1452,52 1493,36 1720,43 2961,68 5-BC 20 40 60 80 100 %T 696,97 727,41 793,52 863,59 1013,83 1073,05 1258,07 1450,76 1718,22 2962,05 5-WC 0 50 %T 696,00 797,00 1017,51 1088,79 1259,56 1451,62 1719,53 2962,41 5-SC 60 80 100 %T 1000 1500 2000 2500 3000 Wavenumbers (cm-1)
Fig. 2 FTIR spectrums of the PES and 50% reinforced composites
Fig. 3 F% values of WC
rein-forced composites at different IEMR energies
60 keV 122keV 166 keV 392 keV 662 keV 898 keV 1173 keV 1333 keV 1836 keV 1-WC 45.09 44.61 24.49 21.02 11.23 14.11 8.21 9.65 9.36 2-WC 69.1 62.22 40.11 21.13 11.64 15.17 8.29 10.23 9.39 3-WC 81.3 79.25 59.99 23.37 11.73 16.58 10.26 11.05 11.16 4-WC 92.52 90.15 66.65 25.79 15.79 17.81 10.99 11.18 12.71 5-WC 98.21 96.15 78.14 27.96 16.03 19.17 12.99 11.24 14.66 0 10 20 30 40 50 60 70 80 90 100 F% WC reinforced composites
·
-
,
-
·
-
·
-
·
-
·
-
,
-
·
-
·
-
·
-
·
-
,
-
·
-
·
-
·
-
·
-
,
-
·
-
·
-
·
-
·
-
,
-
·
-
·
-
·
-• • • •I I
I
11
11
I 1
1
I
II
11
11 I
II
111
1
Fig. 4 F% values of B4C rein-forced composites at different IEMR energies
60 keV 122keV 166 keV 392 keV 662 keV 898 keV 1173 keV 1333 keV 1836 keV 1-BC 20.3 18.93 16.87 11.09 10.29 11.92 9.76 6.24 9.15 2-BC 21.31 22.13 22.92 17.18 10.5 16.17 9.84 7.09 9.5 3-BC 23.7 26.19 29.28 19.92 12.03 17.12 10.83 11 11.31 4-BC 25.23 26.43 30.22 20.62 14.73 17.21 10.98 11.99 14.75 5-BC 28.03 29.23 30.95 23.26 15.45 18.16 12.21 12.41 17.05 0 10 20 30 40 50 60 70 80 90 100 F% B4C reinforced composites
Fig. 5 F% values of SiC
rein-forced composites at different IEMR energies 60 122 166 392 662 898 1173 1333 1836 1-FEO 21.52 20.58 12.68 16.45 9.41 14.31 9.04 7.43 8.13 2-FEO 25.58 20.81 25.03 18.95 10.86 16.8 9.19 9.02 14.31 3-FEO 29.68 20.83 29.44 19.59 11.35 16.87 10.31 10.2 14.51 4-FEO 32.62 25.02 29.91 22.65 13.44 18.16 11.39 11.87 14.98 5-FEO 36.47 26.54 19.67 23.72 13.65 21.78 12.33 12.11 15.21 0 10 20 30 40 50 60 70 80 90 100 F%
SiC reinforced composites
Fig. 6 Plot of dependence of
µL values on density of WC reinforced composites
1,33 gcm-3 1,47 gcm-3 1,65 gcm-3 1,92 gcm-3 2,24 gcm-3
Low IEMR energy 0.34 0.58 0.89 1.26 1.83
Intermediate IEMR energy 0.14 0.14 0.15 0.19 0.19
High IEMR energy 0.10 0.10 0.12 0.13 0.14
0.00 0.20 0.40 0.60 0.80 1.00 1.20 1.40 1.60 1.80 2.00 µL (c m -1) WC reinforced composites • • • • • • • •
---+----
--- J.-Il
l
111
1
1
11
I
I
I
I
I
I
I
II
I
II
III
111
1
I
II
Il
l
.
1
1
1
1
1
1
I
I
I
I
II
I
II
1
111
I
II
I I I :!
Fig. 7 Plot of dependence of
µL values on density of B4C reinforced filled composites
1,28 gcm-3 1,36 gcm-3 1,44 gcm-3 1,54 gcm-3 1,64 gcm-3
Low IEMR energy 0.15 0.19 0.23 0.24 0.26
Intermediate IEMR energy 0.12 0.15 0.16 0.18 0.19
High IEMR energy 0.09 0.09 0.12 0.14 0.15
0.00 0.02 0.04 0.06 0.08 0.10 0.12 0.14 0.16 0.18 0.20 0.22 0.24 0.26 0.28 0.30 µL (c m -1) B4C reinforced composites
Fig. 8 Plot of dependence of
µL values on density of SiC reinforced filled composites
1,3 gcm-3 1,38 gcm-3 1,5 gcm-3 1,62 gcm-3 1,72 gcm-3
Low IEMR energy 0.16 0.21 0.23 0.26 0.25
Intermediate IEMR energy 0.13 0.15 0.15 0.17 0.20
High IEMR energy 0.08 0.11 0.13 0.14 0.14
0.00 0.02 0.04 0.06 0.08 0.10 0.12 0.14 0.16 0.18 0.20 0.22 0.24 0.26 0.28 0.30 µL (c m -1) SiC reinforced composites
Fig. 9 µL values of composites
and lead for low, intermediate
and high IEMR energy regions 6.08
0.96 0.58 1.83 0.19 0.14 0.26 0.25 0.15 0.19 0.20 0.14 0.15 0.14 0.09 0.00 0.50 1.00 1.50 2.00 2.50 3.00 3.50 4.00 4.50 5.00 5.50 6.00 6.50 7.00 µL (cm 2g -1)
Low IEMR energy Intermediate IEMR energy High IEMR energy Lead 5-WC 5-BC 5-SC PES
---+-
--- & ----+-
----• • • ••
-
-
•
-
-
-
•
-
-
-effects this probability. If the crystal structure of the mate-rial close pack the free volume in the matemate-rial decreases that increases interaction probability.
In Fig. 9, µL values of the 50% reinforced composites
(showing the highest performances) and lead are compared for low, intermediate and high energy regions.
In Fig. 9, lead showed higher µL values for all energy regions but especially for low IEMR energy region because of the high dependency of attenuation rate on Z number of absorber material at low energies. Lead’s high density and closed pack crystal structure makes it a proper IEMR shielding material by high interaction probability of lead atoms with IEMR. On the other hand, the disadvantages of lead as toxicity, heaviness and poor mechanical/chemical properties give rise to novel shielding material pursuit. 5-WC composite reached approximately 30% performance of lead at low energy region. The composites reached approximately 20% and 26% of lead’s performance for intermediate and high energy regions, respectively. By fix-ing our attention on need of light weight shieldfix-ing mate-rials it was an important point that 5-WC composite was approximately 5.3 times, 5-BC composite was approxi-mately 7.2 times and 5-SC was approxiapproxi-mately 6.7 times lighter than lead. Also all the composites was superior when compared to lead due to their non-toxic nature.
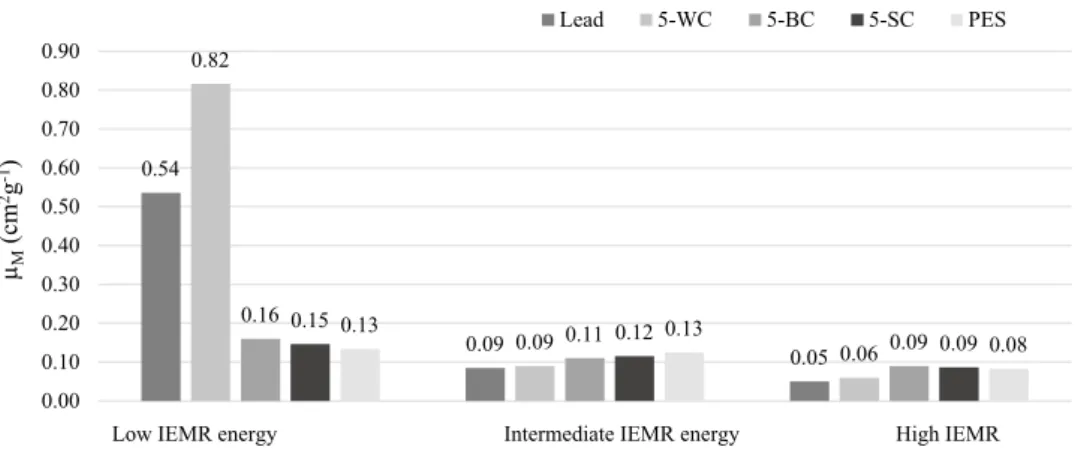
In this perspective, not only µL value but also µM value
that gives attenuation performance as unit mass density of the shielding material is an important parameter for a shielding material. Thus µM values of the 50% loaded
com-posites, composite matrix PES and lead are given for low, intermediate and high IEMR energy regions in Fig. 10.
As it is seen Fig. 10, although µL values of lead was
higher than the composites µM values of lead was lower
than all the composites for intermediate and high energy regions due to its high density. µM value of 5-WC compos-ite was also approximately 1.5 times higher than lead for low IEMR energy region.
Conclusions
According to the results, dispersion of reinforcement par-ticles was homogeneous within the PES matrix and chemi-cal structure of the matrix was not changed by reinforce-ment loading. Different IEMR attenuation performances observed for composites at different energy regions. Composites with higher reinforcement loading showed better attenuation performances. Performance differences became insignificant as IEMR energy increased due to dif-ferent predominant interaction mechanisms of IEMR with absorber material at different energy levels. Mass attenua-tion coefficient values of lead was lower than all the com-posites for intermediate and high energy regions due to its high density. Mass attenuation value of 5-WC composite was also approximately 1.5 times higher than lead for low IEMR energy region. 5-WC composite was approximately 5.3 times, 5-BC composite was approximately 7.2 times and 5-SC was approximately 6.7 times lighter than lead. Also all the composites were superior when compared to lead due to their non-toxic nature.
Acknowledgements The authors would like to acknowledge the
finan-cial assistance of the Mugla Sitki Kocman University through the Grant 2014/003 February 2014.
References
1. McCulloch M, Fischer K, Kearfott K (2018) Medical professional radiation dosimeter usage: reasons for noncompliance. Health Phys 15(5):646–651
2. Elbatal FH, Ouis MA (2011) UV–visible and infrared absorption spectroscopic studies of gamma irradiated tungsten-doped lithium phosphate glasses. Phys B 406:4175–4182
3. Elbatal HA, Abdelghanyb AM, Elbatal FH, Ezzeldinc FM (2012) Gamma ray’s interactions with WO3-doped lead borate glasses. Mater Chem Phys 134:542–548
Fig. 10 µM values of the
prepared composites, PES and elemental lead 0.54 0.09 0.05 0.82 0.09 0.06 0.16 0.11 0.09 0.15 0.12 0.09 0.13 0.13 0.08 0.00 0.10 0.20 0.30 0.40 0.50 0.60 0.70 0.80 0.90 µM (cm 2g -1)
Low IEMR energy Intermediate IEMR energy High IEMR energy
Lead 5-WC 5-BC 5-SC PES
• • • •
4. Kim J, Seo D, Lee BC, Seo YS, Miller WH (2014) Nano-W dispersed gamma radiation shielding materials. Adv Eng Mater 16:1083–1089
5. Ersoz OA, Lambrecht FY, Soylu HM (2016) Tungsten-ethylene vinyl acetate (EVA) composite as a gamma rays shielding mate-rial. Indian J Pure Appl Phys 54:793–796
6. Chang L, Zhang Y, Liu Y, Fang J, Luan W, Yang X, Zhang W (2015) Preparation and characterization of tungsten/epoxy com-posites for gamma-rays radiation shielding. Nucl Instrum Methods Phys Res B 356:88–93
7. Bullock RE (1974) Mechanical of a boron-reinforced composite material radiation induced of its epoxy matrix. J Compos Mater 8(1):97–101
8. Calzada E, Grünauer F, Schillinger B, Türck H (2011) Reusable shieldingmaterialfor neutron andgammaradiation. Nuclear Instru-ments and Methods in Physics Research A. 651:77–80
9. Craft AE, King JC (2009) Radiation shielding options for the affordable fission surface power system. In: Robertson GA (ed) CP1103, space, propulsion and energy sciences international forum, SPESIF. American Institute of Physics, College Park 10. Ghassoun J, Senhou N, Jehouani A (2011) Neutron and photon
doses in high energy radiotherapy facilities and evaluationof shielding performance by Monte Carlo method. Ann Nucl Energy 38:2163–2167
11. Erol A, Pocan I, Yanbay E, Ersoz OA, Lambrecht FY (2016) Radiation shielding of polymer composite materials with wolfram carbide and boron carbide. Radiat Protect Environ 39:3–6
12. Eren Belgin E, Ayçık GA (2015) Preparation and radiation attenu-ation performances of metal oxide filled polyethylene based com-posites for ionizing electromagnetic radiation shielding applica-tions. J Radioanal Nucl Chem 306:107–117
13. Eren Belgin E, Aycik GA, Kalemtas A, Pelit A, Dilek DA, Kavak MT (2015) Preparation and characterization of a novel ionizing electromagnetic radiation shielding material; hematite filled poly-ester based composites. Radiat Phys Chem 115(43–48):2015 14. Eren Belgin E, Aycik GA, Kalemtas A, Pelit A, Dilek DA, Kavak
MT (2016) Usability of natural titanium-iron oxide as filler mate-rial for ionizing electromagnetic radiation shielding composites; preparation, characterization and performance. J Radioanal Nucl Chem 309:659–666
15. Eren Belgin E, Aycik GA (2020) Preparation, characterization and comparative ionizing electromagnetic radiation performances: part I—metal oxide reinforced polymeric composites. J Radioanal Nucl Chem. https ://doi.org/10.1007/s1096 7-020-07245 -y
16. Friedlander G, Kennedy JW, Macias ES, Miller JM (1981) Nuclear and radiochemistry. Wiley, New York
Publisher’s Note Springer Nature remains neutral with regard to