Access this article online Quick Response Code:
Website: www.njcponline.com DOI: 10.4103/1119-3077.224794 PMID: *******
We compared and evaluated the effects of two techniques used for surgically assisted rapid maxillary expansion (SARME) using three-dimensional (3D) cone-beam computed tomography, focusing on changes in soft and hard tissue in the malar region. A conventional Le Fort I osteotomy group (10 patients, mean age: 19.3 years) and a high Le Fort I group (12 patients, mean age: 20.4 years) underwent 3D analyses. Changes in hard and soft tissue of the malar region were compared. The average increases in the bone malar width and soft malar width in the high Le Fort I group between the pre- and postoperative periods were 1.43 ± 1.23 and 1.39 ± 1.19 mm, respectively. The average increases in the bone malar depth on the right and left sides in the high Le Fort I group were 1.34 ± 0.81 and 1.60 ± 0.54 mm, respectively. Progress in hard tissues did not reflect significant changes in soft tissue. Context: Effects of high Le Fort I SARME on the malar complex. Aims: To compare and evaluate the effects of two techniques used for SARME, using 3D cone-beam computed tomography, focusing on changes in hard and soft tissues in the malar region. Settings and Design: A conventional Le Fort I osteotomy group (10 patients, mean age: 19.3 years) and a high Le Fort I group (12 patients, mean age: 20.4 years). Methods and Material: Each group underwent 3D analyses, and changes in hard and soft tissues of the malar region were compared. Statistical Analysis Used: The SPSS software (ver. 15.0 for Windows) was used. The Kolmogorov-Smirnov test, Student’s t test, and paired-samples test were conducted. Results: The average increases in the bone malar width and soft malar width in the high Le Fort I group between the pre- and postoperative periods were 1.43 ± 1.23 and 1.39 ± 1.19 mm, respectively. The average increases in the bone malar depth on the right and left sides in the high Le Fort I group were 1.34 ± 0.81 and 1.60 ± 0.54 mm, respectively. Conclusions: Progress in hard tissues did not reflect significant changes in soft tissue.
Key Messages: Effects of high Le Fort I SARME on the malar complex
Keywords: High Le Fort I, malar deficiency, surgically assisted rapid maxillary
expansion
Evaluation of Two Different Rapid Maxillary Expansion Surgical
Techniques and Their Effects on the Malar Complex Based on 3D
Cone-Beam Computed Tomography
P Aktop, S Biren, S Aktop1, M Motro2, C Delilbasi3, G Gurler3, G Dergin1
Address for correspondence: Dr. Sertac Aktop, Marmara Universitesi, Saglık Bilimleri Yerleskesi, Dishekimligi Fakultesi Agız Dis ve Cene Cerrahisi, AD Basibuyuk, Maltepe, Istanbul, Turkey. E-mail: [email protected] chewing, dental clustering, and nasal blockage, leading to buccal breathing and apnea.[2,3] TMD often presents
I
ntroductIonA
transverse maxillary discrepancy (TMD) is one of the most common dentoskeletal problems encountered in clinical orthodontics.[1] TMD, isolated orassociated with other dentofacial deformities, results in aesthetic and functional impairment, such as difficulty Departments of Orthodontics
and 1Oral and Maxillofacial
Surgery, Faculty of Dentistry, Marmara University,
Istanbul, Turkey, 2Department
of Orthodontics and Dentofacial Orthopedics, School of Dental Medicine, Boston University, Boston, Massachusetts, USA,
3Department of Oral and
Maxillofacial Surgery, Faculty of Dentistry, Medipol University, Istanbul, Turkey
A
bstr
A
ct
How to cite this article: Aktop P, Biren S, Aktop S, Motro M, Delilbasi C, Gurler G, et al. Evaluation of two different rapid maxillary expansion surgical techniques and their effects on the malar complex based on 3D cone-beam computed tomography. Niger J Clin Pract 2018;21:13-21. This is an open access article distributed under the terms of the Creative Commons Attribution-NonCommercial-ShareAlike 3.0 License, which allows others to remix, tweak, and build upon the work non-commercially, as long as the author is credited and the new creations are licensed under the identical terms.
For reprints contact: [email protected] Date of Acceptance:
with dental crowding, a narrow maxilla, a deep palatal vault, and midfacial deficiency (MD).[4]
MD is usually characterized by paranasal hollowing and a flat malar eminence.[5] The malar eminence is defined
as the point below the lateral canthus, which gives the impression of being the most prominent point of the malar mound in any view.[6] MD is best viewed and
judged from the oblique view, where contours of the profile may be analyzed.[5] Upon clinical evaluation of
the frontal view, further attention should be given to the triangular area located between the nasal base at the alar crease junction and the upper end of the nasolabial sulcus. This triangle represents the paranasal triangle, in which the depth can be assessed. Maxillary hypoplasia is often associated with a deep paranasal triangle.
[5] Many researchers have stated that the evaluation of
oblique views is most important for the assessment of the contour and projection of the malar complex.[6,7]
The malar mound is known to define the contours of the lateral middle face, between the inferior orbital rim and the mandible. Thus, hypoplasia or asymmetry in this region is readily noticeable. With the advent of malar augmentation in the early 1970s, various reports have discussed the exact location of the malar complex in understanding its morphology for guidance during the placement of malar implants. The malar eminence has been defined as the point below the lateral canthus, which gives the impression of being the most prominent point of the malar mound in any view. The malar line of eminence of the malar mound has been suggested to be in a posterosuperior-to-anteroinferior direction.[6]
For skeletally mature patients, rapid maxillary expansion (RME) has been shown to have limited orthopedic effects on maxillary skeletal structures, because of the increased thickness of bones, with reduced elasticity, and obliteration of the maxillary sutures, which accompany maturation. Surgically assisted rapid maxillary expansion (SARME) has been used in recent years to overcome these obstacles and offers a true orthopedic result without unwanted adverse effects, such as lateral tipping of the posterior teeth, buccal fenestrations, failure to open the mid-palatal suture, alveolar bending, extrusion of posterior teeth, pain, instability, and root resorption.[2,8]
In younger patients, conventional orthodontic RME before closure of the midpalatal suture has been reported to be successful.[9-11] Because of more complications after
attempts to orthopedically alter the transverse dimensions of the maxilla with advancing age, surgical procedures have been recommended to facilitate correction of transverse discrepancies.[8] Indeed, to treat TMD, several
surgical techniques have been proposed based on the anatomical regions that resist the expansion of the jaw.[12]
SARME can be used to treat TMD but not malar deficiencies.[12] Patients with both TMD and a lack of a
malar eminence, causing MD, are currently treated with SARME and malar implants[6] or SARME and partial/
total maxillary orthognathic advancement,[13,14] meaning
that two different surgical procedures are performed at different times. In this study, we treated TMD patients with a flat malar eminence in a different way, using a single surgical procedure in appropriate cases.
We compared and evaluated the effects of two SARME techniques on the malar complex, namely, we performed surgery with a conventional versus a high Le Fort I osteotomy line. The evaluation was made using three-dimensional (3D) cone-beam computed tomography (CBCT), focusing on changes in hard and soft tissues in the malar region in terms of malar depth and width. This was a retrospective study, approved by the local Health Sciences Ethical Committee. CBCT records of 22 patients (eight males, 14 females, mean age: 19.9 years) were recruited from the Department of Orthodontics at the university’s Faculty of Dentistry. All subjects were Caucasians, from the same geographic area. Informed surgery consent forms were signed by the parents or guardians of all patients.
Patients were selected for the study based on the following criteria
Patient selection criteria were skeletally mature/adult; TMD with unilateral/bilateral posterior cross-bite; MD in the high Le Fort I group; no underlying systemic disease, craniofacial deformity, or previous orthodontic treatment; SARME was included as part of an initial orthodontic treatment plan; and MD was determined using the Prendergast and Schroenrock analysis.[6]
CBCTs were obtained before SARME and 12 months after completion of the expansion, as for all patients treated in the Department of Orthodontics. From the available archive records, we created two groups of patients according to which surgical protocol was used: a Le Fort I group and a high Le Fort I group. In the first group (10 patients, mean age: 19.3 years), a conventional Le Fort I osteotomy without a down fracture had been performed under general anesthesia. In the high Le Fort I group (12 patients, mean age: 20.4 years) group, a modified Le Fort I osteotomy at a more superior level without a down fracture had been performed under general anesthesia. Appliance design
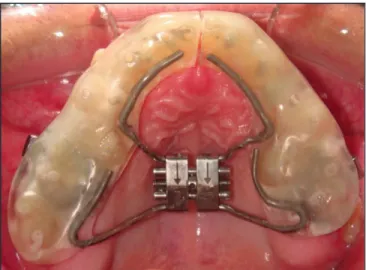
The SARME appliance of choice was the acrylic cap-splint. An alginate impression of the upper jaw was obtained; using this impression, a stone model was poured. The largest Hyrax screw (G and H Wire Company, Hanover, Germany) possible was positioned as
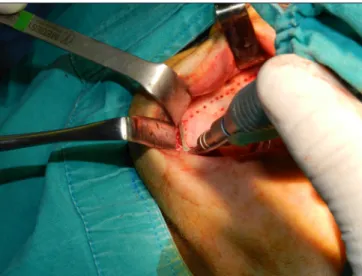
below the inferior turbinate and septum were exposed with an intranasal dissection. Before the modified high Le Fort I maxillary osteotomy was performed, the osteotomy line was marked with a #14 round bur. Horizontal osteotomies, proceeding from the anterior portion of zygomatic bone through the posterior-lateral maxillary wall, 5 mm below the infraorbital foramen, to the lateral nasal wall, across the anterior maxillary wall, were accomplished with a reciprocating saw, directed posterior to anteriorly, following the previously marked osteotomy line [Figure 4]. Vertical cuts down to the most distal part of horizontal osteotomy on the zygomatic bone were performed with an oscillating saw, angled at 45° anterio-posteriorly in the coronal plane, to allow segment sliding over the zygoma in distraction [Figure 5]. Sliding of the distal portion of bone segment on the zygoma pushes or bends the distal portions of the distracted bone forward, augmenting the malar deficiency while correcting the transverse insufficiency [Figure 6a] and [Figure 6b]. To separate the nasal septum and vomer from the maxillary crest, a septal osteotome was used to prevent nasal septum deviation after distraction. A curved osteotome was used to separate the pterygoid plate from the maxillary tuberosity. Finally, a midpalatal split, from the anterior to the posterior nasal spine, was performed with an osteotome [Figure 7].
After the osteotomy was complete, the hyrax appliance was activated to check that it worked properly and this was followed by immediate regression, leaving a 1-mm gap, instead of the osteotome. The patients received postoperative prophylactic antibiotics (cefazolin sodium 1 g IM BID, Sefazol, Mustafa Nevzat) and analgesics (tenoxicam 20 mg BID, Oksamen, Mustafa Nevzat) for 7 days postoperatively.
Postoperative protocol
Three days after the surgery, the patients’ parents/ guardians were taught how to turn the screw and activate the expansion appliance. They were instructed to activate it twice per day; per activation, a ¼-turn of the hyrax screw expanded the cap-splint by 0.25 mm. Thus, 0.5 mm of expansion daily was expected. Expansion was ended when the palatal cusps of the maxillary molars coincided with the buccal cusps of the antagonist mandibular molars. Then, the patients were examined monthly for the 6-month retention period.
At the end of this phase, the cap-splint was removed and a fixed transpalatal arch with arms extending along the palatal aspects of the premolars and canines was placed. Records were taken before and 12 months after surgery for comparison. Records obtained included intra- and extraoral photographs and 3D CBCT images. 3D CBCT images were captured using an ILUMA CBCT scanner high and deep as possible into the palatal vault, allowing
it to be closer to the centre of resistance. All of the buccal and lingual, including occlusal/incisal, edge surfaces, from the upper second molars to the upper central incisors were covered with acrylic resin [Figure 1]. The occlusal surfaces were perforated to allow excess cement to escape during fixation. For cementation of the appliance, a light-cured glass ionomer cement (Unitek Multi-Cure Glass Ionomer Orthodontic Band Cement; 3M Unitek Orthodontic Products, Monrovia, California, USA) was used.
Surgical technique
A conventional Le Fort I maxillary osteotomy was performed in the Le Fort I group [Figure 2], including separation of the pterygomaxillary suture. A horizontal incision was made through the mucoperiosteum above the mucogingival junction at the depth of the buccal vestibular, extending from the right first molar region to the left first molar. The nasal mucosa was gently elevated from the nasal lateral wall. A horizontal low-level osteotomy was made through the lateral wall of the maxilla, 6 mm superior to the apexes of the anterior and posterior teeth with tiny rounded burs and then a microsaw, on the same level as the occlusal plane extending from the inferolateral aspect of the piriform rim posteriorly to the inferior aspect of the junction of the maxillary tuberosity and pterygoid plate. The maxilla was separated from the pterygoid plate with a curved osteotome. A sagittal palatal osteotomy was also performed, running from the midline of the alveolar bone, between the central incisors, to the posterior nasal spine. An osteotome was positioned in the central incisor interradicular space and manipulated to achieve equal and symmetric mobilization of the anterior maxilla. The forefinger was positioned on the incisive papilla to feel the redirected osteotome as it transected the deeper portion of the midpalatal suture.
A modified high Le Fort I maxillary osteotomy was performed in the high Le Fort I group [Figure 3], as previously described.[15] Midfacial skeleton exposure
was accomplished through an intraoral labiobuccal incision above the attached gingiva, from first molar to first molar. The anterior maxillary wall and inferior orbital foramen was exposed with a subperiostal dissection superiorly and the dissection was continued to the lateral zygomatic-maxillary buttress and the anterior portion of the zygomatic arch. The whole surgical region was identified with a superior–posterior subperiostal elevation. After the nasomaxillary buttress, the pyriform aperture and the anterior nasal spine were exposed anteriorly, and the pterygoid plates were exposed with a subperiostal dissection posteriorly. Lateral nasal walls
r
esultsPreoperative and postoperative (12 months after SARME), hard and soft tissue 3D data were collected and compared for each patient. CBCT images were analyzed using the Mimics software. Table 1 shows changes in SMW and BMW before and after expansion. The average increases in the BMW and SMW values in the high Le Fort I group between the pre- and postoperative periods
Figure 1: Hyrax acrylic cap-splint appliance
Figure 2: Conventional Le Fort I maxillary osteotomy.
Figure 3: Modified high Le Fort I maxillary osteotomy. (Iluma, Imtec Imaging; 3M Company, Diegem, Belgium),
with 0.4 mm voxel, 0.290 mm pixel, and 0.299 mm slice sizes. The 3D images, obtained in DICOM format, were transferred to a computer using the MIMICS 15.0 software (Materialize; Leuven, Belgium) to further analyze the changes that occurred after SARME. The 3D images were matched and superimposed using bony landmarks in the anterior cranial base.
Determination of planes for 3D analyses
To ensure that linear measurements in 3D format were accurate and repeatable, measuring planes were defined as the starting control measuring point. First, from a lateral view, a vertical plane perpendicular to the Frankfort horizontal plane passing through the posterior border of the orbital extension of zygomatic bone, which represents the lateral wall of the orbit, was created, thus separating two halves of the head, anterior, and posteriorly (Plane A). Second, continuing from the lateral view, a horizontal plane parallel to the Frankfort horizontal plane, passing through the inferior border of the articular eminence, was made to separate the upper and lower halves of the head (Plane B). The new constructed image allowed measurement of transverse changes in bone malar width (BMW) and soft tissue malar width (SMW) before and after SARME.
To measure anteroposterior changes in the malar region, new vertical planes were defined in the left and right segments separately. From the frontal view, a vertical line passing through intersection of the frontozygomatic suture and the superior border outline of the orbit were made (Plane C). After removing the lateral halves, linear anteroposterior changes in the malar region were measurable using the intersecting point of all three planes as the starting control point [Figure 8].
3D measurements
Measurements of BMW and SMW were made by analyzing Planes A and B [Figure 9a] and [Figure 9b]. How these changed anteroposteriorly was assessed by analyzing Plane C on the right and left sides separately [Figure 10a] and [Figure 10b].
Statistical evaluation
The SPSS software (ver. 15.0 for Windows) was used for statistical analyses. Conformity of parameters to a normal distribution was assessed using the Kolmogorov–Smirnov test. The Student’s t test was used for comparisons of descriptive statistics and comparisons of parameters with normal distributions between two groups. The paired-samples t test was used for in-group comparisons of parameters with normal distributions.
significant changes in BMW or SMW in the conventional Le Fort I group between the pre- and postoperative periods (P = 0.742 and 0.227, respectively).
were 1.43 ± 1.23 and 1.39 ± 1.19 mm, respectively; these changes were significant in the high Le Fort I group (P = 0.002 and 0.002, respectively). There were no
Table 1: In-group and intergroup BMW and SMW evaluations
High LeFort I LeFort I Pa
Mean ± SD Mean ± SD BMW Preop 107.24 ± 5.47 106.05 ± 6.49 0.646 (mm) Postop 108.68 ± 5.79 106.08 ± 6.38 0.330 Difference 1.43 ± 1.23 0.29 ± 0.27 Pb 0.002** 0.742 SMW Preop 125.58 ± 7.10 126.55 ± 5.41 0.728 (mm) Postop 126.97 ± 7.47 126.68 ± 5.32 0.919 Difference 1.39 ± 1.19 0.18 ± 0.46 Pb 0.002** 0.227
BMW = bone malar width, SMW = soft tissue malar width. aStudent
t test. bPaired sample t test. **P < 0.01.
Table 2: In-group and intergroup R-BMD and L-BMD evaluations
High LeFort I LeFort I Pa
Mean ± SD Mean ± SD R-BMD Preop 8.10 ± 1.94 6.00 ± 2.95 0.06 (mm) Postop 9.44 ± 2.14 6.10 ± 2.84 0.005** Difference 1.34 ± 0.81 0.10 ± 0.34 Pb 0.001** 0.359 L-BMD Preop 8.35 ± 2.11 7.65 ± 2.47 0.478 (mm) Postop 9.96 ± 2.21 7.75 ± 2.47 0.039* Difference 1.60 ± 0.54 0.10 ± 0.32 Pb 0.001** 0.328
BMD = bone malar depth aStudent t test bPaired sample t test *P <
0.05 **P < 0.01
Figure 5: A 45° anterio-posteriorly angled osteotomy in the coronal plane.
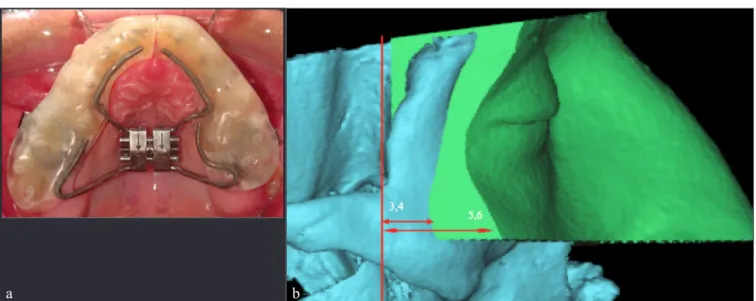
Figure 6: (a) Preoperative 3D image. Red arrow in the yellow circle shows the state of the malar complex before surgery. (b) Postoperative 3D image.
Red arrow in the yellow circle shows the forward movement of the osteomized malar segment after expansion.
a b
Figure 4: Horizontal osteotomy, proceeding from the anterior portion
of the zygomatic bone through the anterior maxillary wall below 5 mm from the infraorbital foramen.
increases in BMD on the right and left sides in the high Le Fort I group were 1.34 ± 0.81 and 1.60 ± 0.54 mm, respectively (P = 0.001 and 0.001, respectively). There were no significant changes in the right or left BMD values in the conventional Le Fort I group between the pre- and postoperative periods (P = 0.359 and 0.328, respectively). There were significant differences between the postoperative right and left BMD values of the high and conventional Le Fort I groups (P = 0.005 and 0.039, respectively). There were positive changes in the SMD on the right and left sides in both groups, but none of them were statistically significant.
Table 4 shows the results of an evaluation of the degree of palatal expansion, where there were significant changes from pre- to postoperative in both groups. There were no significant differences in the total palatal expansion between the groups.
Table 2 and Table 3 show changes in SMD and BMD on the right and left sides in both groups. The average
Figure 7: Final aspect of the total high Le Fort I osteotomy.
Figure 8: Schematic drawing of planes created for measuring transverse
and anteroposterior changes in bone and soft tissue malar width. Plane A = vertical plane perpendicular to the Frankfort horizontal plane, passing through the posterior border of the orbital extension of the zygomatic bone. Plane B = horizontal plane parallel to the Frankfort horizontal plane, passing through the lower border of the articular eminence. Plane C = vertical plane passing through the intersection of the frontozygomatic suture and the superior border outline of the orbit.
a b
Figure 9: (a) A 3D frontal, oblique, inferio-axial, and sagittal view of a new soft tissue region that developed to measure changes in malar width. (b)
Measurements made in the posterior limit of the new plane that had developed, as observed from the inferior-axial view for changes in bone malar width and soft tissue malar width.
Table 3: In-group and intergroup R-SMD and L-SMD evaluations
High LeFort I LeFort I Pa
Mean ± SD Mean ± SD R-SMD Preop 17.68 ± 3.37 18.17 ± 2.81 0.719 (mm) Postop 18.64 ± 2.97 18.43 ± 2.64 0.864 Difference 0.95 ± 1.88 0.25 ± 0.46 Pb 0.100 0.115 L-SMD Preop 18.52 ± 3.10 19.71 ± 2.72 0.356 (mm) Postop 19.28 ± 3.01 20.00 ± 2.49 0.559 Difference 0.76 ± 2.19 0.28 ± 0.45 Pb 0.253 0.78
SMD = soft tissue malar depth aStudent t test bPaired sample t test
Table 4: Evaluations of AAW
High LeFort I LeFort I Pa
Mean ± SD Mean ± SD
AAW Preop 48.99 ± 4.48 50.96 ± 6.32 0.48
(mm) Postop 54.82 ± 5.54 54.67 ± 5.74 0.951
Difference 5.83 ± 4.51 3.70 ± 2.21
Pb 0.001** 0.001**
AAW = Alveolar Arch Width aStudent t test bPaired sample t test *P
might be considered a new combination of a surgical and an orthodontic procedure.
A high Le Fort I osteotomy associated only with maxillary advancement and alveolar distraction has been reported before. In 1991, Norholt et al.[13] performed
an extended Le Fort I osteotomy to correct midfacial hypoplasia in 35 patients, seven of which had cleft palates. After 37 months, the treatment results were clinically stable, with good occlusion. Moreover, masticatory function improved and patients reported satisfactory aesthetic results. In the following years, reported cases of high Le Fort I osteotomies increased, with special attention to cleft patients, particularly because they present with further midfacial hypoplasia. However, the main limitation to this procedure was a lack of osseous healing due to involvement of larger bone movement. This problem was later solved, as demonstrated by Ren et al.,[14] who added bone grafting
immediately after performing a high Le Fort I osteotomy in cleft patients with secondary MDs.
Patients with an MD with a low malar prominence tend to have a gaunt or hollow midface, leading to a perpetually tired, worn out, older, and sad appearance.[23,24]
Although a high Le Fort I osteotomy and distraction procedure has been used for maxillary advancement in the past, transverse distraction with a high Le Fort I osteotomy design including the malar bones has not been reported before for the treatment of maxillary and malar bone deficiencies.[13,14] Malar bone deficiencies
are often reconstructed with facial onlay augmentation techniques to improve the facial appearance,[25,26]
because autogenous bone grafts demonstrate significant resorption over time.[27]
d
IscussIonPowell et al.[16] demonstrated that the height of the malar
contour vertically was just at or below the Frankfort horizontal plane. Then the malar eminence was divided into anteromedial and posterolateral segments by drawing (i) a vertical line passing through the lateral canthus; (ii) a vertical line passing through the soft tissue nasion and pronasale, thus bisecting the midnasal line; (iii) a diagonal line from the ala to the lateral canthus; (iv) a line parallel to the earlier third line, running through the commissure; and finally (v) the horizontal Frankfort plane. This classification is significant because it defines the types of malar deficiency. Malar defects may be categorized as anteromedial, posterolateral, or a combination of both. However, we needed to develop our own analysis technique and measurable planes, because previous studies and cases have not evaluated the malar complex in three dimensions.
Nkenke et al.[17] observed that maxillary advancement
resulted in a more pronounced shifting of the soft tissues in the malar midfacial area than the upper lip. This was further supported by McCance et al.,[18] who
reported similar changes in their study of changes in bone following orthognathic surgery. Past studies have shown that SARME causes forward movement of the maxilla due to the buttress effect.[3,19-22] Based
on this evidence, a high Le Fort I SARME might be considered beneficial for maxillary retrognathia patients, particularly because it has the potential to improve a malar deficiency. The use of minor modifications of routine surgical procedures in conventional orthognathic surgery can improve aesthetic results in patients with midfacial hypoplasia.[13] A high Le Fort I SARME
Figure 10: (a) A 3D frontal, oblique, inferio-axial, and sagittal view of a new soft tissue region created to measure anteroposterior changes in the malar
region. (b) Measurements made in the limit of the latero-inferior border plane of the new soft tissue region that had developed, as seen from the 3D sagittal view. Changes in bone malar depth (BMD) and soft tissue malar depth (SMD) were measured in this manner.
the malar bones; they also claimed that this progress decreased medially to laterally. Our study has similarities with previous studies in that we did not detect any significant increases in average BMW or SMW (0.29 and 0.18 mm, respectively), BMD (1.34 mm on the right, 1.60 mm on the left), or SMD (0.95 mm on the right, 0.76 mm on the left) in the conventional Le Fort I group. Moreover, BMD progress did not reflect SMD in our 3D analyses.
Baik and Kim[34] studied maxillary advancement in class
III orthognathic surgery patients and performed 3D soft tissue analyses. They reported more progress in the midfacial region of the face than the lateral region. In the present high Le Fort I cases, we found that both BMW and BMD were higher postoperatively than preoperatively. We gained 6.71 mm of average palatal expansion in the high Le Fort I group and 5.73 mm in the conventional group. Patients who gain maxillary advancement ≥4.0 mm experience a larger increase in the greatest interalar width than those with maxillary advancements <4.0 mm.[32] We
did not detect any statistically significant differences between total palatal expansion in the groups, so we suggest that the amount of expansion produced by the appliance was standardized. Otherwise, a nonstandardized expansion could create problems because one surgical group might have received more expansion than the other and biased the results. Comparison of the 6.71 mm expansion in the high Le Fort I group with the BMW (1.43 mm) and BMD (right 1.34 mm, left 1.60 mm) values showed no direct effect and indicated poor improvement in the augmentation target area. In addition, this poor reflection of hard tissue changes by the soft tissues in terms of malar depth makes the procedure questionable in terms of effort versus benefit.
In the cases described, we found that both BMW and BMD were higher postoperatively than preoperatively in the high Le Fort I group. An SARME with a high Le Fort I osteotomy design, including the malar bones, can be beneficial for malar deficiency treatment with a high degree of expansion, while correcting transverse maxillary problems. Further clinical studies with more patients are needed to fully evaluate the clinical outcomes of this technique.
The resulting increases in BMW and SMW in the high Le Fort I group were statistically significantly higher than in the conventional group. The resulting hard tissue malar anteroposterior progress in the high Le Fort I group was also statistically significantly higher. However, progress in hard tissues did not reflect significant changes in soft tissue. A greater degree of expansion could lead to better malar progress.
There are many limitations when using traditional 2D radiography to evaluate the dentomaxillary complex, such as the superimposition of lateral and midline anatomical structures. With the decreased ionizing radiation and increasing popularity of CBCT, the opportunity exists for orthodontists and other researchers to evaluate changes resulting from SARME on the maxillary complex in a living person, unlike previous studies that have relied on computer models. In addition, 3D imaging allows the evaluation of the craniofacial complex at various levels without the superimposition of structures that occurs with traditional 2D radiography.[28] Moreover, manual
superimposition using computers may result in errors; Grybauskas et al.[29] mentioned that measurements with
manual superimposition caused errors up to 0.4 mm, although half of those were less than 0.3 mm.
Other studies have suggested that a high Le Fort I level osteotomy not only provides maxillary advance but also advances regions of the lateral region and floor of the nose and partial infraorbital region of the face.[14,30]
Kim et al.[31] investigated changes in midfacial soft
tissue after advancement of the maxilla with high Le Fort I osteotomy and mandibular set back surgery and found that changes in soft tissue were concentrated just below the infraorbital foramen. The distribution of the affected soft tissue after the high Le Fort I osteotomy was within the rectangular malar region between the two infraorbital foramens and the upper lip. They claimed that conventional and high Le Fort I osteotomies induced an overall hard to soft tissue response in the midfacial area, but Ryckman et al.[32] noted that facial soft tissues
appeared to respond more to the anterior movement of the jaws than to an increase in transverse dimensions after maxillomandibular advancements. In contrast to Ryckman, we found that facial soft tissues appeared to respond more to transverse movement of the jaws than to an increase in saggital dimensions.
In our study, the average increases in BMW and SMW were 1.43 and 1.39 mm in the high Le Fort I group and 0.29 and 0.18 mm in the conventional group, respectively. Changes in BMW seemed to be reflected by the soft tissue, in that SMW values also showed a statistically significant increase in the high Le Fort I group. The increases in both the right (1.34 mm) and left BMD (1.60 mm) were significant, but changes in the soft tissue in both right (0.95 mm) and left SMD (0.76 mm) were less than expected and not significant. The reason for this may be nutritional deficiencies caused by the hyrax device and associated weight loss.
Ramieri et al.[33] examined changes in soft tissue in
transverse palatal distraction patients, and reported 1-3 mm of progress in the paranasal region but not in
17. Nkenke E, Vairaktaris E, Kramer M, Schlegel A, Holst A, Hirschfelder U, et al. Three dimensional analysis of the malar mid-facial region after Le Fort I osteotomy and maxillary advancement. Oral Maxillofacial Surg 2008;12:5-12.
18. McCance AM, Moss JP, Fright WR. A three-dimensional analysis of bone and movements in 17 skeletal II patients following orthognathic surgery. Eur J Orthod 1993;15:97-106.
19. Biederman W. Rapid correction of Class III maolocclusion by midpalatal expansion. Am J Orthod 1973;63:47-55.
20. Goddard R, Witherow H. Surgically assisted rapid palatal expansion (SARPE). Br J Oral Maxillofac Surg 2011;49:65-6. 21. Parhiz A, Schepers S, Lambrichts I, Vrielinck L, Sun Y, Politis
C. Lateral cephalometric changes after SARME. Int J Oral Maxillofac Surg 2011;40:662-71.
22. Stromberg C, Holm J. Surgically assisted rapid maxillary expansion in adults. A retrospective long-term follow-up study. J Cranio-Maxillofac Surg 1995;23:222-7.
23. Terino EO, Flowers RS. The art of alloplastic facial contouring. 2000;1st6-11.St Louis, MO: Mosby.
24. Bell WH. Modern practice in orthognathic reconstructive surgery. 1992;2:PhiladelphiaPA: WB Saunders21-25.
25. Terino EO. Alloplastic midface augmentation. Aesthet Surg J 2005;25:512-20.
26. Terino EO, Edwards MC. Alloplastic contouring for suborbital, maxillary, zygomatic deficiencies. Facial Plast Surg Clin North Am 2008;16:33-67.
27. Maas CS, Merwin GE, Wilson J, Frey MD, Maves MD. Comparison of biomaterials for facial bone augmentation. Arch Otolaryngol Head Neck Surg 1990;116:551-6.
28. Laudemann K, Petruchin O, Mack MG, Kopp S, Sader R, Landes CA. Evaluation of surgically assisted rapid maxillary expansion with or without pterygomaxillary disjunction based upon preoperative and post-expansion 3D computed tomography data. Oral Maxillofac Surg 2009;13:159-69.
29. Grybauskas S, Locs J, Salma I, Salms G, Berzina-Cimdina L. Volumetric analysis of implanted biphasic calcium phosphate/ collagen composite by three-dimensional cone beam computed tomography head model superimposition. J Craniomaxillofac Surg 2015;43:167-74.
30. Tay YC, Tan KH, Yeow VK. High Le Fort I and bilateral saggital split osteotomy in Crouzon syndrome. J Craniofac Surg 2013;24:253-5.
31. Kim YI, Park SB, Son WS, Hwang DS. Midfacial tissue changes after advancement of maxilla with Le Fort I osteotomy and mandibular set back surgery: Comparison of conventional and high Le Fort osteotomies by superimposition of cone beam computed tomography volumes. J Oral Maxillofac Surg 2011;69:225-33.
32. Ryckman MS, Harrison S, Oliver D, Sander C, Boryor AA, Hohmann AA, et al. Soft-tissue changes after maxillomandibular advancement surgery assessed with cone-beam computed tomography. Am J Orthod Dentofacial Orthop 2010;137:86-93. 33. Ramieri GA, Nasi A, Dell’Acqua A, Verze L. Facial soft tissue
changes after transverse palatal distraction in adult patients. Int J Oral Maxillofac Surg 2008;37:810-8.
34. Baik HS, Kim SY. Facial soft tissue changes in skeletal Class III orthognathic surgery patients analyzed with 3-dimensional laser scanning. Am J Orthod Dentofacial Orthop 2010;138:167-78. Financial support and sponsorship
Nil
Conflicts of interest
There are no conflicts of interest
r
eFerences1. Kilic E, Kilic B, Kurt G, Sakin C, Alkan A. Effects of surgically assisted rapid palatal expansion with and without pterygomaxillary disjunction on dental and skeletal structures: A retrospective review. Oral Surg Oral Ned Oral Pathol Oral Radiol 2013;115:167-74.
2. Betts NJ, Ziccardi VB. Surgically assisted maxillary expansion. 2000;211-31.In: Fonseca RJ editor. Oral maxillofacial surgery orthognathic surgery Volume 2. Philadelphia PA: WB Saunders. 3. Haas AJ. Rapid expansion of the maxillary dental arch and
nasal cavity by opening the midpalatal suture. Angle Orthod 1961;31:73-90.
4. Haas AJ. The treatment of maxillary deficiency by opening the midpalatal suture. Angle Orthod 1965;35:200-17.
5. Meneghini F. Clinical facial analysis. Berlin Heidelberg: Springer-Verlag 2005;46.
6. Prendergast M, Schoenrock LD. Malar augmentation (patient classification and placement). Arch Otolaryngol Head Neck Surg 1989;115:964-9.
7. Hinderer UT. Malar implants for the improvement of facial appearance. Plast Reconstr Surg 1975;56:157-65.
8. Suri L, Taneja P. Surgically assisted rapid palatal expansion: A literature review. Am J Orthod Dentofac Orthop 2008;133: 290-302.
9. Jr Namara JA, Baccetti T, Franchi L, Herberger TA. Rapid maxillary expansion followed by fixed appliances: A long-term evaluation of changes in arch dimensions. Angle Orthod 2003;73:344-53.
10. Wertz RA. Skeletal and dental changes accompanying rapid midpalatal suture opening. Am J Orthod 1970;58:41-66.
11. Lagravere MO, Major PW, Flores-Mir C, Orth C. Long-term dental arch changes after rapid maxillary expansion treatment: A systematic review. Angle Orthod 2005;75:151-7.
12. Anttila A, Finne K, Keski-Nisula K, Somppi M, Panula K, Peltoma T. Feasibility and long-term stability of surgically assisted rapid maxillary expansion with lateral osteotomy. Eur J Orthod 2004;26:391-5.
13. Norholt SE, Sindet-Pedersen S, Jensen J. An extended Le Fort I osteotomy for correction of midface hypoplasia: A modified technique and results in 35 patients. J Oral Maxillofac Surg 1996;54:1297-304.
14. Ren M, Teng L, Ding B. High level Le Fort I osteotomy and bone grafting for correction of secondary mid-face deformities in cleft patients. Zhongguo Xiu Fu Chong Jian Wai Ke Za Zhi 2006;20:526-9.
15. Dergin G, Aktop P, Biren S, Aktop S. Sliding malar bone augmentation technique with a high Le Fort I surgically assisted rapid maxillary expansion. Niger J Clin Pract 2017;20:498-502. 16. Powell NB, Riley RW, Lamb DR. A new approach to evaluation
and surgery of the malar complex. Ann Plast Surg 1988;20:206-21.