˙IL A Y D A NAZ L I T HE E FFE C T O F O R IE NT A T IO N-R E L A T E D P R IO R P R O B AB IL IT Y INF O R M A T IO N O N C O NT R AS T P E R C E P T IO N B ilk en t Un iv er sit y 20 19
THE EFFECT OF ORIENTATION-RELATED PRIOR PROBABILITY INFORMATION ON CONTRAST PERCEPTION
A Master’s Thesis
by
˙ILAYDA NAZLI
The department of Psychology ˙Ihsan Do˘gramaci Bilkent University
Ankara July 2019
THE EFFECT OF ORIENTATION-RELATED PRIOR PROBABILITY INFORMATION ON CONTRAST PERCEPTION
The Graduate School of Economics and Social Sciences of
˙Ihsan Do˘gramacı Bilkent University
by
˙ILAYDA NAZLI
In Partial Fulfillment of the Requirements for the Degree of MASTER OF ART IN PSYCHOLOGY
THE DEPARTMENT OF PSYCHOLOGY
˙IHSAN DO ˘GRAMACI B˙ILKENT UNIVERSITY ANKARA
ABSTRACT
THE EFFECT OF ORIENTATION-RELATED PRIOR PROBABILITY INFORMATION ON CONTRAST PERCEPTION
Nazlı, ˙Ilayda M.A. in Psychology
Supervisor: Assoc. Prof. Dr. H¨useyin Boyacı July 2019
It is known that visual perception is the product of sensory input and prior probabil-ity information. Previous studies support well that expectation influence recognition and decision-making; however, we have limited knowledge about how expectation in-fluences low level visual processing. In the current study, we examine the e↵ect of expectation on early visual processing. That is, we provide task-irrelevant expecta-tion cue related to the orientaexpecta-tion of target Gabor grating, and we ask participants to indicate the spatial location of target grating while systematically manipulating its contrast level. In addition, we examine how di↵erent expectation validities (i.e. 75%, 50%, 100%) and neutral expectation cue a↵ect visual perception. In Experiment 1, where the orientation of expectation cue and target gratings are vertical or horizontal, contrast threshold is lower in congruent trials at 75% validity condition. In Experi-ment 2, where the orientation of cue grating implies specific range (i.e. ±15 around 0 or 90 ) yet the orientation of target grating is informed as any of 360 , the contrast threshold is lower at congruent trials compared to incongruent trials when the valid-ity of cue is 75% and 50%; and also, the contrast threshold is lower at 100% validvalid-ity condition compared to neutral condition. In Experiment 3A, where the orientation of expectation cue and target Gabor grating are within a specific range (i.e. ±15 around 0 or 90 ), contrast threshold is lower in congruent trials at 75% and 50% validity condition. In Experiment 3B, where the orientation of expectation cue and
target Gabor grating are within wider range (i.e. ±30 around 0 or 90 ), contrast threshold is lower in congruent trials at 75% validity condition.
¨ OZET
ORYANTASYONA Y ¨ONEL˙IK ¨ON OLASILIK B˙ILG˙IS˙IN˙IN KONTRAST ALGISI ¨
UZER˙INDEK˙I ETK˙IS˙I
Nazlı, ˙Ilayda Y¨uksek Lisans, Psikoloji
Tez Danı¸smanı: Do¸c. Dr. H¨useyin Boyacı Temmuz 2019
G¨orsel algının duyusal girdi ve ¨on olasılık bilgilerinin bir ¨ur¨un¨u oldu˘gu bilinmektedir. ¨
Onceki ¸calı¸smalar, beklentinin fark etmeyi ve karar vermeyi etkiledi˘gini iyi bir ¸sekilde kanıtlamaktadır; ancak, beklentinin d¨u¸s¨uk seviyeli g¨orsel i¸slemeyi nasıl etkiledi˘gi hakkında sınırlı bilgimiz var. Bu ¸calı¸smada, beklentinin erken g¨orsel i¸sleme ¨uzerindeki etkisini inceliyoruz. Hedef Gabor ızgarasının oryantasyonu ile ilgili olan fakat deney-sel g¨orevle ilgili olmayan beklenti ipucu veriyoruz ve katılımcılardan hedef uyaranın mekansal konumunu belirlemelerini istiyoruz ve aynı zamanda hedef uyaranın kontrast seviyesini sistematik olarak de˘gi¸stiriyoruz. Ayrıca farklı ge¸cerlilik y¨uzdelerine sahip olan beklenti ipucunun (75%, 50%, 100%) ve n¨otr ipucunun g¨orsel algı ¨uzerindeki etkisini inceliyoruz. Beklenti ipucunun ve hedef Gabor ızgaralarının oryantasyonunun dikey veya yatay oldu˘gu Deney 1’de, 75% ge¸cerlilik y¨uzdesinde uyumlu testlerde kon-trast e¸si˘gi daha d¨u¸s¨uk olmaktadır.Beklenti ipucu ızgarasının oryantasyonunun belli bir aralıkta (i.e. 0 or 90 ¸cevresinde ±15 ) oldu˘gu fakat hedef Gabor ızgarasının oryan-tasyonunun 360 ’den herhangi birisi oldu˘gu bilgisinin verildi˘gi Deney 2’de, beklenti ipucunun ge¸cerlilik y¨uzdesi 75% ve 50% oldu˘gu ko¸sullarda, kontrast e¸si˘gi uyumlu testlerde uyumsuzlara g¨ore daha d¨u¸s¨uk ¸cıkmaktadır, ve ayrıca kontrast e¸si˘gi 100% ge¸cerlilik ko¸sulunda n¨otr ko¸sula g¨ore daha d¨u¸s¨uk ¸cıkmaktadır.Beklenti ipucunun ve hedef Gabor ızgaralarının oryantasyonunun belli bir aralıkta (i.e. 0 or 90 ¸cevresinde ±15 ) oldu˘gu Deney 3A’da, beklenti ipucunun ge¸cerlilik y¨uzdesi 75% ve 50% oldu˘gu
ko¸sullarda, kontrast e¸si˘gi uyumlu testlerde daha d¨u¸s¨uk ¸cıkmaktadır. Beklenti ipucu-nun ve hedef Gabor ızgaralarının oryantasyoipucu-nunun belli ve daha geni¸s bir aralıkta (i.e. 0 or 90 ¸cevresinde ±30 ) oldu˘gu Deney 3B’de, 75% ge¸cerlilik y¨uzdesinde uyumlu testlerde kontrast e¸si˘gi daha d¨u¸s¨uk olmaktadır.
ACKNOWLEDGEMENT
First and foremost, I would like to express my deepest gratitude to Assoc. Prof. Dr. H¨useyin Boyacı for his valuable advice, guidance and support. It has been a big opportunity for me to work with him and to learn from him.
I would like to thank Asst. Prof. Dr. Hulusi Kafalıg¨on¨ul for his support and help. I am grateful to Buse Merve ¨Urgen for her support, help and comments. I would like to thank my friends in UMRAM for their friendship and support.
I owe special thanks to my family for their endless love, help, support, encouragement, patience.
I want to acknowledge that The Scientific and Technological Research Council of Turkey (T ¨UB˙ITAK) supported me through B˙IDEB 2210-A scholarship.
TABLE OF CONTENTS
ABSTRACT . . . iv ¨ OZET . . . vi ACKNOWLEDGEMENT . . . vii TABLE OF CONTENTS . . . ixLIST OF TABLES . . . xii
LIST OF FIGURES . . . xiii
CHAPTER 1: INTRODUCTION . . . 1
1.1 Sensation and Perception . . . 1
1.2 Expectation in Visual Perception . . . 2
1.3 The Behavioral E↵ects of Expectation . . . 5
1.4 The Neural E↵ects of Expectation . . . 7
1.5 Models of Expectation . . . 9
1.6 Comparing Expectation and Attention . . . 12
1.7 The Scope of the Current Study . . . 13
CHAPTER 2: EXPERIMENT 1 . . . 16
2.1 Method . . . 16
2.1.1 Participants . . . 16
2.1.2 Stimuli and Apparatus . . . 17
2.1.3 Design . . . 18 2.2 Results . . . 22 2.3 Intermediate Discussion . . . 22 CHAPTER 3: EXPERIMENT 2 . . . 26 3.1 Method . . . 26 3.1.1 Participants . . . 26 3.1.2 Design . . . 27 3.2 Results . . . 27 3.3 Intermediate Discussion . . . 32 CHAPTER 4: EXPERIMENT 3 . . . 34 4.1 Experiment 3A . . . 34 4.1.1 Method . . . 35
4.1.2 Results . . . 35 4.1.3 Intermediate Discussion . . . 40 4.2 Experiment 3B . . . 40 4.2.1 Method . . . 41 4.2.2 Results . . . 41 4.2.3 Intermediate Discussion . . . 44
CHAPTER 5: GENERAL DISCUSSION . . . 48
REFERENCES . . . 57
APPENDICES . . . 61
A PSYCHOMETRIC FUNCTIONS IN EXPERIMENT 1 . . . 61
B PSYCHOMETRIC FUNCTIONS IN EXPERIMENT 2 . . . 68
C PSYCHOMETRIC FUNCTIONS IN EXPERIMENT 3A . . . 75
LIST OF TABLES
2.1 Result of Experiment 1 . . . 23
2.2 Pairwise Comparison in Experiment 1 . . . 24
3.1 Result of Experiment 2 . . . 31
3.2 Pairwise Comparison in Experiment 2 . . . 32
4.1 Result of Experiment 3A . . . 38
4.2 Pairwise Comparison in Experiment 3A . . . 39
4.3 Result of Experiment 3B . . . 44
LIST OF FIGURES
1.1 The context e↵ect . . . 3
1.2 The context e↵ect . . . 4
1.3 The context e↵ect . . . 4
1.4 Two competing views of expectation suppression . . . 8
1.5 Predictive coding . . . 11
2.1 Design of Experiment 1 . . . 19
2.2 Psychometric Function of Subject 1 in Experiment 1 . . . 23
2.3 Mean contrast threshold data in Experiment 1 . . . 24
3.1 Gabor Orientation Intervals in Experiment 2 . . . 28
3.2 Design of Experiment 2 . . . 29
3.3 Psychometric Function of Subject 1 in Experiment 2 . . . 30
4.1 Gabor Orientation Intervals in Experiment 3A . . . 36
4.2 Design of Experiment 3A . . . 37
4.3 Psychometric Function of Subject 1 in Experiment 3A . . . 38
4.4 Mean contrast threshold data in Experiment 3A . . . 39
4.5 Gabor Orientation Intervals in Experiment 3B . . . 42
4.6 Design of Experiment 3B . . . 43
4.7 Psychometric Function of Subject 1 in Experiment 3B . . . 44
4.8 Mean contrast threshold data in Experiment 3B . . . 45
A.1 Psychometric Function of Subject 1 in Experiment 1 . . . 62
A.2 Psychometric Function of Subject 2 in Experiment 1 . . . 63
A.3 Psychometric Function of Subject 3 in Experiment 1 . . . 64
A.4 Psychometric Function of Subject 4 in Experiment 1 . . . 65
A.5 Psychometric Function of Subject 5 in Experiment 1 . . . 66
A.6 Psychometric Function of Subject 6 in Experiment 1 . . . 67
B.1 Psychometric Function of Subject 1 in Experiment 2 . . . 69
B.2 Psychometric Function of Subject 2 in Experiment 2 . . . 70
B.4 Psychometric Function of Subject 4 in Experiment 2 . . . 72
B.5 Psychometric Function of Subject 5 in Experiment 2 . . . 73
B.6 Psychometric Function of Subject 6 in Experiment 2 . . . 74
C.1 Psychometric Function of Subject 1 in Experiment 3A . . . 76
C.2 Psychometric Function of Subject 2 in Experiment 3A . . . 77
C.3 Psychometric Function of Subject 3 in Experiment 3A . . . 78
C.4 Psychometric Function of Subject 4 in Experiment 3A . . . 79
C.5 Psychometric Function of Subject 5 in Experiment 3A . . . 80
C.6 Psychometric Function of Subject 6 in Experiment 3A . . . 81
D.1 Psychometric Function of Subject 1 in Experiment 3B . . . 83
D.2 Psychometric Function of Subject 2 in Experiment 3B . . . 84
D.3 Psychometric Function of Subject 3 in Experiment 3B . . . 85
D.4 Psychometric Function of Subject 4 in Experiment 3B . . . 86
D.5 Psychometric Function of Subject 5 in Experiment 3B . . . 87
CHAPTER 1
INTRODUCTION
1.1. Sensation and Perception
One of the di↵erences between sensation and perception is that the former is influ-enced by previous experiences and knowledge for the interpretation of visual stimuli (Matlin, 2014). That is, the combination of bottom-up and top-down processes is required for visual perception because the registration of the physical property of visual stimuli is influenced by previous experiences and knowledge. In addition, these previous experiences and knowledge make object recognition faster. Furthermore, hu-man cognition has limited capacity to process every sensory stimuli (Tsotsos, 1997). Therefore, we need to efficiently use this limited capacity to interpret the sensory environment, and this efficient use is supported by prior experiences and knowledge.
As stated above, high level mechanisms are required for visual perception. One of the most well-known high-level mechanisms is attention. Attention determines how we prioritize visual processing or how we weight visual stimuli based on our goal or task (Maunsell & Treue, 2006; Tsotsos, 1997). Therefore, attention enables us to process behaviorally-relevant visual stimuli more efficiently (Maunsell & Treue, 2006), and also; to efficiently use our limited brain capacity (i.e. selective attention)
(Tsotsos, 1997). Expectation gives us the prior knowledge about what is the probable or possible input in the upcoming sensory environment, and this prior knowledge helps us to interpret visual input by enhancing perception (Summerfield & Egner, 2009). There is still not a very clear and consistent distinction between the two concepts, but it is usually called attention when it is directly related to the task, and expectation, when it is about probabilistic distribution of events not necessarily directly related to the task.
1.2. Expectation in Visual Perception
In sensory environment, visual inputs contain constant parts; as a result, visual in-formation are acquired based on previous experiences (Summerfield & Egner, 2009; Summerfield & De Lange, 2014; de Lange, Heilbron, & Kok, 2018). For example, while editing text using a computer keyboard with a familiar layout, we do not need to look at letters on the keyboard. In other words, the spatial location of letters in the keyboard is stable and we have prior knowledge about their locations; therefore, we do not need to process their locations deeply and repeatedly compared to the first time that we encounter them. In addition, sensory stimuli have a stereotypical property; that is, prior experience enables to form associations between stimuli which leads to expectation (O’Callaghan, Kveraga, Shine, Adams Jr, & Bar, 2017; Summerfield & De Lange, 2014; de Lange et al., 2018). For example, when you hear an engine sound, you head towards sidewalk directly due to the expectation of the approach of a car. Therefore, if sensory stimuli conform our expectations and previous experiences, they are not required to be processed deeply at each time (Summerfield & Egner, 2009).
Moreover, visual inputs are ambiguous which prevents us to arrive at a single in-terpretation of a stimulus identity, and prior experience/knowledge and expectation enhance the interpretation of visual information (Heeger, 2017; Summerfield & Eg-ner, 2009; de Lange et al., 2018). In addition, contextual information which is based
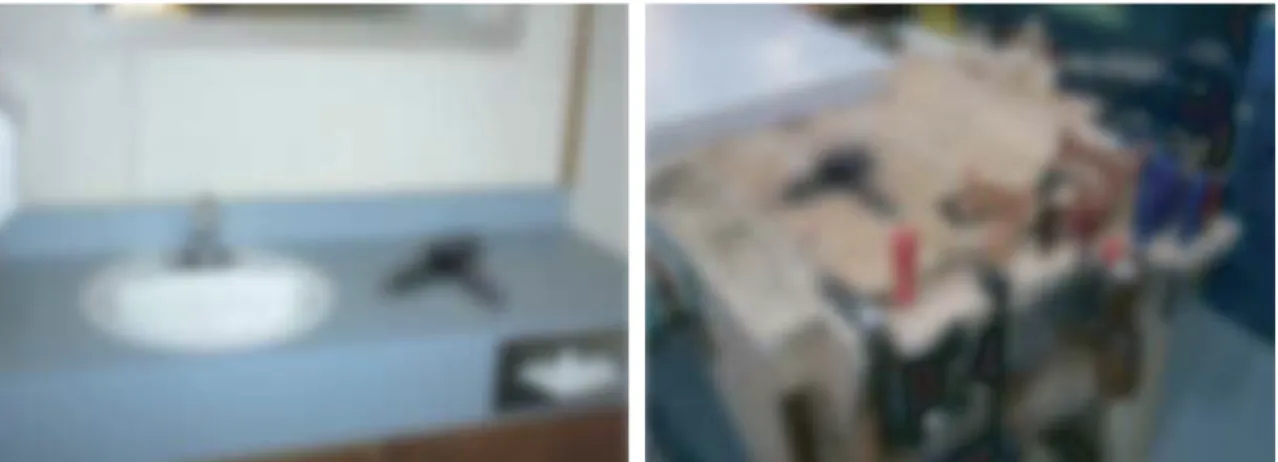
Figure 1.1: The context e↵ect. Contextual information enables to interpret the iden-tity of the physically same object as a hairdryer or a drill in an ambiguity. Reprinted with permission from (Bar, 2004).
on prior experiences guides the stimulus interpretation (Bar, 2004). That is, the in-terpretation of the same object is changed based on the context which has role in expectation formation. For example, the physically-similar objects in an ambiguous visual environment can be perceived as either a hairdryer or a drill based on con-textual information (see Figure 1.1). Figure 1.2 shows another example, where the middle symbols are the same, what determines whether it is a letter or a number is its contextual information. Also, the middle letters in Figure 1.3 may be recognized as either letter H or letter A, and what helps us to read the words is contextual information and prior experiences.
As opposed to its facilitative role in the interpretation of visual information, expecta-tion may also misguide the interpretaexpecta-tion. That is, when a visual input is ambiguous and expectation is strong and wrong, false perception occurs (Kr´ol & El-Deredy, 2011; Summerfield, Egner, Mangels, & Hirsch, 2005), and this e↵ect is especially high for the stimulus with high ambiguity (Kr´ol & El-Deredy, 2011) due to the stronger modulation of expectation (de Lange et al., 2018). In addition, the balance between sensory input and expectation is important, that is, giving more weight to expecta-tion than sensory input can lead to hallucinaexpecta-tion (Adams, Stephan, Brown, Frith, &
Figure 1.2: The context e↵ect. The perception of the same symbol in the middle is influenced by surrounding symbols which determine contextual information.
Figure 1.3: The context e↵ect. The recognition of the middle letter depends on contextual information.
Friston, 2013; O’Callaghan, Hall, et al., 2017). Moreover, hallucination can occur as a result of top-down expectation when bottom-up sensory input is absent (Grossberg, 2000).
Most of the examples given above show the e↵ect of expectation on a single sensory modality. For instance, the perception of middle symbol is based on surrounding visual cues in Figure 1.2; that is, at the top of this figure, we perceive the symbol in middle as ”13” because of our prior statistical regularity knowledge about the order of numbers or letters. Such regularities occur not only within a single sensory modality but also between di↵erent sensory modalities (de Lange et al., 2018). The conditioning example about an engine sound given above is a cross-modal example. That is, when we hear an engine sound, we expect to see a car instead of a dog.
Briefly, as stated above, expectation facilitates the interpretation of the ambiguous stimulus, and it leads more efficient, faster and more accurate stimulus detection. And, there is no need to deeply process the stimulus that conforms previous experi-ences. Conversely, an unexpected stimulus requires further computational processing and more evidence accumulation to be perceived (De Loof, Van Opstal, & Verguts, 2016; Urgen & Boyaci, 2019). Therefore, as stated by Summerfield and Egner (2009), having prior information about the next possible sensory environment or expecta-tion decreases the computaexpecta-tional burden or consumed resources required for visual perception.
1.3. The Behavioral E↵ects of Expectation
It is found that expectation leads to behavioral benefits; that is, prior probability information facilitates response speed or reaction time, response accuracy and per-ceptual performance. Valid expectation cue reduces reaction time in the orientation discrimination task (Kok, Failing, & de Lange, 2014), the discrimination of an intact target stimuli from distorted ones (Puri & Wojciulik, 2008; Schwiedrzik & Freiwald,
2017), the identification of a target stimuli location (De Loof et al., 2016; Urgen & Boyaci, 2019), the yes/no tasks (Kr´ol & El-Deredy, 2011; Summerfield & Koech-lin, 2008) and the perceptual estimation task (Jabar & Anderson, 2017), and valid cue increases response accuracy (Alink, Schwiedrzik, Kohler, Singer, & Muckli, 2010; Cheadle, Egner, Wyart, Wu, & Summerfield, 2015; Jabar & Anderson, 2017; Kr´ol & El-Deredy, 2011; Schwiedrzik & Freiwald, 2017). Also, these benefits are observable in stimuli that are intact (Kok et al., 2014; Jabar & Anderson, 2017; Urgen & Boy-aci, 2019), degraded (Kr´ol & El-Deredy, 2011) or embedded in noise (De Loof et al., 2016; Kr´ol & El-Deredy, 2011; Schwiedrzik & Freiwald, 2017; Summerfield & Koech-lin, 2008) and stimuli that are simple such as Gabor grating (Jabar & Anderson, 2017; Kok et al., 2014; Summerfield & Koechlin, 2008) and complex such as face, house or objects (De Loof et al., 2016; Kr´ol & El-Deredy, 2011; Puri & Wojciulik, 2008; Schwiedrzik & Freiwald, 2017; Urgen & Boyaci, 2019). Moreover, Puri and Wojciulik (2008) found the specificity of expectation cue has an e↵ect on reaction time. That is, the discrimination of an intact face/house from a distorted face/house is slower following an incorrect exemplar and a correct category cues than following a correct exemplar and a category cues; therefore, the correctness of not only the category but also the exemplar determine whether expectation produces a performance benefit or cost. In addition to the identification task mostly used in the literature, De Loof et al. (2016) examined the e↵ect of prior probability information with the individuation task which is important to understand the relationship between prior predictive infor-mation and visual awareness. And, they found that participants are slower to detect the spatial location of the target stimulus, when they are cued incongruently com-pared to congruent or neutral feature-related expectation cues. Furthermore, in the study of Kok et. al. (2012), an adaptive staircase procedure was applied to manipu-late the orientation and contrast di↵erence between gratings presented consecutively. While expectation resulted in a smaller value for the discrimination of the orientation di↵erence, it did not have any significant e↵ect on the contrast discrimination. And,
in the similar individuation study of Urgen and Boyacı (2019), the temporal dura-tion of the stimulus presentadura-tion was manipulated by an adaptive staircase, and they found higher temporal threshold following an incongruent expectation cue in terms of detecting the stimulus location.
1.4. The Neural E↵ects of Expectation
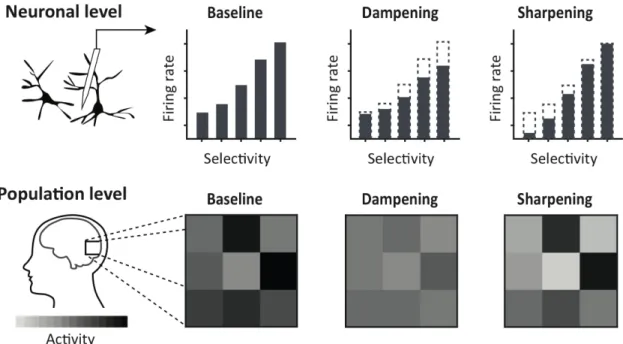
Despite of its facilitative role in the processing of visual stimuli, it is found that an expected stimuli lead to decreased neural response, and this is called expectation suppression (Summerfield & De Lange, 2014; Summerfield & Egner, 2009; de Lange et al., 2018). This pattern is supported by several studies including the discrimination of an intact target stimuli from a distorted one (Schwiedrzik & Freiwald, 2017), the discrimination of the gratings’ orientation (Kok, Jehee, & De Lange, 2012), the motion detection of the stimulus with a predicted onset and with a predicted motion direction (Alink et al., 2010). Two di↵erent competing views explain this neural suppression e↵ect of expectation: dampening vs. sharpening account (de Lange et al., 2018) (see Figure 1.4). According to the dampening account, the activation of neurons that are highly selective for an expected stimulus decreases following the expected stimulus observation which leads to expectation suppression (Rao & Ballard, 1999; de Lange et al., 2018). Conversely, according to the sharpening view, neurons not responding to an expected stimulus are suppressed and neurons responding to an expected stimulus are enhanced following the expected stimulus observation; thus, more selective population response leads to expectation suppression (Lee & Mumford, 2003; de Lange et al., 2018). In the orientation discrimination task of Kok et. al. (2012), an expected stimulus suppressed neural activity in V1, V2 and V3; however, MVPA orientation classification accuracy was higher for expected orientation only in V1. In other words, despite of the reduction in neural activity in V1, expectation facilitates the orientation information. Therefore, the facilitative role of expectation in the interpretation of visual stimuli is supported by the fact that expectation sharpens the early sensory
Figure 1.4: Two competing views of expectation suppression. According to the damp-ening account of expectation suppression, neurons that are highly selective for an expected stimulus are mostly activated by the observation of that stimulus, and their activation responses decrease. This causes lower contrast for the activation pattern at the population level. According to the sharpening account of expectation suppres-sion, neurons that are less selective for an expected stimulus are mostly a↵ected by its observation, and their activation responses are lower than that of neurons highly tuned to an expected stimulus. This causes higher contrast di↵erences in the activa-tion pattern at the populaactiva-tion level. Reprinted with permission from (de Lange et al., 2018).
representations. And, this expectation suppression can be interpreted as a decrease in the computational burden of visual perception.
Expectation influences neural responses to visual stimuli; thus, determines how to interpret visual inputs (Summerfield & De Lange, 2014; Egner, Monti, & Summer-field, 2010). In a study, Egner, Monti and Summerfield (2010) presented colored frames as prior low, medium or high probability information indicating whether the upcoming stimulus was a face or a house. The authors found that fusiform face area (FFA) activation was higher for faces than houses at low and medium expectation
levels; however, FFA activation was identical for faces and houses following a high face expectation cue. Furthermore, this identical FFA activation e↵ect was more prominent as the strength of probability information increased (i.e. from low to high level). Therefore, this finding may be interpreted as a support for the fact that strong expectation causes misperception despite the di↵erent bottom-up sensory input.
Furthermore, it has been stated that before the presentation of an actual stimulus, expectation leads to the preactivation of the stimulus template. In a recent MEG study (Kok, Mostert, & De Lange, 2017), an auditory cue providing prior information about the orientation of gratings activates orientation-specific neurons before the presentation of an actual stimulus, and the orientation-specific neural signals evoked by either an actual stimulus or an expected stimulus resembled each other. In addition to neural studies, two recent behavioral studies provide support for the influence of expectation in neural signals before the presentation of an actual stimulus. Wyart, Nobre and Summerfield (2012) found that expectation a↵ects early visual processing. That is, the baseline activity of signal-selective units was increased by expectation cue. Also, De Loof, Opstal and Verguts (2016) discussed that the shift in threshold setting may be explained with the increase in baseline activation that caused faster and error-prone responses. Therefore, the misperception due to strong expectation may also be explained with the preactivation of the stimulus template evoked by an expected stimulus.
1.5. Models of Expectation
Computational theories examining expectation states perception as a probabilistic inference process (de Lange et al., 2018). Due to a noisy and ambiguous sensory input in the environment, prior information is required to process in addition to a sensory stimulus in order for observers to reach a reliable interpretation of that stim-ulus (Summerfield & Egner, 2009; de Lange et al., 2018; Heeger, 2017). Bayesian
models provide a mathematical explanation for this process of how the combination of top-down and bottom-up properties enables observers to perceive the sensory envi-ronment. That is, a sensory input and priors or statistical regularities in the sensory environment are processed together to reach the best perceptual interpretation (de Lange et al., 2018; Yuille & Kersten, 2006). In addition to Bayesian models, pre-dictive coding theories provides more mechanistic and neural explanation for this perceptual inference process (Friston, 2005; Rao & Ballard, 1999). According to the hierarchical predictive coding models (Friston, 2005), there are two di↵erent types of neurons. Representational neurons encode expectations based on a stimulus con-text and a prior knowledge, and error neurons encode prediction errors arised from the mismatch between an observed stimulus and expectation. Sensory regions are organized hierarchically and information flows back and forward though these hier-archical levels. Expectation information flows backward to the previous layer, and prediction error flows forward to the next layer in the hierarchy. Based on prediction error, expectation is updated. At the end, when expectation and sensory information match well or when prediction error gets minimized, the perceptual interpretation of a sensory input is completed (see Figure 1.5). Furthermore, how precise sensory information is important to determine the weight of prediction error. That is, when a sensory input is not clear or precise enough to be perceivable, predictions are over-weighted and relied more so that they play more role in the perceptual interpretation; conversely, a precise sensory input leads to under-weight prediction errors so that a sensory input plays more role in the perceptual interpretation (Feldman & Friston, 2010). On the other hand, the cortical function theory of Heeger (2017) is alternative to predictive coding theory. This theory objects the existence of specific represen-tational and error neurons suggested by predictive coding theory, and it states that only feedback and feedforward information flows are enough to execute the perceptual inference process.
Figure 1.5: Predictive coding. Observed sensory stimuli and prior expectations are processed together to reach the perceptual interpretation. Sensory regions are orga-nized hierarchically which leads information to flow forward and backward. R units are representational neurons encoding expectation, and E units are error neurons which encode prediction error or the mismatch between observed and expected stim-uli. Information from R units comes from higher level regions and flows backward whereas information from E units comes from lower level regions and flows forward. At each step, R units are updated based on the mismatch information between ex-pectation and an observed stimulus via E units, and the final information product is transmitted to the previous layer. Reprinted with permission from (Summerfield & Egner, 2009).
As stated before, an unexpected stimulus observation increase neural activity or BOLD response compared to expected ones (Summerfield & Egner, 2009). According to predictive coding theory, the match and mismatch between a sensory input and expectation cause prediction error computed by representational and error neurons; in other words, when the stimulus conforming to expectation is observed, error neu-rons response low; on the opposite side, when an observed stimulus does not conform expectation, the activation of error units increase. The increase in the activation of error neurons may explain the increase in BOLD response following the presence of an unexpected stimulus observation. On the other hand, according to the corti-cal function theory (Heeger, 2017), in the presence of an unexpected stimulus, an additional feedback and feedforward information flow occurs to execute perception. This increase in the feedback and feedforward processing compared to expected ones explains the increase in BOLD response in the presence of an unexpected stimulus.
1.6. Comparing Expectation and Attention
The interaction between expectation and attention is known (Summerfield & Eg-ner, 2009). Attention influences expectation formation with its role in the stimulus-stimulus association (Chun & Turk-Browne, 2007). Similarly, expectation influences how attention is allocated. That is, it has been found that task irrelevant-regularities enhance selective attention (i.e. both spatial and feature attention) (Zhao, Al-Aidroos, & Turk-Browne, 2013). In other words, when we encounter the visual input that conforms the previously repeated experience, our attention is attracted toward that input. This explains why we pay attention to the specific location where we mostly found an object while searching for it. For example, when it is asked to find a painting, we firstly look at walls since it conforms our previous experience that paint-ings are hung on walls. In addition, both concepts aim to ease the computational burden (Summerfield & De Lange, 2014). That is, the recognition of both expected and attended stimuli is more efficient compared to unattended or unexpected ones
(Summerfield & Egner, 2009). As a result, both expectation and attention also result in the identical behavioral e↵ect. For example, it is faster to detect attended stim-uli and expected stimstim-uli. However, recent studies showed that the underlying way of this identical behavioral e↵ect resulted from expectation and attention is not identical. That is, it has been found that both valid expectation and attention cues led to easier discrimination of a signal from noise; that is, an increase in energy sensitivity, but in a distinct way (Wyart, Nobre, & Summerfield, 2012; Cheadle et al., 2015). Wyart et. al. (2012) showed that in the visual contrast detection task, attention suppressed the internal noise which enhances signal-to-noise precision whereas expectation enhances the baseline activity of signal-selective units. And also, attention-relevant energy sen-sitivity mainly occurred in signal-present stimuli whereas expectation-relevant mainly in signal-absent stimuli. Furthermore, in the orientation discrimination task (Cheadle et al., 2015), attention leads to increase in the discrimination sensitivity by enhanc-ing signal-present energy and diminishenhanc-ing signal-absent energy. On the other hand, the energy sensitivity of more informative feature was increased by valid expectation cue; that is, under the expectation of 5 clockwise tilted grating, neurons tuned to 10 clockwise orientation play important role in decision-making.
1.7. The Scope of the Current Study
The e↵ect of expectation on recognition or perceptual decision-making is well studied. In other words, studies mostly examine how prior probability information a↵ect reac-tion time and response accuracy, and they show that it facilitates response accuracy and speed as explained above. Although these studies inform us about its perceptual e↵ect, we have limited knowledge about the e↵ect of expectation on the low-level visual processing. To the best of our knowledge, the first study that examines its e↵ect on the early visual processing belongs to Kok et. al. (2012). In their study, an auditory expectation cue indicated the orientation of the following Gabor grat-ings at the beginning of each trial. Then, two consecutive gratgrat-ings were presented
while manipulating either their orientation in the orientation task, where participants were asked to indicate the rotation of the second grating (clockwise or counterclock-wise) compared to the first one, or the contrast level of gratings in the contrast task, where whether the second grating had higher or lower contrast than the first one was asked. In other words, an adaptive staircase procedure was applied to manipulate orientation and contrast threshold di↵erence between Gabor gratings presented con-secutively. And, it was found that expectation resulted in smaller angle threshold for the discrimination of the orientation di↵erence between consecutive gratings at ex-pected trials; nevertheless, there was no di↵erence between exex-pected and unexex-pected trials in terms of the contrast discrimination threshold. In this study, gratings were clearly perceivable, that is, not ambiguous. The facilitative role of expectation on ambiguous stimulus interpretation is well supported (de Lange et al., 2018; Kok et al., 2012; Kr´ol & El-Deredy, 2011; Summerfield et al., 2005; Summerfield & Egner, 2009; Summerfield & De Lange, 2014).Therefore, the absence of the contrast discrim-ination threshold between gratings cued congruently and those cued incongruently may be explained with the fact that gratings were not ambiguous to be perceived in the study of Kok et. al. (2012). The addition of noise to gratings may make the facil-itative e↵ect of expectation more prominent because an additional high noise makes the contrast of a stimulus increase to be detectable (Goris, Zaenen, & Wagemans, 2008). Thus, by adding a noise on gratings, the e↵ects of expectation on the contrast threshold may be better found.
In the current study, we examine how expectation a↵ects the early visual processing by measuring the di↵erences between the detection thresholds under the congruent and incongruent expectation conditions at the perceptual threshold level in order to fill this gap in expectation literature, and we examine the e↵ect of expectation on contrast perception to provide the comprehension for the relationship between prior probability information and a stimulus contrast. We provide task-irrelevant prior
probability information related to the orientation of Gabor grating, and we measure the lowest contrast level required for participants to detect the presence of a stimulus (i.e. contrast detection threshold) with the task of identifying the spatial location of the target grating embedded in noise. In addition, we examine how the probability of information provided by expectation cue a↵ect contrast thresholds.
CHAPTER 2
EXPERIMENT 1
In Experiment 1, we examine the influence of categorical orientation-related prior probability information (i.e. vertical or horizontal) on the detection of the spatial location of a target grating, and we specifically study the e↵ect of orientation expec-tation on contrast thresholds. We hypothesize that because the visual stimulus with low contrast level and embedded in noise is more ambiguous, providing congruent expectation information enables to perceive the stimulus with lower contrast level.
2.1. Method
2.1.1. Participants
Four males and five females with normal or corrected-to-normal vision participated in the experiment voluntarily. Their age was between 23 and 28 (M = 24.6, SD = 1.8). Seven of them were right handed, and two of them were left handed. The informed consent forms approved by the Ethics Committee of Bilkent University were distributed to participants, and their written consents were taken at the beginning of the experiment. Three participants were excluded from the study before completing four sessions and data analysis. One of them left the study without informing us. And, two of them did not continue study because of high contrast threshold SD
at incongruent trials (SD1 = 1.1776e+26, SD2 = 9.3452e+22) indicating true error (Kingdom & Prins, 2010); and also, their thresholds at incongruent trials barely reached 80% proportion correct which was nearly at our threshold computation value. We determined our sample size with G* power analysis based on the e↵ect size of the Kok et. al. (2012) study and power of 0.8, and the total sample size estimated was 5.
2.1.2. Stimuli and Apparatus
The main stimuli were two-dimensional sinusoidal grating in Gaussian envelop with a spatial frequency of 2 cycles per degree and a phase of 0; that is, Gabor gratings. The contrast of gratings was defined by Michelson contrast, commonly used for the definition of contrast for sinusoidal gratings. The formula used to define Michelson contrast is
CM = (Lmax Lmin)/(Lmax Lmin)
where Lmax represents the maximum luminance value and Lmin represents the
mini-mum luminance value based on the sinewave. And, the formula used to create vertical Gabor grating is
L(x, y) = L0[1 + CM ⇤ sin(2⇡fx )⇤ exp( (x2+ y2)/ )]
where L0 represents background luminance, f represents frequency of sine wave and
represents phase of sine wave, and represents sigma of determines the size of grating. A similar formula was used to create horizontal gratings. Target stimulus is Gabor grating which is embedded in a random noise patch based on Gaussian distribution with µ of 0 and of 22. Nontarget stimulus or noise comprises of only this random Gaussian noise patch.
Psychtoolbox-3 (Brainard, 1997) and Matlab (Mathworks, Natick, MA) were used to create and deliver stimuli. Stimuli were presented on a grey background with
the luminance of 16 cd/m2 and on a 22 inch HP P1230 CRT monitor with a screen
resolution of 1024x786 and a refresh rate of 120 Hz. Cambridge Research Systems Ltd. SpectroCAL colorimeter was used to prepare a gray-scale look-up table in order to present the luminance of gratings more accurately. Also, Rigol DS1204B Digital Oscilloscope was used to check the precise timing of the duration of the stimulus presentation. The viewing distance was 57 cm, and the center of stimuli were pre-sented on 8 visual angle at the left and right sides of the fixation point. The head of participant was kept stable by using a chin rest. Data were collected in the dark psychophysics laboratory in National Magnetic Resonance Research Center in Bilkent University.
2.1.3. Design
At the beginning of each trial, a Gabor grating was presented at the fixation point for 2000 ms as a task-irrelevant expectation cue indicating the orientation of target Gabor grating depending on the cue validity (explained below). The orientation of cue and target gratings was either vertical or horizontal. After 500 ms blank interval, two random noise patches were presented on the left and right visual field for 33 ms, and one of them contained the target Gabor grating. This was immediately followed by backward noise masks for 60 ms. The task of participants was to indicate the spatial location of the target grating by using arrow keys. After a keypress, a feedback was presented for 500 ms to maintain a motivation. An inter-trial interval was 500 ms. Also, a fixation mark was presented throughout experiment to keep participants fixated (see Figure 2.1).
Two alternative forced choice interleaved staircase with one up - one down until the first two reversals then one up - three down procedure was applied to manipulate the Michelson contrast of the target Gabor grating. The number of staircases were determined based on the starting points of the target contrast intensity (i.e. whether
. Figure 2.1: Design of Experiment 1. At the beginning of each trial, task-irrelevant cue grating indicating the orientation of target grating was presented. Two random noise patches, one of which contained target grating, were presented, which immediately followed by backward mask. Participants were instructed to indicate the spatial location of target grating. a) Example of vertical congruent trial. b) Example of horizontal incongruent trial. c) Example of neutral trial.
a staircase were up or down), an orientation (i.e. whether the orientation of a target grating was vertical or horizontal) and a congruency (i.e. whether a trial was con-gruent or inconcon-gruent), and each staircase contained 30 trials. The stepsize was 0.04. The minimum contrast intensity was 0.04, the maximum was 0.96. Yet, the maxi-mum and minimaxi-mum starting points were determined separately for each participant based on practice trials where participants were familiarized with the experiment and adapted to the dark.
Experimental Sessions. Data were collected at four di↵erent sessions whose order was randomized for each participant, and the validity of expectation cue was di↵erent at each one. When the orientation of both cue and target Gabor gratings were the same, it was called a congruent trial; on the other hand, when they were di↵erent, it was called an incongruent trial.
100%-validity session. In this session, a cue grating provided information about the orientation of a target grating with 100% validity which was the relative frequency with which the cue predicted the target orientation correctly. The number of trials was 120 all of which were congruently cued. The orientation of cue and target Gabor gratings was horizontal at 60 trials and vertical at 60 trials. There were four di↵erent staircases in terms of the starting points of the contrast intensity and orientation (i.e. one staircase for maximum horizontal, one for minimum horizontal, one for maximum vertical, one for minimum vertical).
75%-validity session. In this session, a cue grating provided information about the ori-entation of a target grating with 75% validity. The number of trials was 480. 75% of them (360 trials) were congruently cued, and 25% of them (120 trials) were incongru-ently cued. Again, half of these congruent and incongruent trials included horizontal orientation and the other half included vertical orientation in the target Gabor grat-ing. There were breaks after 120 trials during which participants were not allowed to
leave the dark room in order not to the distort dark adaptation. There were 16 dif-ferent staircases in terms of congruency, the starting points of the contrast intensity and orientation (i.e. three staircases for congruent maximum horizontal, three for congruent minimum horizontal, three for congruent maximum vertical, three for con-gruent minimum vertical, one for maximum horizontal, one for minimum horizontal, one for maximum vertical, one for minimum vertical).
50%-validity session. In this session, a cue grating provided information about the orientation of a target grating with 50% validity. The number of trials was 240. 50% of them (120 trials) were congruently cued, and the other half were incongruently cued. Again, half of these congruent and incongruent trials included horizontal orientation and the other half included vertical orientation in the target grating. There were breaks after 120 trials during which participants were not allowed to leave the dark room in order not to the distort dark adaptation. There were eight di↵erent staircases in terms of congruency, the starting points of the contrast intensity and orientation (i.e. one staircase for congruent maximum horizontal, one for congruent minimum horizontal, one for congruent maximum vertical, one for congruent minimum vertical, one for maximum horizontal, one for minimum horizontal, one for maximum vertical, one for minimum vertical).
Neutral session. In this condition, a question mark was presented instead of a cue grating, and it did not provide any information about the orientation of a target grating. As a result, participants were unable to develop expectation about the orientation of upcoming target stimulus. The number of trial was 120. The orientation of a target grating was horizontal at 60 trials and vertical at 60 trials. There were four di↵erent staircases in terms of the starting points of the contrast intensity and orientation (i.e. one staircase for maximum horizontal, one for minimum horizontal, one for maximum vertical, one for minimum vertical).
2.2. Results
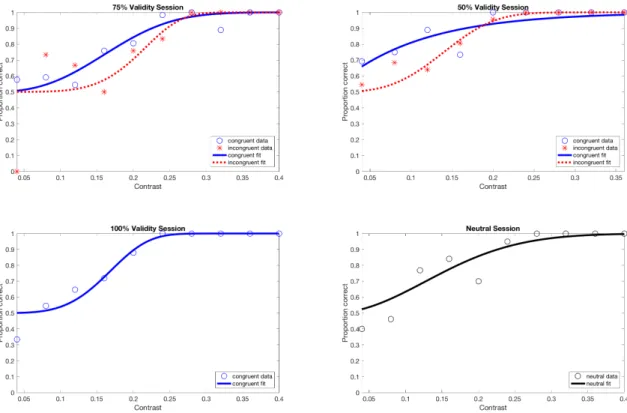
Contrast thresholds at the proportion correct of 79% were computed separately for congruent and incongruent trials and 100% and neutral conditions with Mat-lab Palamedes toolbox (Kingdom & Prins, 2010). Lapse rate was fixed at 0, and guess rate was fixed at 0.5. Weibull function was fitted to raw data. Threshold standard deviation was calculated using bootstrapping. Figure 2.2 shows an example psychometric function that shows the data along with the psychometric function fit for one participant (see Appendix A for all participants).
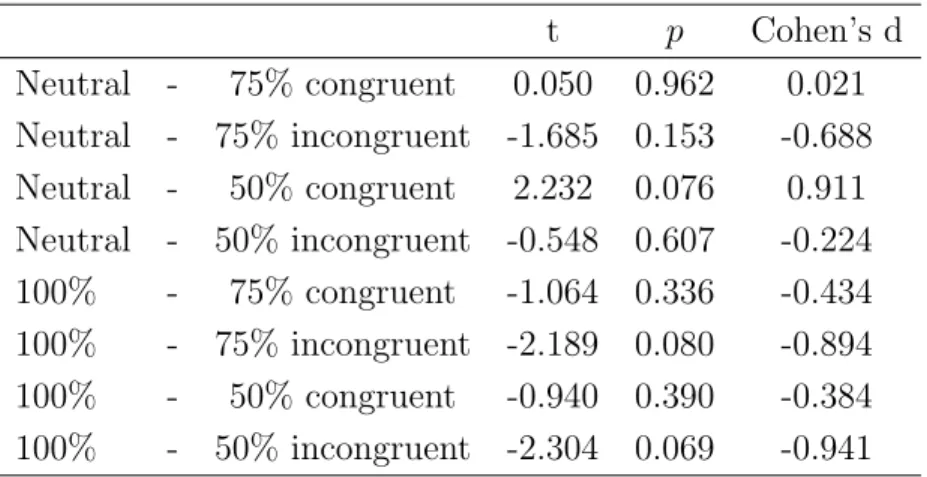
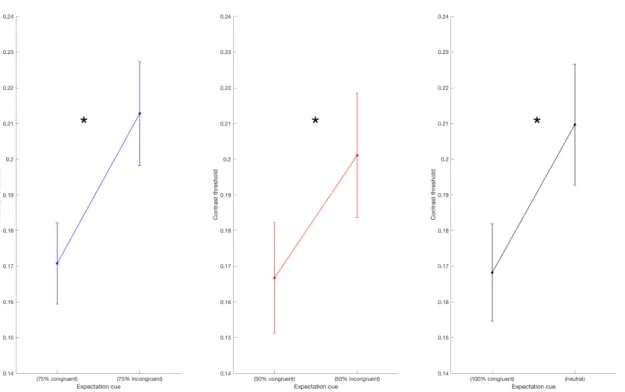
We performed paired-sample t-test to test the di↵erence between congruent and in-congruent trials at 75% and 50% validity conditions and between 100% and neutral conditions (see Figure 2.3 and Table 2.1), then we corrected the significance values with Bonferroni correction using JASP. When a cue validity was 75%, contrast thresh-old for congruent trials was significantly lower than contrast threshthresh-old for incongruent trials (t = 7.606, p = 0.001, Cohen’s d = 3.105). However, contrast threshold of con-gruent and inconcon-gruent trials did not di↵er significantly after Bonferroni correction at the 50% validity condition (t = 2.708, p = 0.042, Cohen’s d = 1.105). And, there was no di↵erence between 100% validity and neutral conditions (t = 1.983, p = 0.104, Cohen’s d = 0.810). Also, 100% validity and neutral conditions were taken as base-line conditions, and via JASP pairwise comparisons with Bonferroni correction was performed to test the di↵erence between baseline conditions and congruent and in-congruent trials of 75% and 50% validity conditions, and none of them was significant (see Table 2.2).
2.3. Intermediate Discussion
In this study, we investigated whether expectation has an e↵ect on contrast threshold while participants’ detecting the spatial location of the target grating with categorical
Figure 2.2: Psychometric Function of Subject 1 in Experiment 1. Contrast thresholds at the proportion correct of 79% were computed for all experimental sessions.
Table 2.1: Result of Experiment 1
t p Cohen’s d
75% congruent - 75% incongruent 7.606 0.001 3.105 50% congruent - 50% incongruent 2.708 0.042 1.105 Neutral - 100% congruent 1.983 0.104 0.810
Figure 2.3: Mean contrast threshold data in Experiment 1. Contrast threshold was significantly lower at congruent trials than incongruent trials only when expectation cue was 75% valid.
Table 2.2: Pairwise Comparison in Experiment 1
t p Cohen’s d Neutral - 75% congruent 0.050 0.962 0.021 Neutral - 75% incongruent -1.685 0.153 -0.688 Neutral - 50% congruent 2.232 0.076 0.911 Neutral - 50% incongruent -0.548 0.607 -0.224 100% - 75% congruent -1.064 0.336 -0.434 100% - 75% incongruent -2.189 0.080 -0.894 100% - 50% congruent -0.940 0.390 -0.384 100% - 50% incongruent -2.304 0.069 -0.941
orientation values, and whether this e↵ect is varied with the validity of expectation information. We found that when the target grating is preceded by a congruent ex-pectation cue, contrast threshold is lower compared to the target grating preceded by an incongruent cue, and this occurs only when prior categorical orientation infor-mation is highly valid. Our results support that expectation leads to a perceptual benefit in terms of detecting the spatial location of the stimulus with lower contrast level and embedded in a noise. Also, the lack of contrast threshold di↵erence between 100% validity and neutral conditions gives rise to thought that contrast threshold seems not to decrease at congruent trials but increase at incongruent trials.
CHAPTER 3
EXPERIMENT 2
We provided categorical orientation-related information for cue and target gratings in Experiment 1. In Experiment 2, we provide prior orientation information with specific orientation range intervals instead of categorical vertical and horizontal ori-entation values. We informed participants prior to the experimental sessions that the orientation of a target grating may be any of 360 , and the presentation of this cued orientation values are more probable, and this probability depends on the cue validity. Again, we hypothesize that contrast threshold is lower when prior proba-bility information is congruent to a target grating. In addition, the increase in the range of possible orientation values at cue and target gratings causes an increase in the computational burden and ambiguity; therefore, the e↵ect of expectation should be more salient. This may also reflect the validity of expectation cue.
3.1. Method
3.1.1. Participants
Three males and four females with normal or corrected-to-normal vision participated in the experiment voluntarily. Their ages were between 23 and 28 (M = 25.2, SD = 1.9). Five of them were right handed, and two of them were left handed. The
informed consent forms approved by the Ethics Committee of Bilkent University were distributed to participants, and their written consents were taken at the beginning of the experiment. One participant did not continue the study after the first session because of high contrast threshold SD at incongruent trials (SD = 7.2251e+22); and also, the threshold at incongruent trials barely passed 80% proportion correct.
3.1.2. Design
The experimental setup, stimuli and design were the same as in Experiment 1. The main di↵erence was related to the orientation of Gabor gratings. An expectation cue was either vertical or horizontal grating with arcs indicating ±15 (see Figure 3.1). At congruent trials, if an expectation cue was vertical with arcs at the top and the bottom, it indicated that the next target Gabor grating was±15 around 0 whereas if a cue grating was horizontal with two arcs at left and right sides, the upcoming target grating was ±15 around 90 . At incongruent trials, the orientation of the target grating was randomly determined among one of the values outside the cued range of ±30 around 0 or 90 . To prevent any possible confusion, there was 15 di↵erence between the range of congruent and incongruent trials. The orientation value of the target grating was randomly chosen from uniform distribution. Similar to Experiment 1, the expectation cue validity was 75%, 50%, 100% or neutral (see Figure 3.2 for experimental design).
3.2. Results
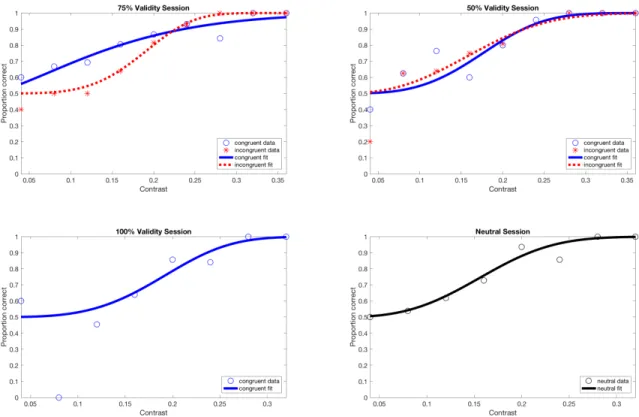
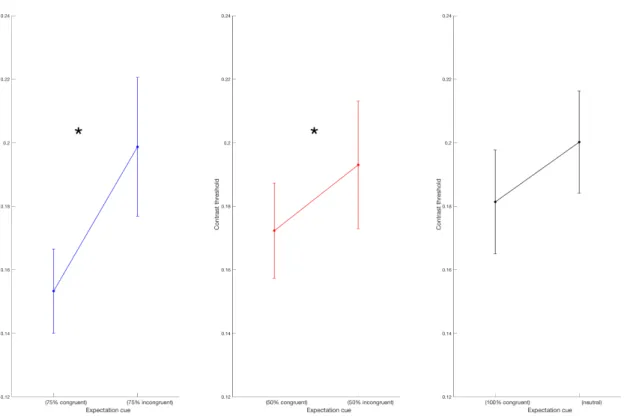
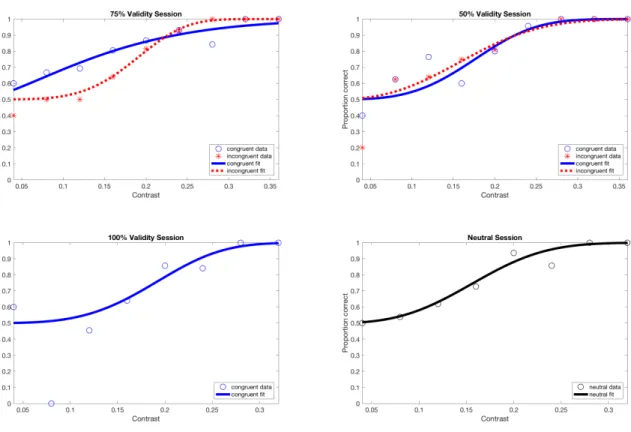
We computed contrast thresholds as in Experiment 1. Figure 3.3 shows an example psychometric function that shows the data along with the psychometric function fit for one participant (see Appendix B for all participants). And, we performed paired-sampled t-test with Bonferroni correction (see Figure 3.4 and Table 3.1) as in Experiment 1. We found significantly lower contrast threshold for congruent trials than incongruent trials at the 75% validity condition (t = 11.842, p = 0.001, Cohen’s
. Figure 3.1: Gabor Orientation Intervals in Experiment 2. The orientation interval colored with red was ±15 around 0 or 90 , and this range was indicated by expec-tation cue. If the trial was congruent, the orienexpec-tation of target Gabor grating was within this red interval. The orientation interval colored with green was±60 around 0 or 90 , and if the trial was incongruent, the orientation of target Gabor grating was within this green interval. The orientation of target Gabor grating was out of the range between red and green areas to prevent any possible confusion. a) Vertical cued trial where black arcs at left and right sides of cue grating indicates±15 around 90 . b) Horizontal cued trial where black arcs at the top and the bottom sides of cue grating indicates ±15 around 0 .
. Figure 3.2: Design of Experiment 2. At the beginning of each trial, task-irrelevant cue grating indicating specific range for the orientation of target grating was presented. Two random noises, one of which contained target grating, were presented. This was immediately followed by backward mask. The task of participants was to indicate the spatial location of target grating. As opposed to Experiment 1, the orientation of cue and target gratings was non-categorical. a) Example of a vertical congruent trial. b) Example of a horizontal incongruent trial. c) Example of a neutral trial.
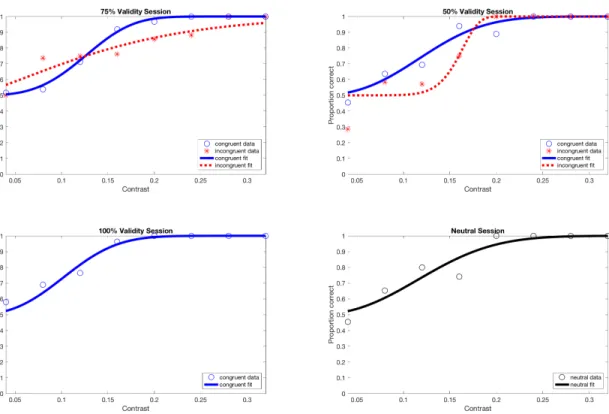
Figure 3.3: Psychometric Function of Subject 1 in Experiment 2. Contrast thresholds at the proportion correct of 79% were computed for all experimental sessions.
d = 4.835) and at the 50% validity condition (t = 4.226, p = 0.008, Cohen’s d = 1.725). Also, the contrast threshold of the 100% validity condition was significantly lower than the threshold of the neutral condition (t = 4.678, p = 0.005, Cohen’s d = 1.910). Also, 100% and neutral conditions were taken as baseline conditions, and pairwise comparisons with Bonferroni correction was performed to test di↵erence between baseline conditions and congruent and incongruent trials of 75% and 50% valid conditions as in Experiment 1, and there was significant di↵erence between the neutral condition and the 50% valid congruent condition (t = 7.784, p < 0.001, Cohen’s d = 3.178) and between the 100% validity condition and the 75% valid incongruent condition (t = -5.207, p = 0.003, Cohen’s d = -2.126) (see Table 3.2)
. Figure 3.4: Mean contrast threshold data in Experiment 2. Contrast threshold was significantly lower at congruent trials than incongruent trials when expectation cue was 75% and 50% valid, and lower at the 100% validity condition than the neutral condition.
Table 3.1: Result of Experiment 2
t p Cohen’s d
75% congruent - 75% incongruent 11.842 0.001 4.835 50% congruent - 50% incongruent 4.226 0.008 1.725 Neutral - 100% congruent 4.678 0.005 1.910
Table 3.2: Pairwise Comparison in Experiment 2 t p Cohen’s d Neutral - 75% congruent 2.585 0.049 1.055 Neutral - 75% incongruent -1.663 0.157 -0.679 Neutral - 50% congruent 7.784 <0.001 3.178 Neutral - 50% incongruent 0.591 0.581 0.241 100% - 75% congruent -1.225 0.275 -0.500 100% - 75% incongruent -5.207 0.003 -2.126 100% - 50% congruent 0.638 0.551 0.260 100% - 50% incongruent -2.318 0.068 -0.946 3.3. Intermediate Discussion
In this study, we investigated whether expectation has an e↵ect on contrast thresh-old while participants’ detecting the spatial location of the target grating with non-categorical orientation values, and whether this e↵ect is varied with the validity of expectation information. We found that following congruent prior information indi-cating a specific orientation range, participants were able to detect the spatial location of the target grating with lower contrast level and non-categorical orientation values independent from how valid prior probability information was. Our results support that expectation leads to a perceptual benefit at the detection of the spatial loca-tion of the stimulus with lower contrast level.In addiloca-tion, we provide support that as stimulus ambiguity increases, the e↵ect of expectation is more salient, and that expectation facilitates increased computational burden.
The di↵erence between Experiment 1 and Experiment 2 is related to whether the ori-entation of cue and target gratings is categorical or not; in other words, expectation provides specific orientation information or range. In Experiment 1, both expectation cue and target gratings were categorical; that is, they were either vertical or horizon-tal. This may probably result in the formation of further expectation in addition to
our manipulation. When a vertical orientation is cued with 75% valid expectation cue, a target grating can be vertical or horizontal; therefore, participants expect the target grating’s being vertical with 75% validity and its being horizontal with 25% validity. In other words, they expect both orientations with giving more priority or importance to the cued one. This means that participants have the second possi-ble orientation information about a target grating which may diminish the e↵ect of our expectation manipulation. On the other hand, in Experiment 2, we provided prior probability information indicating a specific orientation range; and also, the instruction that the orientation of the target grating can be one of 360 . This makes both expectation cue and the orientation of the target grating less specific and more ambiguous; therefore, the formation of the further expectation additional to our ma-nipulation is prevented. Therefore, based on our results, we infer that because of the increased ambiguity in expectation cue and target grating’s orientation, the e↵ect of expectation is enhanced.
In Experiment 2, expectation cue indicates a specific orientation range for the up-coming target grating whose orientation is known as one of 360 by participants. As a result, the number of the possible target grating orientation is much larger than the number of the possible cued orientation. This imbalance or asymmetry in the possible orientation values makes the task at congruent trials easier than the task at incongruent trials, and the computational burden gets increased at incongruent tri-als. Therefore, it may be more energy-efficient for participants to focus more on the cued orientation range.To address this possible e↵ect we designed another experiment, which will be discussed in the next chapter.
CHAPTER 4
EXPERIMENT 3
In Experiment 2, we provided prior orientation information with a specific range, but the instruction was that the orientation of the target grating was any of 360 . This causes an asymmetry in the task difficulty between congruent and incongruent trials. Therefore, in this experimental series, we provide prior probability information indicating a specific orientation range and the orientation of the target grating within this specific orientation range. That is, the main di↵erence between Experiment 2 and current experimental series is related to the possibilities of the target grating orientation (i.e. any of 330 in Experiment 2, 31 in Experiment 3A and 61 in Experiment 3B).
4.1. Experiment 3A
In Experiment 3A, we provide prior orientation information and the target grating with the specific range of ±15 around 0 or 90 . Again, we hypothesize that con-trast threshold is lower when prior probability information is congruent to the target grating.
4.1.1. Method
4.1.1.1. Participants
Three males and three females with normal or corrected-to-normal vision participated in the experiment voluntarily. Their ages were between 23 and 28 (M = 25.5, SD = 1.9). Four of them were right handed, and two of them were left handed. The informed consent forms approved by the Ethics Committee of Bilkent University were distributed to participants, and their written consents were taken at the beginning of the experiment.
4.1.1.2. Design
The experimental setup, stimuli and design were the same as in Experiment 2. The main di↵erence was related to the orientation of target gratings (see Figure 4.1). As in Experiment 2, expectation cue was either vertical or horizontal grating with arcs indicating±15 . Yet, in Experiment 3A, the orientation of target grating was always ±15 around 0 or 90 despite of the congruency of a trial. And, participants were informed that the orientation of the target grating was±15 around 0 or 90 . Similar to Experiment 2, the expectation cue validity was 75%, 50%, 100% or neutral (see Figure 4.2 for experimental design).
4.1.2. Results
We computed contrast thresholds (see Figure 4.3 for a psychometric function example and Appendix C for all psychometric functions), and we performed paired-sampled t-test with Bonferroni correction (see Figure 4.4 and Table 4.1) and pairwise comparison (see Table 4.2) as in previous experiments. We found significantly lower contrast threshold for congruent trials compared to incongruent trials at the 75% validity condition (t = 6.338, p = 0.001, Cohen’s d = 2.587) and at the 50% validity conditions
. Figure 4.1: Gabor Orientation Intervals in Experiment 3A. The orientation interval colored with red was ±15 around 0 or 90 , and this range was indicated by expec-tation cue. If the trial was congruent, the orienexpec-tation of target Gabor grating was within this red interval. The orientation interval colored with green was±15 around 0 or 90 , and if the trial was incongruent, the orientation of target Gabor grating was within this green interval. a) Vertical cued trial. b) Horizontal cued trial.
. Figure 4.2: Design of Experiment 3A. At the beginning of each trial, task-irrelevant cue grating indicating specific range for the orientation of target grating was pre-sented. Two random noise patterns, one of which contained target grating, were presented. This was immediately followed by backward mask. The task of partici-pants was to indicate the spatial location of target grating. a) Example of vertical congruent trial. b) Example of horizontal incongruent trial. c) Example of neutral trial.
Figure 4.3: Psychometric Function of Subject 1 in Experiment 3A. Contrast thresh-olds at the proportion correct of 79% were computed for all experimental sessions.
(t = 5.028, p = 0.004, Cohen’s d = 2.053). However, the contrast threshold of the 100% validity condition was not significantly lower than the threshold of the neutral condition (t = 1.331, p = 0.241, Cohen’s d = 0.543). Pairwise comparisons between baseline conditions and congruent and incongruent conditions of 75% and 50% validity conditions were computed, and after Bonferroni correction of critical alpha value, there was significant di↵erence between the neutral condition and the 75% valid congruent condition (t = 4.883, p = 0.005, Cohen’s d = 1.993).
Table 4.1: Result of Experiment 3A
t p Cohen’s d
75% congruent - 75% incongruent 6.3386 0.001 2.587 50% congruent - 50% incongruent 5.028 0.004 2.053 Neutral - 100% congruent 1.331 0.241 0.543
. Figure 4.4: Mean contrast threshold data in Experiment 3A. Contrast threshold was significantly lower at congruent trials than incongruent trials when cue validity was 75% and 50%.
Table 4.2: Pairwise Comparison in Experiment 3A
t p Cohen’s d Neutral - 75% congruent 4.883 0.005 1.993 Neutral - 75% incongruent 0.163 0.877 0.066 Neutral - 50% congruent 3.009 0.030 1.229 Neutral - 50% incongruent 0.552 0.604 0.225 100% - 75% congruent 1.788 0.134 0.730 100% - 75% incongruent -1.021 0.354 -0.417 100% - 50% congruent 0.569 0.594 0.232 100% - 50% incongruent -0.711 0.509 -0.290
4.1.3. Intermediate Discussion
In this study, we investigated whether prior information indicating a specific orienta-tion range has an e↵ect on contrast threshold in terms of detecting the spatial locaorienta-tion of the target grating with a specific orientation range, and whether this e↵ect is varied with the validity of expectation information. We found that following congruent prior probability information with 75% and 50% validity, participants were able to detect the spatial location of the target grating with lower contrast level and non-categorical orientation values with a specific range. Again, we provide support that congruent prior probability information enables to detect stimulus with lower contrast level; therefore, expectation enhances the perceptual interpretation of ambiguous stimulus.
The range of possible cue orientation is lower than the range of target orientation in Experiment 2; therefore, the ambiguity of target stimulus is larger than that of expectation cue. As opposed to Experiment 2, the range of possible target orientation values are the same for congruent and incongruent trials in Experiment 3A; thus, the ambiguity of target stimulus equals to that of cue. And, the ambiguity of target stimulus decrease in Experiment 3A than Experiment 2, which may be the reason of the lack of di↵erence between 100% validity and neutral condition.
4.2. Experiment 3B
The increase in the number of the possible orientation values may make the compu-tational process harder. Because expectation makes the use of the limited capacity for the computational process more efficient and enhanced, the e↵ect of expectation may be more salient. Therefore, in Experiment 3B, we test what happens when we increase the possible orientation values, and we provide prior orientation information and the target grating with the specific range of ±30 around 0 or 90 . Again, we hypothesize that contrast threshold is lower when prior probability information is
congruent to the target grating.
4.2.1. Method
4.2.1.1. Participants
Three males and three females with normal or corrected-to-normal vision participated in the experiment voluntarily. Their ages were between 23 and 28 (M = 25.5, SD = 1.9). Four of them were right handed, and two of them were left handed. The informed consent forms approved by the Ethics Committee of Bilkent University were distributed to participants, and their written consents were taken at the beginning of the experiment.
4.2.1.2. Design
The experimental setup, stimuli and design were the same as in Experiment 3A. The main di↵erence was related to the orientation of cue and target gratings was ±30 around 0 or 90 (see Figure 4.5). Similar to Experiment 3A, the expectation cue validity was 75%, 50%, 100% or neutral (see Figure 4.6 for experimental design).
4.2.2. Results
We computed contrast thresholds (see Figure 4.7 for a psychometric function example and Appendix D for all psychometric functions), and we performed paired-sampled t-test with Bonferroni correction (see Figure 4.8 and Table 4.3) and pairwise comparison (see Table 4.4) as in previous experiments. We found significantly lower contrast threshold for congruent trials compared to incongruent trials at the 75% validity condition (t = 7.146, p = 0.001, Cohen’s d = 2.917). Contrast threshold of congruent and incongruent at 50% validity condition were not significantly di↵erent (t = 1.204, p = 0.283, Cohen’s d = 0.491), and the contrast threshold of the 100% validity condition was not significantly lower than the threshold of the neutral condition (t = 2.667, p
. Figure 4.5: Gabor Orientation Intervals in Experiment 3B. The orientation interval colored with red was ±30 around 0 or 90 , and this range was indicated by expec-tation cue. If the trial was congruent, the orienexpec-tation of target Gabor grating was within this red interval. The orientation interval colored with green was±30 around 0 or 90 , and if the trial was incongruent, the orientation of target Gabor grating was within this green interval. a) Vertical cued trial. b) Horizontal cued trial.
. Figure 4.6: Design of Experiment 3B. At the beginning of each trial, task-irrelevant cue grating indicating specific range for the orientation of target grating was pre-sented. Two random noises, one of which contained target grating, were prepre-sented. This was immediately followed by backward mask. The task of participants was to indicate the spatial location of target grating. a) Example of vertical congruent trial. b) Example of horizontal incongruent trial. c) Example of neutral trial.
Figure 4.7: Psychometric Function of Subject 1 in Experiment 3B. Contrast thresh-olds at the proportion correct of 79% were computed for all experimental sessions.
= 0.088, Cohen’s d = 1.089). Pairwise comparisons between baseline conditions and congruent and incongruent conditions of 75% and 50% validity conditions were non-significant.
Table 4.3: Result of Experiment 3B
t p Cohen’s d
75% congruent - 75% incongruent 7.146 0.001 2.917 50% congruent - 50% incongruent 1.204 0.283 0.491 Neutral - 100% congruent 2.66 0.044 1.089
4.2.3. Intermediate Discussion
In this study, we investigated whether prior information indicating a specific orienta-tion range has e↵ect on contrast threshold in terms of detecting the spatial locaorienta-tion of target grating with a specific orientation range, and whether this e↵ect is varied
. Figure 4.8: Mean contrast threshold data in Experiment 3B. Contrast threshold was significantly lower at congruent trials than incongruent trials only when expectation cue was 75% valid.
Table 4.4: Pairwise Comparison in Experiment 3B
t p Cohen’s d Neutral - 75% congruent 2.961 0.031 1.209 Neutral - 75% incongruent 0.506 0.634 0.207 Neutral - 50% congruent 2.216 0.078 0.905 Neutral - 50% incongruent 1.988 0.103 0.812 100% - 75% congruent 1.514 0.190 0.618 100% - 75% incongruent -1.330 0.241 -0.543 100% - 50% congruent 0.675 0.530 0.276 100% - 50% incongruent -1.137 0.307 -0.464
with the validity of expectation information. We found that following congruent prior probability information indicating a specific orientation range, participants were able to detect the spatial location of the target grating with lower contrast level, non-categorical orientation values and embedded in a noise when the validity of prior information was high.
The di↵erence between Experiment 2 and Experiment 3A is related to whether the orientation of a target grating has specific range or not. That is, in Experiment 3A, the orientation of both cue and target gratings was between ±15 around 0 or 90 . On the other hand, in Experiment 2, the orientation of the target grating was any of 360 whereas the orientation of the cue grating was between ±15 around 0 or 90 . This imbalance in the range of possible orientations at congruent and incongruent trials in Experiment 2 may cause participants to rely more on the cued orientation values since it leads to the computational easiness. Therefore, we infer that the more the task becomes computationally difficult, the more salient the e↵ect of expectation should be. In order to test this, we increased the number of possible orientation values while keeping them equal at congruent and incongruent trials in Experiment 3B (i.e. from ±15 to ±30 ). However, the findings in Experiment 3B were not in line with our assumption. That is, although the computational processing was more difficult in Experiment 3B than Experiment 3A, the e↵ect of expectation is not salient. That is, its e↵ect was no more found in the 50% validity condition despite of the existence of the tendency. Therefore, the computational burden caused from the increase in the number of the possible orientation values not between the experimental manipulation but within the single manipulation may be more critical for the observation of expectation facilitation.
Previous studies provide clear prior probability information to manipulate expecta-tion as in Experiment 1. To the best of our knowledge, the use of ambiguous prior